Company | Deal | Restrictions | Coupon | Start | End |
A Small Orange [Reviews] | 85% Off all new plans + 2X Memory (VPS | 2X Memory on VPS only | EPIC | 11/23/16 | 11/29/16 |
A2 Hosting | 67% off shared hosting | BFCM67 | Cyber Monday | 12/02/16 | |
A2 Hosting | 50% off Managed & Core VPS Hosting | MANVPS50 | Cyber Monday | 12/02/16 | |
A2 Hosting | 40% off Reseller Hosting | RESELL40 | Cyber Monday | 12/02/16 | |
A2 Hosting | 25% off Sprint Dedicated Server (Unmanaged, Core, Managed) | SPRINT25 | Cyber Monday | Cyber Monday | |
Cloudways | 25% off all plans for first 3 months | Must get credit card authorized and new customers only. | HOLIDAY25 | Now | 11/30/16 |
DreamHost [Reviews] | 50% off Shared Hosting | Now | Cyber Monday 3pm PDT | ||
DreamHost [Reviews] | DreamPress 25% Off | Now | Cyber Monday 3pm PDT | ||
FlyWheel [Reviews] | 25% Off (3 Months Free) | Annual Subscription Only | flyday2016 | Now | Cyber Monday |
GoDaddy [Reviews] | $1/mo Managed WordPress Hosting | New purchase only, 12 month term | hos1gbr22 | Now | 12/31/16 |
HostGator [Reviews] | 65% off hosting, 1 hour flash sales for 75% off | New plans only | 11/25/16 12 pm CST | 11/28 11:59 PM CST | |
Kickassd | 6 Months for $6 | Little Kicker Plan Only. Limited to 50. | 6FOR6 | Now | 11/29/16 |
Kinsta | 30% off first month | Must open a support ticket with coupon code to apply it post-purchase | ReviewSBF16 | Now | 11/29/16 |
MediaTemple [Reviews] | 40% off one year of hosting | WordPress / Shared / VPS levels 1+2 only | CYBER2016 | 11/27/16 | 11/29/16 |
Nexcess | 70% Off First Month | Dedicated or Shared Servers | NEX70OFF | Black Friday | Cyber Monday |
Pressjitsu | 50% off for 3 months after free trial | Not on enterprise plans | BF2016 | Now | 11/29/16 |
SiteGround [Reviews] | 70% off annual shared hosting plans | Black Friday | Cyber Monday | ||
WPEngine [Reviews] | 30% off first payment | cyberwknd | Now | Cyber Monday | |
WPX Hosting (Traffic Planet Hosting) | $1 for First Month on Business (normally $24.99), Professional (normally $49.99) and Elite (normally $99). | New Customers Only | 00:01 AМ Wednesday, November 23, 2016 (EST) | 11:59 PМ Wednesday, November 30, 2016 (EST) | |
WPX Hosting (Traffic Planet Hosting) | Prepay 3 Years, Get 5 Years | New & Existing Customers | 00:01 AМ Wednesday, November 23, 2016 (EST) | 11:59 PМ Wednesday, November 30, 2016 (EST) |
Monthly Archives: November 2016
WordPress.com VIP Hosting Review (2016)
WordPress.com VIP participated for the first time in WordPress Hosting Performance Benchmarks. They were easily the most expensive service tested, clocking in at $5,000/month. They also host some of the most popular WordPress sites on the web and being Automattic's flagship hosting product, it has some huge expectations riding on it.
Products
Company | Plan | Monthly Price | Visitors Allowed | Disk Space | Bandwidth | Sites Allowed |
WordPress.com VIP | Basic | $5,000 | Unlimited | Unlimited | Unlimited | 5 |
Performance Review
LoadStorm Results
Company | Total Requests | Total Errors | Peak RPS | Average RPS | Peak Response Time(ms) | Average Response Time(ms) | Total Data Transferred (GB) | Peak Throughput (MB/s) | Average Throughput (MB/s) |
WordPress.com VIP | 4660190 | 8151 | 3726.38 | 2588.99 | 8186 | 101 | 197.82 | 158.29 | 109.9 |
LoadStorm test logged in thousands of users to simulate heavy uncached load on the server, scaling up with more users on larger plans after the $25-50/month range. WordPress.com VIP handled this test with minimal errors and never hitting the response timeout limit of 15000ms. In fact, it had the lowest average response time and and peak response time.
Blitz Results
Company | Hits | Errors | Timeouts | Average Hits/Second | Average Response Time | Fastest Response | Slowest Response |
WordPress.com VIP | 146200 | 0 | 73 | 2437 | 6 | 3 | 21 |
The Blitz test is designed to make sure that static assets (which should be served from cache) are being handled properly and can scale to very heavy big spikes in traffic. WordPress.com VIP had a 17ms spread and a mere 73 timeouts out of 146,2000 requests. Certainly, top tier.
Uptime
Company | StatusCake | UptimeRobot |
WordPress.com VIP | 100 | 100 |
Perfect.
WebPageTest / WPPerformanceTester
I mention these because they are in the full testing but I won't bother putting them here. No company had any significant issue with either and it's not worth writing about. If you're very interested in seeing the geographical response times on WPT or what the raw computing power test of WPPerformanceTester measured, read the full results.
Conclusion
WordPress.com VIP stepped into the Enterprise level of our testing and proved itself worthy and earned our Top Tier WordPress Hosting Performance award. The huge expectations of being owned by the creator of WordPress, being one of the largest companies in the space and hosting some of the biggest brands in the world were met. The price for VIP is beyond what most site owners will ever likely spend, but for the few that can afford it, VIP's performance is certainly top notch.
The Sinking of Site5 – Tracking EIG Brands Post Acquisition
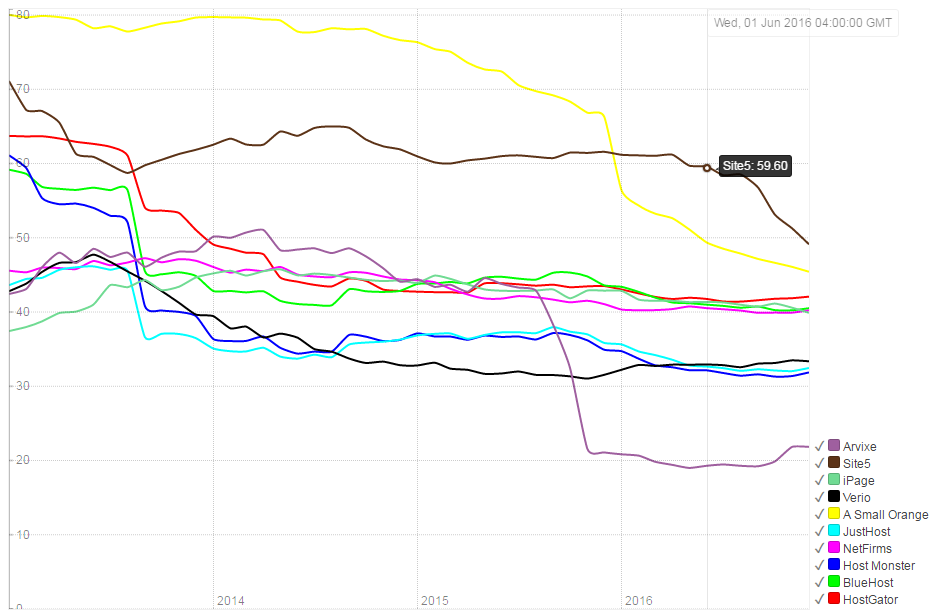
"You'll notice their ratings, in general, are not very good with Site5 (their most recent acquisition) being the exception. iPage was acquired before I started tracking data. BlueHost/HostMonster also had a decline, although the data doesn't start pre-acquisition. JustHost collapses post acquisition. NetFirms has remained consistently mediocre. HostGator collapses with a major outage a year after acquisition. Arvixe collapses a year after being acquired. Site5 is still very recent and hasn't shown any signs of decline yet." - The Rise and Fall of A Small Orange, January 2016
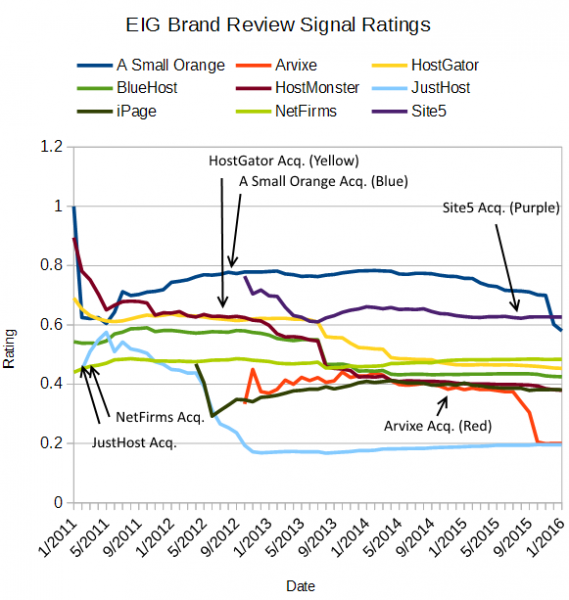
That's what I wrote at the beginning of 2016 as I watched A Small Orange's rating collapse in a pretty popular post called The Rise and Fall of A Small Orange, which documented ASO's Rise and Fall, but also the fall of many EIG brands. One thing I mentioned was the recent acquisition of Site5 (and Verio) which had a fairly good rating on Review Signal at the time of acquisition. The trend seemed to be roughly a year to see the drop in rating, post acquisition.
Site5 ~ 1 Year Later
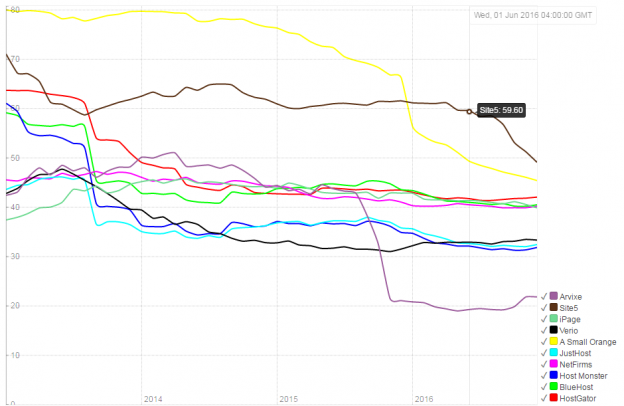
The acquisition of Site5 was announced August 2015. Here's the updated EIG brand tracking graph. One thing to note, this now uses the new rating algorithm which has a built in decay function to weight older reviews less. So the new graph uses the new algorithm but calculating each point in time as if it always used it. There will be some differences between it and the original graph (which prompted the change in algorithm). It's minimal for most brands, only when there is a major change in sentiment, it shows a change more quickly. Full details about the change can be read on Review Signal Ranking Algorithm Update.
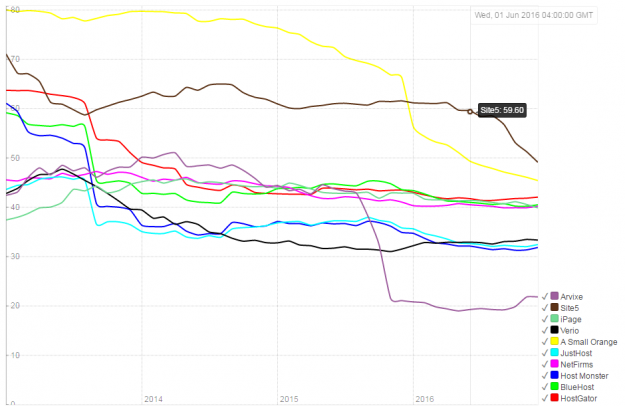
What you can see is the reputation remained relatively stable until about April 2016 and then started a slow but steady decline where it has dipped below 50% for the first time recently. As with nearly every brand, except A Small Orange, the decline happened within a year.
Since the original post there also hasn't been much movement in any other brands beyond Site5 crashing and A Small Orange continuing to slide downward. Verio didn't see a dip post-acquisition, but it had a pretty low rating to start with that put it in the bottom half of EIG brand ratings already.
Why Do EIG Brands Go Down Post Acquisition?
The longer I am in this industry, the more stories I hear. A Small Orange was such an interesting exception and I've heard a lot about it from a lot of people. It's relative independence and keeping the staff seemed to be the key to maintaining a good brand even within the EIG conglomerate.
Site5 offers what I imagine is more business-as-usual in the EIG world. Cut staff, migrate to EIG and maximize profit (in the short term). Site5's founder, Ben, reached out to a competitor, SiteGround, and arranged for them to hire a large number of Site5 staff that EIG had no plans on keeping according to SiteGround's blog. A very classy move from the former CEO and a seeming win for SiteGround, one of EIG's larger hosting competitors. I also saw similar behavior of long time staff all leaving when A Small Orange started to go downhill and staff from other EIG brands showed up.
Beyond simply trying to cut costs, you have to wonder why would you spend all that money acquiring these brands that have lots of customers, good reputations and talented staff that obviously are keeping the operation running successfully only to get rid of nearly all of that except the customers. But once you gut the staff, it seems like the customers notice, because it certainly shows up in the data I track.
Conveniently, EIG just published their Q3 2016 10-Q.
We have certain hosting and other brands to which we no longer allocate significant marketing or other funds. These brands generally have healthy free cash flow, but we do not consider them strategic or growth priorities. Subscriber counts for these non-strategic brands are decreasing. While our more strategic brands, in the aggregate, showed net subscriber adds during the quarter ended September 30, 2016, the net subscriber losses in non-strategic brands and certain gateway brands contributed to a decrease in our total subscribers of approximately 42,000 during the quarter. We expect that total subscribers will continue to decrease in the near term.
Overall, our core hosting and web presence business showed relatively slow revenue and subscriber growth during the first nine months of 2016. We believe that this is due to flat marketing expenditures relative to 2015 levels on this business in the first half of 2016 as a result of our focus on gateway products during that period, and to trends in the competitive landscape, including greater competition for referral sources and an increasing trend among consumers to search for web presence and marketing solutions using brand-related search terms rather than generic search terms such as “shared hosting” or “website builder”. We believe this trend assists competitors who have focused more heavily than we have on building consumer awareness of their brand, and that it has made it more challenging and more expensive for us to attract new subscribers. In order to address this trend, during the third quarter of 2016, we began to allocate additional marketing investment to a subset of our hosting brands, including our largest brands, Bluehost.com, HostGator and iPage. We plan to continue this increased level of marketing investment in the near term, and are evaluating different marketing strategies aimed at increasing brand awareness.
So the result of their current strategy this past quarter has been a net loss of 42,000 customers. They say their strategic brands on aggregate had a net subscriber increase and named the largest ones (BlueHost, HostGator, iPage) and they are going to focus on a subset of brands going forward. But the phrasing would seem to imply that some of the strategic brands experienced losses as well. It also means that the non-strategic brands lost more than 42,000 customers and pulled down the net subscribers to -42,000 customers last quarter.
The cap it all off, I got one of the most surprising emails from Site5 a couple days ago.
We wanted to let you know that we’ve decided to terminate the Site5 Affiliate program as of November 30th, 2016.
We want to thank you for your support of Site5, especially during our most recent move into Impact Radius, and we hope that you’ll consider promoting another one of Endurance’s other programs.
I guess Site5 isn't being considered a strategic brand if they are killing off the affiliate channel on it entirely, right after a big migration from Site5's custom affiliate program to Impact Radius. They also asked that affiliates promote HostGator now, which certainly fits in the strategic brand category.
It's extremely disappointing to see this trend continue of brands collapsing after a year in EIG's hands. What will be interesting going forward is that EIG hasn't acquired any new hosting brands for a while. They seem to be focused on their existing brands for now. I wonder if that will mean we will see any noticeable positive change or improvements in existing brands (or at least some of the strategic brands).
WPOven WordPress Hosting Review (2016)
WPOven participated for the second time in WordPress Hosting Performance Benchmarks. Last year they struggled with the LoadStorm test, but I'm happy to say that's no longer the case. They stepped up their performance including doubling the amount of memory for accounts while tests were on-going.
Products
Company | Plan | Monthly Price | Visitors Allowed | Disk Space | Bandwidth | Sites Allowed |
WPOven | Personal | $39.95 | Unlimited | 40GB | 4TB | No Limit |
They made it clear to me that the products are identical until the VIP level, each site has equal resources, the only difference in plans is that more sites are allowed.
Performance Review
LoadStorm Results
Company | Total Requests | Total Errors | Peak RPS | Average RPS | Peak Response Time(ms) | Average Response Time(ms) | Total Data Transferred (GB) | Peak Throughput (MB/s) | Average Throughput (MB/s) |
WPOven | 288369 | 0 | 217.85 | 160.21 | 5815 | 283 | 16.64 | 13.63 | 9.245 |
LoadStorm test logged in thousands of users to simulate heavy uncached load on the server, scaling up with more users on larger plans after the $25-50/month range. WPOven had no errors this year, a marked improvement and perfect result.
Blitz Results
Company | Hits | Errors | Timeouts | Average Hits/Second | Average Response Time | Fastest Response | Slowest Response |
WPOven | 26687 | 0 | 0 | 445 | 103 | 101 | 104 |
The Blitz test is designed to make sure that static assets (which should be served from cache) are being handled properly and can scale to very heavy big spikes in traffic. If the LoadStorm test was a clinic, this was absolute perfection. WPOven again had zero errors and a 3ms response spread.
Uptime
Company | StatusCake | UptimeRobot |
WPOven | 100 | 100 |
Perfect. Enough said.
WebPageTest / WPPerformanceTester
I mention these because they are in the full testing but I won't bother putting them here. No company had any significant issue with either and it's not worth writing about. If you're very interested in seeing the geographical response times on WPT or what the raw computing power test of WPPerformanceTester measured, read the full results.
Conclusion
WPOven put on an absolute clinic this year. On every test they performed perfectly. A whopping zero errors across all the load tests and perfect 100% uptime. WPOven easily earned the recognition of being a Top Tier WordPress Host.
DreamHost / DreamPress WordPress Hosting Review (2016)
DreamHost participated for the third year in a row in WordPress Hosting Performance Benchmarks. Last year, I wrote:
DreamPress improved their performance a lot over last round. In fact they did fantastically well on every load test once I got the opportunity to actually work with their engineers to bypass the security measures. However, they failed pretty badly on the uptime metrics. I have no idea what happened but I experienced a huge amount of downtime and ran into some very strange errors. If it wasn't for the severe downtime issues, DreamPress could have been in the top tier.
This year, they made even further progress and earned that Top Tier status. DreamHost also are the second highest rated shared hosting company here at Review Signal in terms of customer opinion.
Products
Company | Plan | Monthly Price | Visitors Allowed | Disk Space | Bandwidth | Sites Allowed |
DreamHost | DreamPress | $19.95 | Unlimited | 30GB | Unlimited | 1 |
Performance Review
LoadStorm Results
Company | Total Requests | Total Errors | Peak RPS | Average RPS | Peak Response Time(ms) | Average Response Time(ms) | Total Data Transferred (GB) | Peak Throughput (MB/s) | Average Throughput (MB/s) |
DreamHost | 295685 | 43 | 224.1 | 164.27 | 15063 | 339 | 16.06 | 13.5 | 8.922 |
LoadStorm test logged in thousands of users to simulate heavy uncached load on the server, scaling up with more users on larger plans after the $25-50/month range. DreamHost did exceptionally well with almost no errors and fast aerage response time.
Blitz Results
Company | Hits | Errors | Timeouts | Average Hits/Second | Average Response Time | Fastest Response | Slowest Response |
DreamHost | 29337 | 0 | 1 | 489 | 4 | 3 | 7 |
The Blitz test is designed to make sure that static assets (which should be served from cache) are being handled properly and can scale to very heavy big spikes in traffic. If the LoadStorm test was a clinic, this was absolute perfection. DreamHost was near perfect with a ridiculously quick 4ms average response time (which is likely due to being physically close to the testing server) and 4ms spread which is excellent.
Uptime
Company | StatusCake | UptimeRobot |
DreamHost | 99.97 | 99.97 |
Not much to say here beyond DreamHost had good uptime at 99.97%.
WebPageTest / WPPerformanceTester
I mention these because they are in the full testing but I won't bother putting them here. No company had any significant issue with either and it's not worth writing about. If you're very interested in seeing the geographical response times on WPT or what the raw computing power test of WPPerformanceTester measured, read the full results.
Conclusion
DreamHost continues to step up their performance game. Last year, a severe uptime issue knocked them out of earning awards. This year, there were no such problems. They handled every test near flawlessly and earned themselves a Top Tier WordPress Hosting Performance award. I always am happy to see companies continually improve their performance. It's good for the space to have another strong competitor at the entry level price range.
Pantheon WordPress Hosting Review (2016)
Pantheon participated for the third time in WordPress Hosting Performance Benchmarks. They've done well in the past earning top tier status in both previous tests. This year they had four plans entered into the following ranges: $25-50/month, $51-100/month, $201-500/month and Enterprise ($500+/month).
Products
Company | Plan | Monthly Price | Visitors Allowed | Disk Space | Bandwidth | Sites Allowed |
Pantheon 25-50 | Personal | $25 | 10,000 | 5GB | Unlimited | 1 |
Pantheon 51-100 | Professional | $100 | 100,000 | 20GB | Unlimited | 1 |
Pantheon 201-500 | Business | $400 | 500,000 | 30GB | Unlimited | 1 |
Pantheon Enterprise | Elite | $1,666.66 | Unlimited | 100GB+ | Unlimited | Priced Per Site |
Performance Review
LoadStorm Results
Company | Total Requests | Total Errors | Peak RPS | Average RPS | Peak Response Time(ms) | Average Response Time(ms) | Total Data Transferred (GB) | Peak Throughput (MB/s) | Average Throughput (MB/s) |
Pantheon 25-50 | 268164 | 866 | 205.5 | 148.98 | 14422 | 315 | 6466 | 4.927 | 3.592 |
Pantheon 51-100 | 409962 | 57051 | 325.53 | 227.76 | 11682 | 762 | 20.74 | 17.97 | 11.52 |
Pantheon 201-500 | 629578 | 49212 | 510.78 | 349.77 | 15091 | 1353 | 33.88 | 28.9 | 18.82 |
Pantheon Enterprise | 1295178 | 9964 | 1014.58 | 719.54 | 15101 | 786 | 30.86 | 24.18 | 17.15 |
LoadStorm test logged in thousands of users to simulate heavy uncached load on the server, scaling up with more users on larger plans after the $25-50/month range. Pantheon did well at the entry level and the enterprise level. The 51-100 and 201-500 range the load exceeded the capacity of the containers hosting the sites. Pantheon showed they definitely can scale at the Enterprise level, but some of the mid-range of their lineup struggled to keep up with our tests.
Blitz Results
Company | Hits | Errors | Timeouts | Average Hits/Second | Average Response Time | Fastest Response | Slowest Response |
Pantheon 25-50 | 27755 | 0 | 0 | 463 | 61 | 60 | 67 |
Pantheon 51-100 | 55499 | 0 | 0 | 925 | 61 | 60 | 64 |
Pantheon 201-500 | 83211 | 2 | 0 | 1387 | 61 | 61 | 68 |
Pantheon Enterprise | 138607 | 4 | 27 | 2310 | 62 | 60 | 80 |
The Blitz test is designed to make sure that static assets (which should be served from cache) are being handled properly and can scale to very heavy big spikes in traffic. If the LoadStorm test was a clinic, this was absolute perfection. Pantheon had no issue with the Blitz tests at any level with near perfect results across every tier.
Uptime
Company | StatusCake | UptimeRobot |
Pantheon 25-50 | 100 | 100 |
Pantheon 51-100 | 100 | 100 |
Pantheon 201-500 | 99.98 | 99.98 |
2/3 were perfect and the third was 99.98%. Pantheon did excellent in the uptime department.
Uptime wasn't tracked on most Enterprise level plans because they are just so expensive that it felt wasteful to run them for a long period doing nothing but monitoring uptime if the company had other plans in the testing which could also be measured.
WebPageTest / WPPerformanceTester
I mention these because they are in the full testing but I won't bother putting them here. No company had any significant issue with either and it's not worth writing about. If you're very interested in seeing the geographical response times on WPT or what the raw computing power test of WPPerformanceTester measured, read the full results.
Conclusion
Pantheon earned two Top Tier WordPress Hosting Performance awards this year, for their entry level Personal plan and their Enterprise level plan. They definitely can scale for enormous sites and compete with the biggest companies in the space. The only place they struggled this year was the mid-range of their offerings during the LoadStorm test. It's by far the most stressful test and the $201-500 range was the most difficult price/performance point of any of the price brackets. Pantheon has a very unique platform compared to the rest of the field that's exceptionally developer-centric and focused around building a toolkit for teams of developers to work on a site in an opinionated workflow. If you like that workflow, you get an amazing toolkit combined with scalable performance.
LiquidWeb WordPress Hosting Review (2016)
LiquidWeb was a first time participant in WordPress Hosting Performance Benchmarks. They have been around for a long time in the managed web hosting space but only recently entered the WordPress space. They have consistently been one of the top companies tracked at Review Signal winning numerous awards for their shared and VPS hosting.
Those are some pretty big expectations to meet when you enter a space that is already full of many competitors and being the new kid on the block. The only other first time participant that did as well was WordPress.com VIP, which isn't a new entrant into the space, but only this testing.
Products
Company / Price Bracket | Plan | Monthly Price | Visitors Allowed | Disk Space | Bandwidth | Sites Allowed |
LiquidWeb 51-100 | Personal | $89 | Unlimited | 100GB SSD | 5 TB | 10 |
LiquidWeb 101-200 | Professional | $149 | Unlimited | 150GB SSD | 5 TB | 20 |
Performance Review
LoadStorm Results
Company / Price Bracket | Total Requests | Total Errors | Peak RPS | Average RPS | Peak Response Time(ms) | Average Response Time(ms) | Total Data Transferred (GB) | Peak Throughput (MB/s) | Average Throughput (MB/s) |
LiquidWeb 51-100 | 520072 | 2745 | 408.3 | 288.93 | 15322 | 525 | 24.04 | 19.69 | 13.35 |
LiquidWeb 101-200 | 635893 | 76 | 490.78 | 353.27 | 15097 | 360 | 31.3 | 25.19 | 17.39 |
LoadStorm test logged in thousands of users to simulate heavy uncached load on the server, scaling up with more users on larger plans after the $25-50/month range. LiquidWeb handled these tests with relative ease. The larger plan did better managing a faster average response time and having fewer errors. But both results were top tier performances.
Blitz Results
Company / Price Bracket | Hits | Errors | Timeouts | Average Hits/Second | Average Response Time | Fastest Response | Slowest Response |
LiquidWeb 51-100 | 54574 | 0 | 4 | 910 | 78 | 77 | 82 |
LiquidWeb 101-200 | 81393 | 47 | 10 | 1357 | 80 | 76 | 118 |
The Blitz test is designed to make sure that static assets (which should be served from cache) are being handled properly and can scale to very heavy big spikes in traffic. If the LoadStorm test was a clinic, this was absolute perfection. LiquidWeb had minimal issues with the Blitz test. A very minor spike up to 118ms on the bigger test is the only noticeable thing. Again, top tier performances.
Uptime
Company | StatusCake | UptimeRobot |
LiquidWeb 51-100 | 100 | 100 |
LiquidWeb 101-200 | 100 | 100 |
Perfect.
WebPageTest / WPPerformanceTester
I mention these because they are in the full testing but I won't bother putting them here. No company had any significant issue with either and it's not worth writing about. If you're very interested in seeing the geographical response times on WPT or what the raw computing power test of WPPerformanceTester measured, read the full results.
Conclusion
LiquidWeb earned Top Tier WordPress Hosting Performance for both plans it entered. It's product line starts in the mid-range price wise and goes up. They definitely have the performance to match the pricing. Absolutely perfect uptime was nice to see too. I'm pleased to see they bring their strong reputation to this market with a strong product that matches the quality people have come to expect from LiquidWeb.
Pressable WordPress Hosting Review (2016)
Pressable participated for the second time in WordPress Hosting Performance Benchmarks. Their last participation was in the original which was performed in 2013. They've undergone major changes since then and are now owned by Automattic. This year they had the most plans entered of any company at five into the following ranges: $25-50/month, $51-100/month, $101-200/m, $201-500/month and Enterprise ($500+/month).
Products
Company / Price Bracket | Plan | Monthly Price | Visitors Allowed | Disk Space | Bandwidth | Sites Allowed |
Pressable 25-50 | 5 Sites | $25 | 60,000 | Unlimited | Unlimited | 5 |
Pressable 51-100 | 20 Sites | $90 | 400,000 | Unlimited | Unlimited | 20 |
Pressable 101-200 | Agency 1 | $135 | 600,000 | Unlimited | Unlimited | 30 |
Pressable 201-500 | Agency 3 | $225 | 1 Million | Unlimited | Unlimited | 50 |
Pressable Enterprise | VIP 1 | $750 | 5 Million | Unlimited | Unlimited | 100 |
They made it clear to me that the products are identical until the VIP level, each site has equal resources, the only difference in plans is that more sites are allowed.
Performance Review
LoadStorm Results
Company / Price Bracket | Total Requests | Total Errors | Peak RPS | Average RPS | Peak Response Time(ms) | Average Response Time(ms) | Total Data Transferred (GB) | Peak Throughput (MB/s) | Average Throughput (MB/s) |
Pressable 25-50 | 394405 | 26 | 294.6 | 219.11 | 15101 | 226 | 16.4 | 13.32 | 9.111 |
Pressable 51-100 | 569095 | 0 | 441.43 | 316.16 | 3152 | 239 | 24.35 | 20.19 | 13.53 |
Pressable 101-200 | 724499 | 1090 | 562.12 | 402.5 | 15024 | 447 | 30.91 | 26.07 | 17.17 |
Pressable 201-500 | 896616 | 12256 | 740.88 | 498.12 | 6362 | 450 | 37.87 | 33.8 | 21.04 |
Pressable Enterprise | 1538237 | 7255 | 1162.63 | 854.58 | 15099 | 733 | 29.18 | 21.95 | 16.21 |
LoadStorm test logged in thousands of users to simulate heavy uncached load on the server, scaling up with more users on larger plans after the $25-50/month range. Pressable overall did very well. Earning top tier status in four our of five. The 201-500 price bracket had a bit of difficulty with the increased load which disappears at the Enterprise level.
Blitz Results
Company / Price Bracket | Hits | Errors | Timeouts | Average Hits/Second | Average Response Time | Fastest Response | Slowest Response |
Pressable 25-50 | 25914 | 0 | 2 | 432 | 134 | 134 | 136 |
Pressable 51-100 | 51781 | 0 | 0 | 863 | 135 | 134 | 136 |
Pressable 101-200 | 77652 | 0 | 4 | 1294 | 134 | 141 | 133 |
Pressable 201-500 | 77850 | 11 | 1 | 1298 | 132 | 131 | 135 |
Pressable Enterprise | 129866 | 13 | 2 | 2164 | 132 | 131 | 139 |
The Blitz test is designed to make sure that static assets (which should be served from cache) are being handled properly and can scale to very heavy big spikes in traffic. If the LoadStorm test was a clinic, this was absolute perfection. Pressable had zero issues with the Blitz tests across every plan. Their caching is certainly up to snuff.
Uptime
Company | StatusCake | UptimeRobot |
Pressable 25-50 | 99.91 | 99.92 |
Pressable 51-100 | 99.93 | 99.95 |
Pressable 101-200 | 99.96 | 99.94 |
Pressable 201-500 | 99.88 | 99.9 |
Oddly enough, Uptime was one of the biggest struggles for Pressable. The 201-500 plan didn't earn top tier status because it fell below the 99.9% threshold averaging 99.89 between the two monitors. The rest were closer to the 99.9% mark than the 100% mark which, while above the expected threshold, I'd like to see a bit of improvement in.
Uptime wasn't tracked on most Enterprise level plans because they are just so expensive that it felt wasteful to run them for a long period doing nothing but monitoring uptime if the company had other plans in the testing which could also be measured.
WebPageTest / WPPerformanceTester
I mention these because they are in the full testing but I won't bother putting them here. No company had any significant issue with either and it's not worth writing about. If you're very interested in seeing the geographical response times on WPT or what the raw computing power test of WPPerformanceTester measured, read the full results.
Conclusion
Pressable managed to earn four Top Tier WordPress Hosting Performances out of five plans. Overall, the performance is excellent and they can scale from $25/month to Enterprise size workloads. I'd like to see some minor improvements in uptime, but apart from that small issue, they don't have much else to improve on. It's great to see a strong competitor at virtually every price level in the space.
Pressidium WordPress Hosting Review (2016)
Pressidium participated for the second year in a row in WordPress Hosting Performance Benchmarks. They had four plans entered into the following ranges: $51-100/month, $101-200/month, $201-500/month and Enterprise ($500+/month).
Last year, Pressidium earned top tier status, this year they managed a repeat on every plan.
Products
Company / Price Bracket | Plan | Monthly Price | Visitors Allowed | Disk Space | Bandwidth | Sites Allowed |
Pressidium 51-100 | Professional | 100,000 | 20 GB | Unlimited | 10 | |
Pressidium 101-200 | Business | $299 |
500,000 | 30 GB | Unlimited | 25 |
Pressidium 201-500 | Premium | $599.90 |
1 Million | 40 GB | Unlimited | 50 |
Pressidium Enterprise | Enterprise-1 | $1,300 | 1.5 Million | 60 GB | Unlimited | Unlimited |
Prices have increased since the original tests, the original prices are crossed out, with the new pricing listed.
Performance Review
LoadStorm Results
Company / Price Bracket | Total Requests | Total Errors | Peak RPS | Average RPS | Peak Response Time(ms) | Average Response Time(ms) | Total Data Transferred (GB) | Peak Throughput (MB/s) | Average Throughput (MB/s) |
Pressidium 51-100 | 429538 | 0 | 335.78 | 238.63 | 3030 | 306 | 16.11 | 13.26 | 8.951 |
Pressidium 101-200 | 563624 | 0 | 435.43 | 313.12 | 3561 | 272 | 30.82 | 24.44 | 17.12 |
Pressidium 201-500 | 697020 | 0 | 547.88 | 387.23 | 4894 | 266 | 38.16 | 31.05 | 21.2 |
Pressidium Enterprise | 1349118 | 3792 | 1076.52 | 749.51 | 11798 | 324 | 73.63 | 60.18 | 40.91 |
LoadStorm test logged in thousands of users to simulate heavy uncached load on the server, scaling up with more users on larger plans after the $25-50/month range. Pressidium was perfect on the first three tests and did excellent at the Enterprise level. Zero errors on the first three tests and only a handful on the Enterprise test which nobody achieved a zero on.
Blitz Results
Company | Hits | Errors | Timeouts | Average Hits/Second | Average Response Time | Fastest Response | Slowest Response |
Pressidium 51-100 | 57348 | 1 | 0 | 956 | 27 | 25 | 30 |
Pressidium 101-200 | 85916 | 6 | 0 | 1432 | 27 | 25 | 31 |
Pressidium 201-500 | 85439 | 11 | 14 | 1424 | 31 | 25 | 82 |
Pressidium Enterprise | 143452 | 0 | 2 | 2391 | 26 | 24 | 35 |
The Blitz test is designed to make sure that static assets (which should be served from cache) are being handled properly and can scale to very heavy big spikes in traffic. If the LoadStorm test was a clinic, this was absolute perfection. Pressidium had near perfect tests at every level: almost no errors/timeouts and stable response time. The only exception was the 201-500 range, it had a minor spike at the end which increased the response time to a measley 82ms.
Uptime
Company | StatusCake | UptimeRobot |
Pressidium 51-100 | 100 | 99.99 |
Pressidium 101-200 | 99.97 | 99.99 |
Pressidium 201-500 | 99.95 | 99.99 |
Uptime wasn't tracked on most Enterprise level plans because they are just so expensive that it felt wasteful to run them for a long period doing nothing but monitoring uptime if the company had other plans in the testing which could also be measured.
Pressidium did well in the uptime monitoring, keeping above 99.95% on all monitors.
WebPageTest / WPPerformanceTester
I mention these because they are in the full testing but I won't bother putting them here. No company had any significant issue with either and it's not worth writing about. If you're very interested in seeing the geographical response times on WPT or what the raw computing power test of WPPerformanceTester measured, read the full results.
Conclusion
Pressidium managed to earn four Top Tier WordPress Hosting Performances, an impressive feat. Another year, another excellent performance like what I am beginning to expect from these guys.