LightningBase participated for the fourth time in a row in our WordPress Hosting Performance Benchmarks (2018). This review is based off the results of that test. This year LightningBase entered in the <$25/month and $25-50/month price brackets.
LightningBase has consistently earned Top Tier status in every year they've participated. This year was no exception.
The Products
| Plan Name | Plan Monthly Price | Plan Visitors Allowed | Plan Memory/RAM | Plan Disk Space | Plan Bandwidth |
Plan Sites Allowed
|
| Personal | $9.95 | 10,000 (Guideline*) | 3 GB | 1 GB | 10 GB | 1 |
| Medium | $49.95 | 100,000 (Guideline*) | 6 GB | 15 GB | 100 GB | 10 |
- Guideline based on the resources provided, although if most are cached and the site is efficient this may be exceeded dramatically, as we don't artificially limit pageviews.
Performance Review
Load Storm
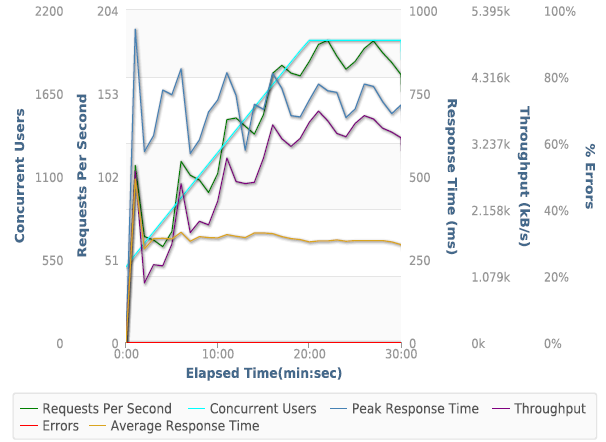
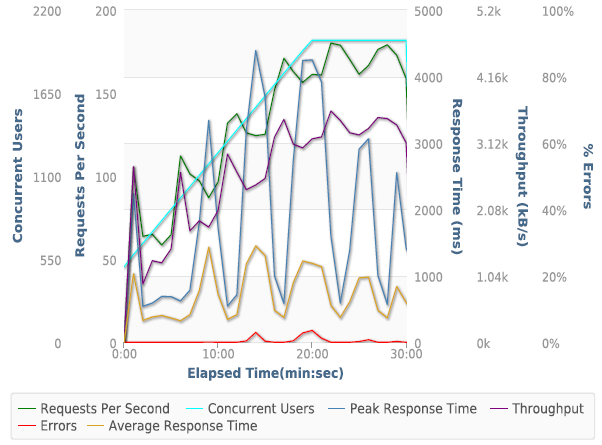
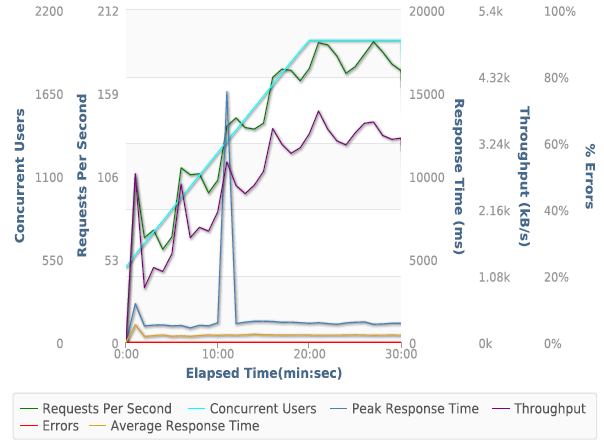
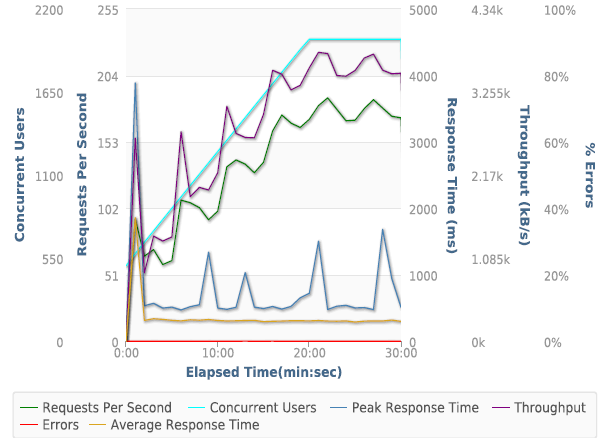
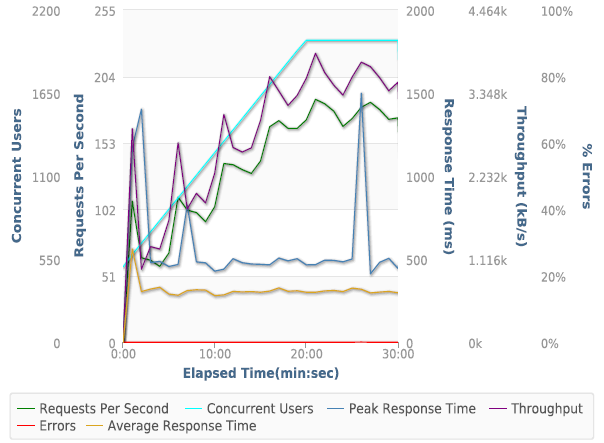
| Plan | Total Requests | Total Errors | Peak RPS | Average RPS | Peak Response Time(ms) | Average Response Time (ms) | Total Data Transferred (GB) | Peak Throughput (MB/s) | Average Throughput (MB/s) |
| <$25 | 449,766 | 93 | 365.18 | 249.87 | 15,096 | 419 | 25.38 | 21.35 | 14.1 |
| $25-50 | 455,551 | 16 | 360.55 | 253.08 | 15,099 | 401 | 25.72 | 21.06 | 14.29 |
Sources: https://pro.loadstorm.com/#!test/562070, https://pro.loadstorm.com/#!test/562159
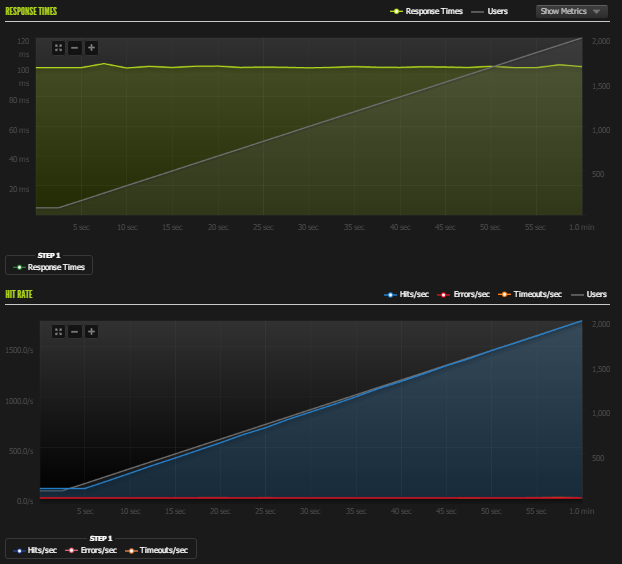
The Load Storm test is designed to simulate real users coming to the site, logging in and browsing the site bursting some of the caching mechanisms typically found on managed WordPress hosts.
In both tests there were minimal errors and the average response time was stable at just over 400ms. The tests at these price tiers are identical, so it's logical that the more expensive plan slightly outperformed the cheaper one.
Load Impact
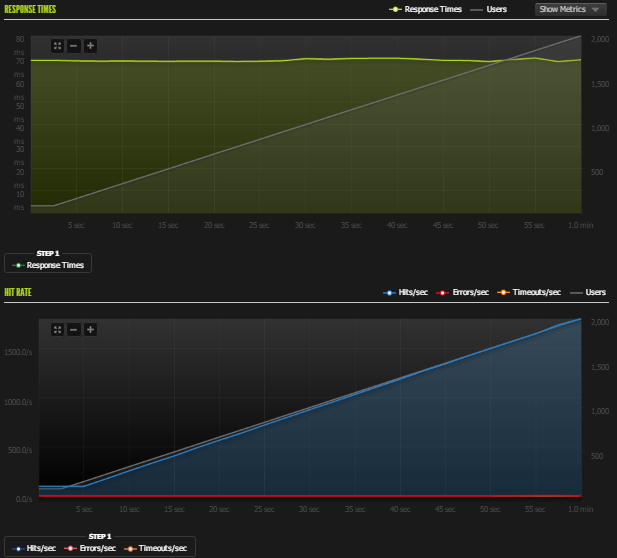
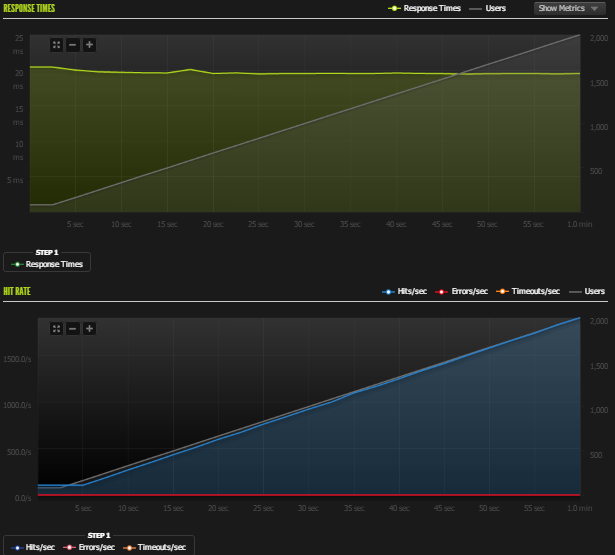
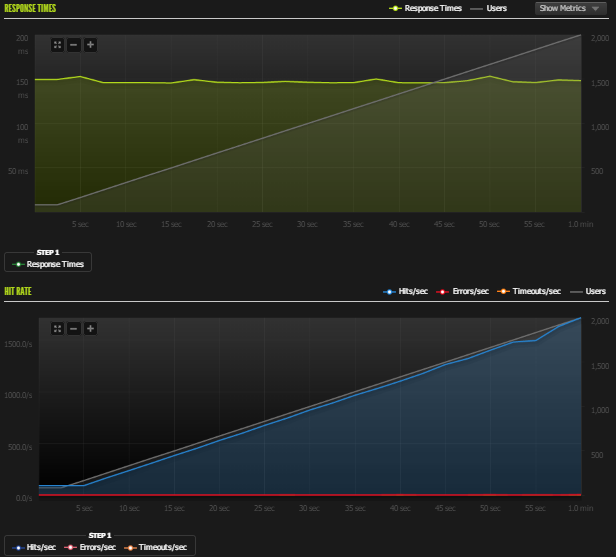
| Requests | Errors | Data Transferred (GB) | Peak Average Load Time (Seconds) | Peak Average Bandwidth (Mbps) |
Peak Average Requests/Sec
|
|
| <$25 | 339672 | 0 | 18.26 | 0.412 | 300.6 | 682 |
| $25-50 | 338834 | 0 | 18.19 | 0.398 | 302 | 688 |
The Load Impact test makes sure static caching is effective so that if a page gets a lot of traffic the site will keep responding without issue.
LightningBase had perfect results on the Load Impact test, zero errors and no noticeable impact on response times.
Uptime
Uptime Robot and StatusCake both showed 100% uptime across the board for LightningBase.
WebPageTest / WPPerformanceTester
| PHP Bench | WP Bench |
| 8.678 | 1388.888889 |
| 8.726 | 1288.659794 |
The WPPerformanceTester results were quite fast. The WP bench scores were very fast (the second fastest in both price tiers).
| <25 Load Time | 25-50 Load Time | |
| Dulles | 0.429 | 0.429 |
| Denver | 1.212 | 1.118 |
| LA | 0.843 | 0.797 |
| London | 1.169 | 1.173 |
| Frankfurt | 1.091 | 1.186 |
| Rose Hill, Mauritius | 2.435 | 2.436 |
| Singapore | 1.863 | 1.728 |
| Mumbai | 2.33 | 2.098 |
| Japan | 1.292 | 1.304 |
| Sydney | 1.762 | 1.771 |
| Brazil | 1.511 | 1.479 |
Nothing much to say about the WebPageTest results. They were decidedly normal which is what most people need unless you're targeting a specific geographic region.
Conclusion
LightningBase. Another year, another set of near perfect runs. 100% uptime. Great load tests. This is the 4th year in a row LightningBase has earned top tier recognition. It seems almost expected at this point. I'm still puzzled how they are still flying so far under the radar.
![]()


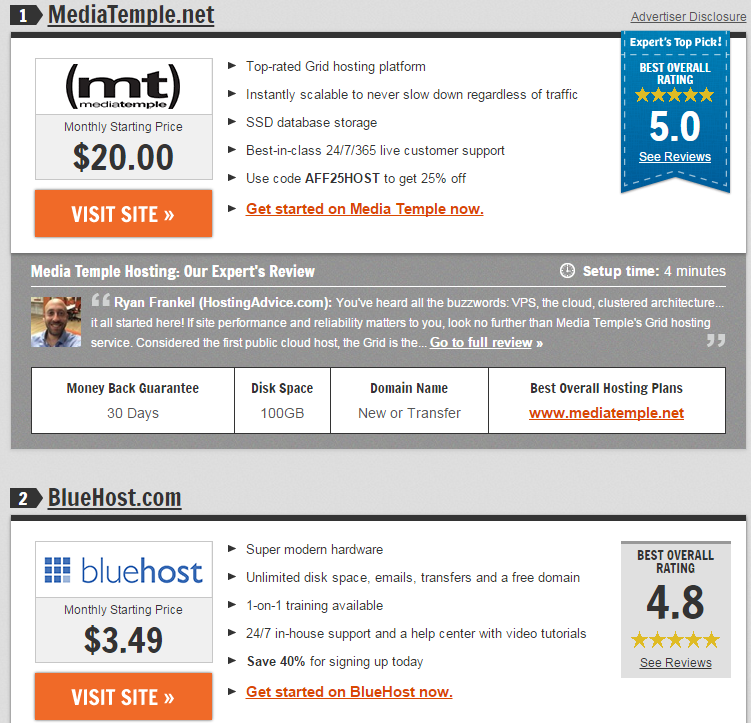
 Yes, those are the two highest rated positive comments about
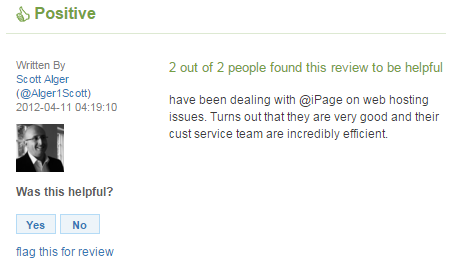


 WordPress & WooCommerce Hosting Performance Benchmarks 2021
 WooCommerce Hosting Performance Benchmarks 2020
 WordPress Hosting Performance Benchmarks (2020)
 The Case for Regulatory Capture at ICANN
 WordPress Hosting – Does Price Give Better Performance?
 Hostinger Review – 0 Stars for Lack of Ethics
 The Sinking of Site5 – Tracking EIG Brands Post Acquisition
 Dirty, Slimy, Shady Secrets of the Web Hosting Review (Under)World – Episode 1
 Free Web Hosting Offers for Startups