
Sponsored by LoadStorm. The easy and cost effective load testing tool for web and mobile applications.
This is the third round of managed WordPress web hosting performance testing. You can see the original here, and the November 2014 version here.
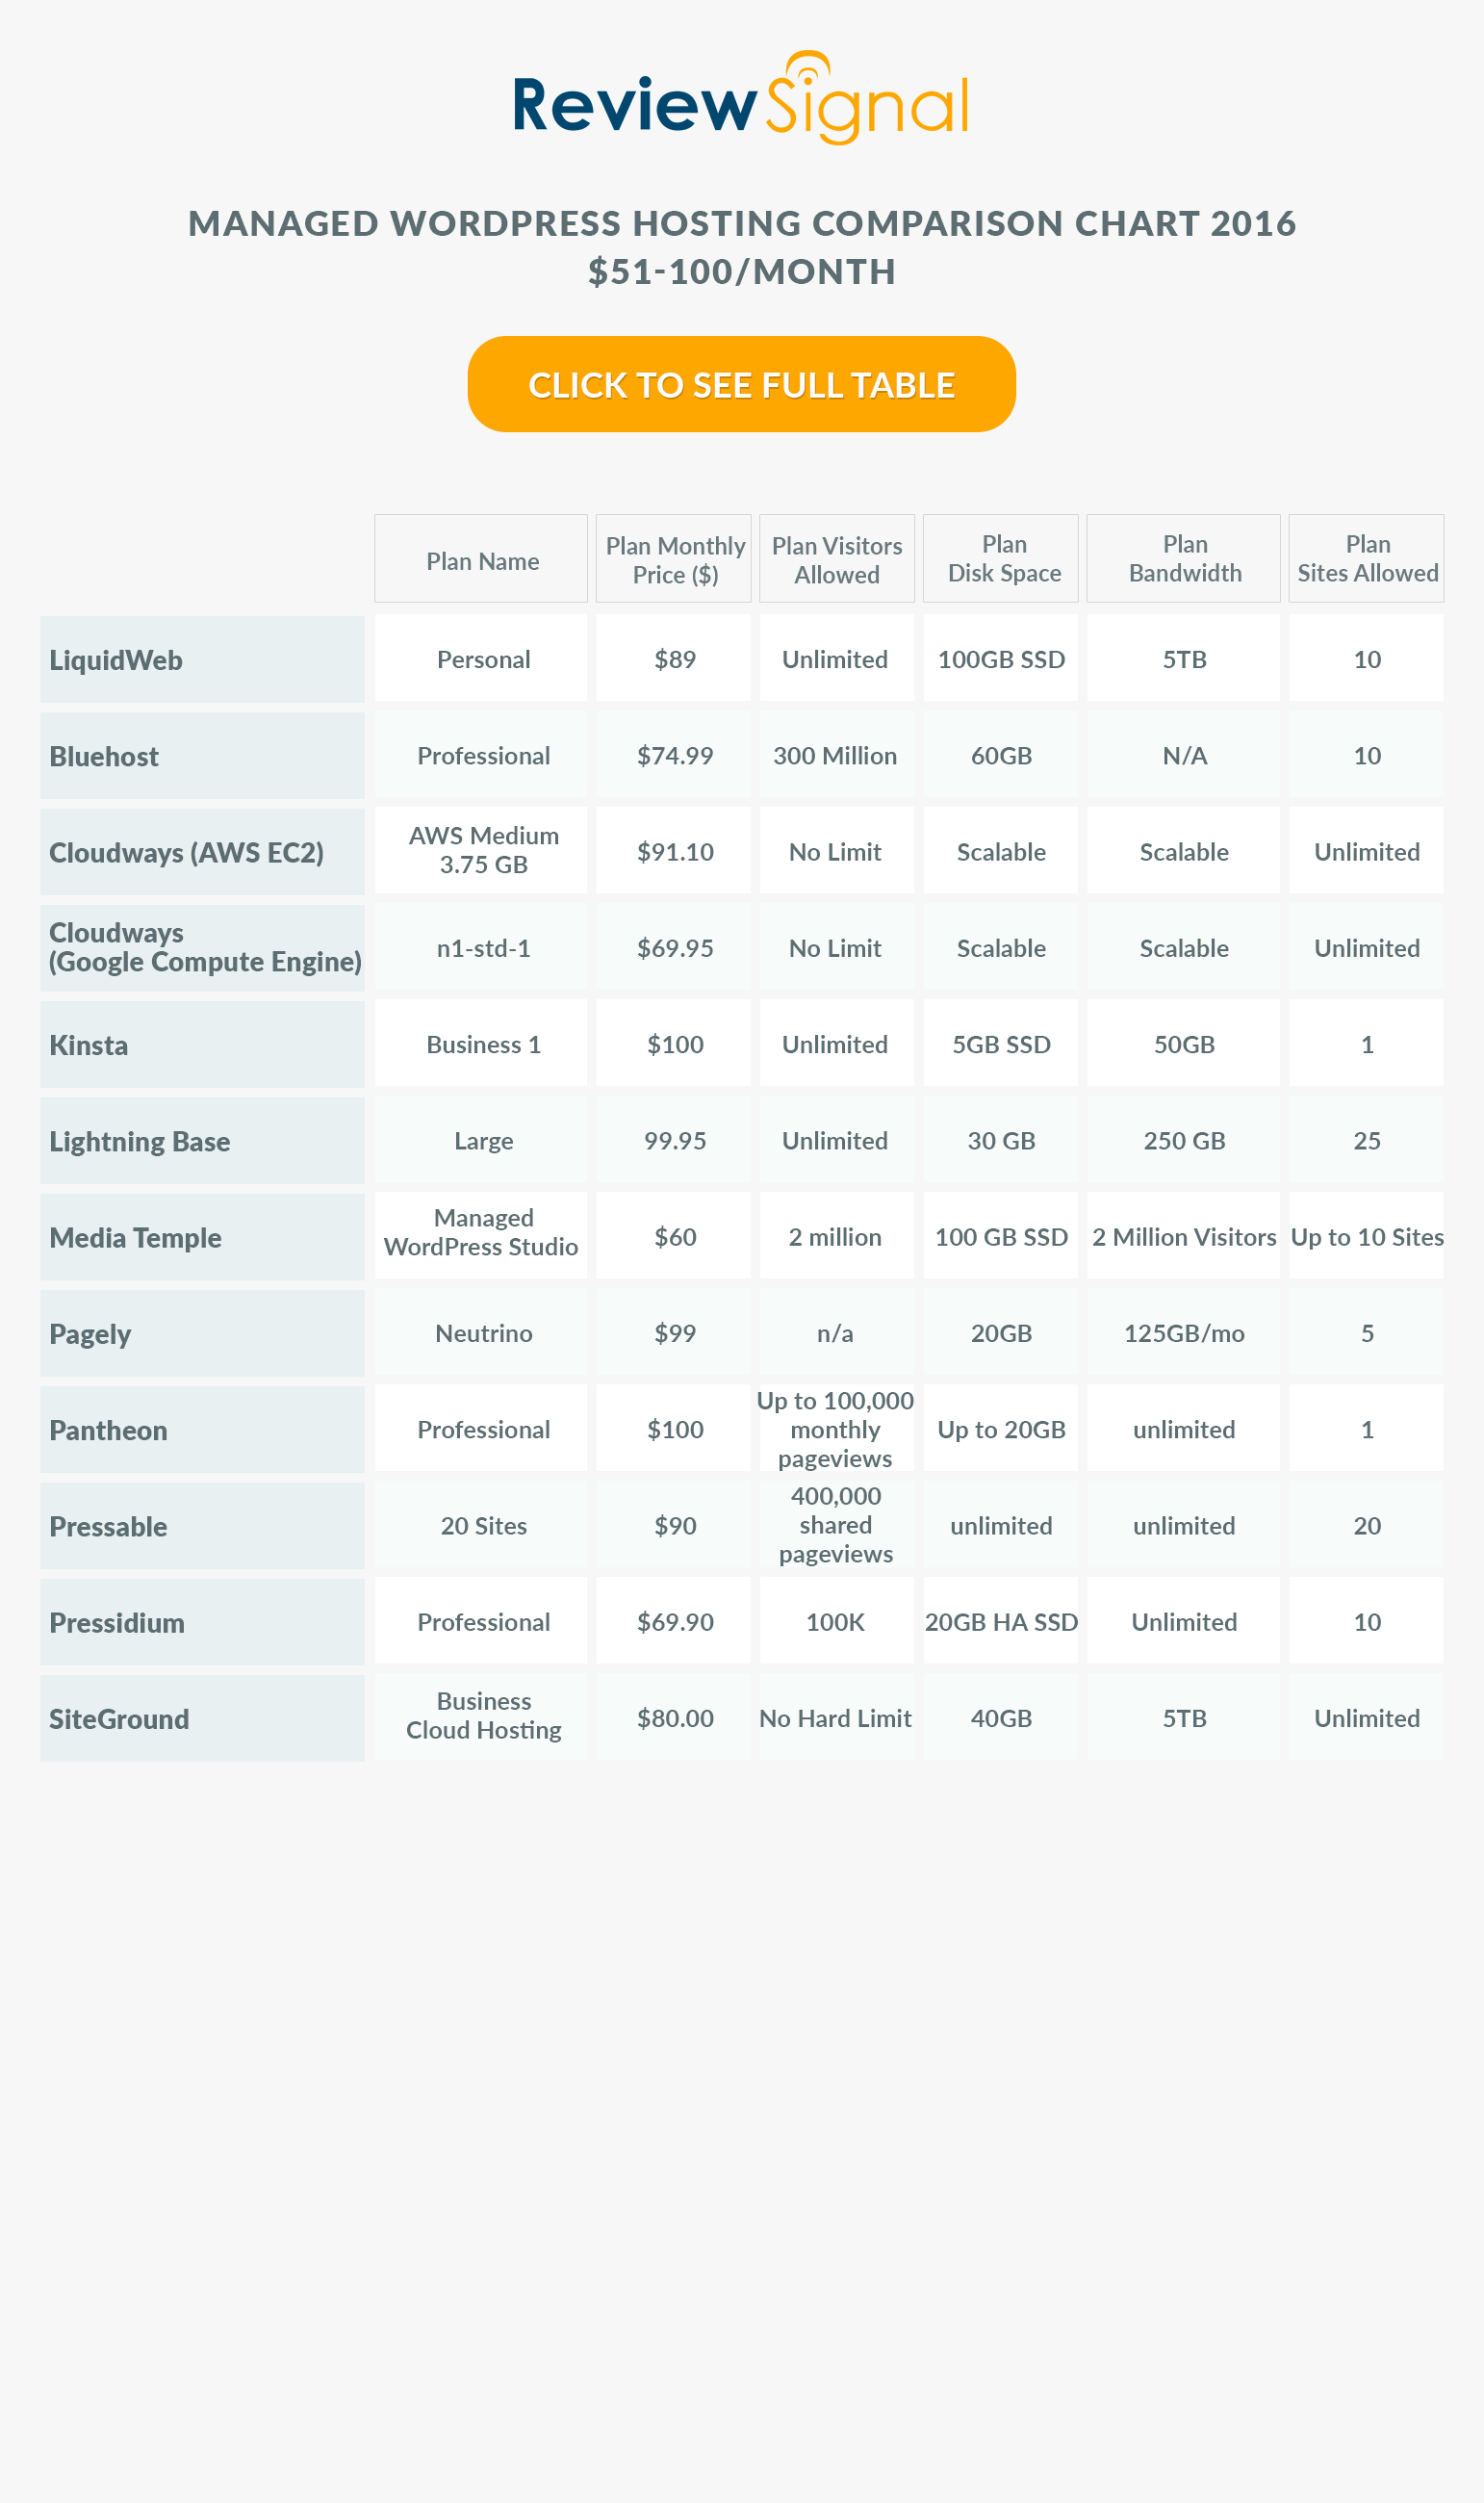
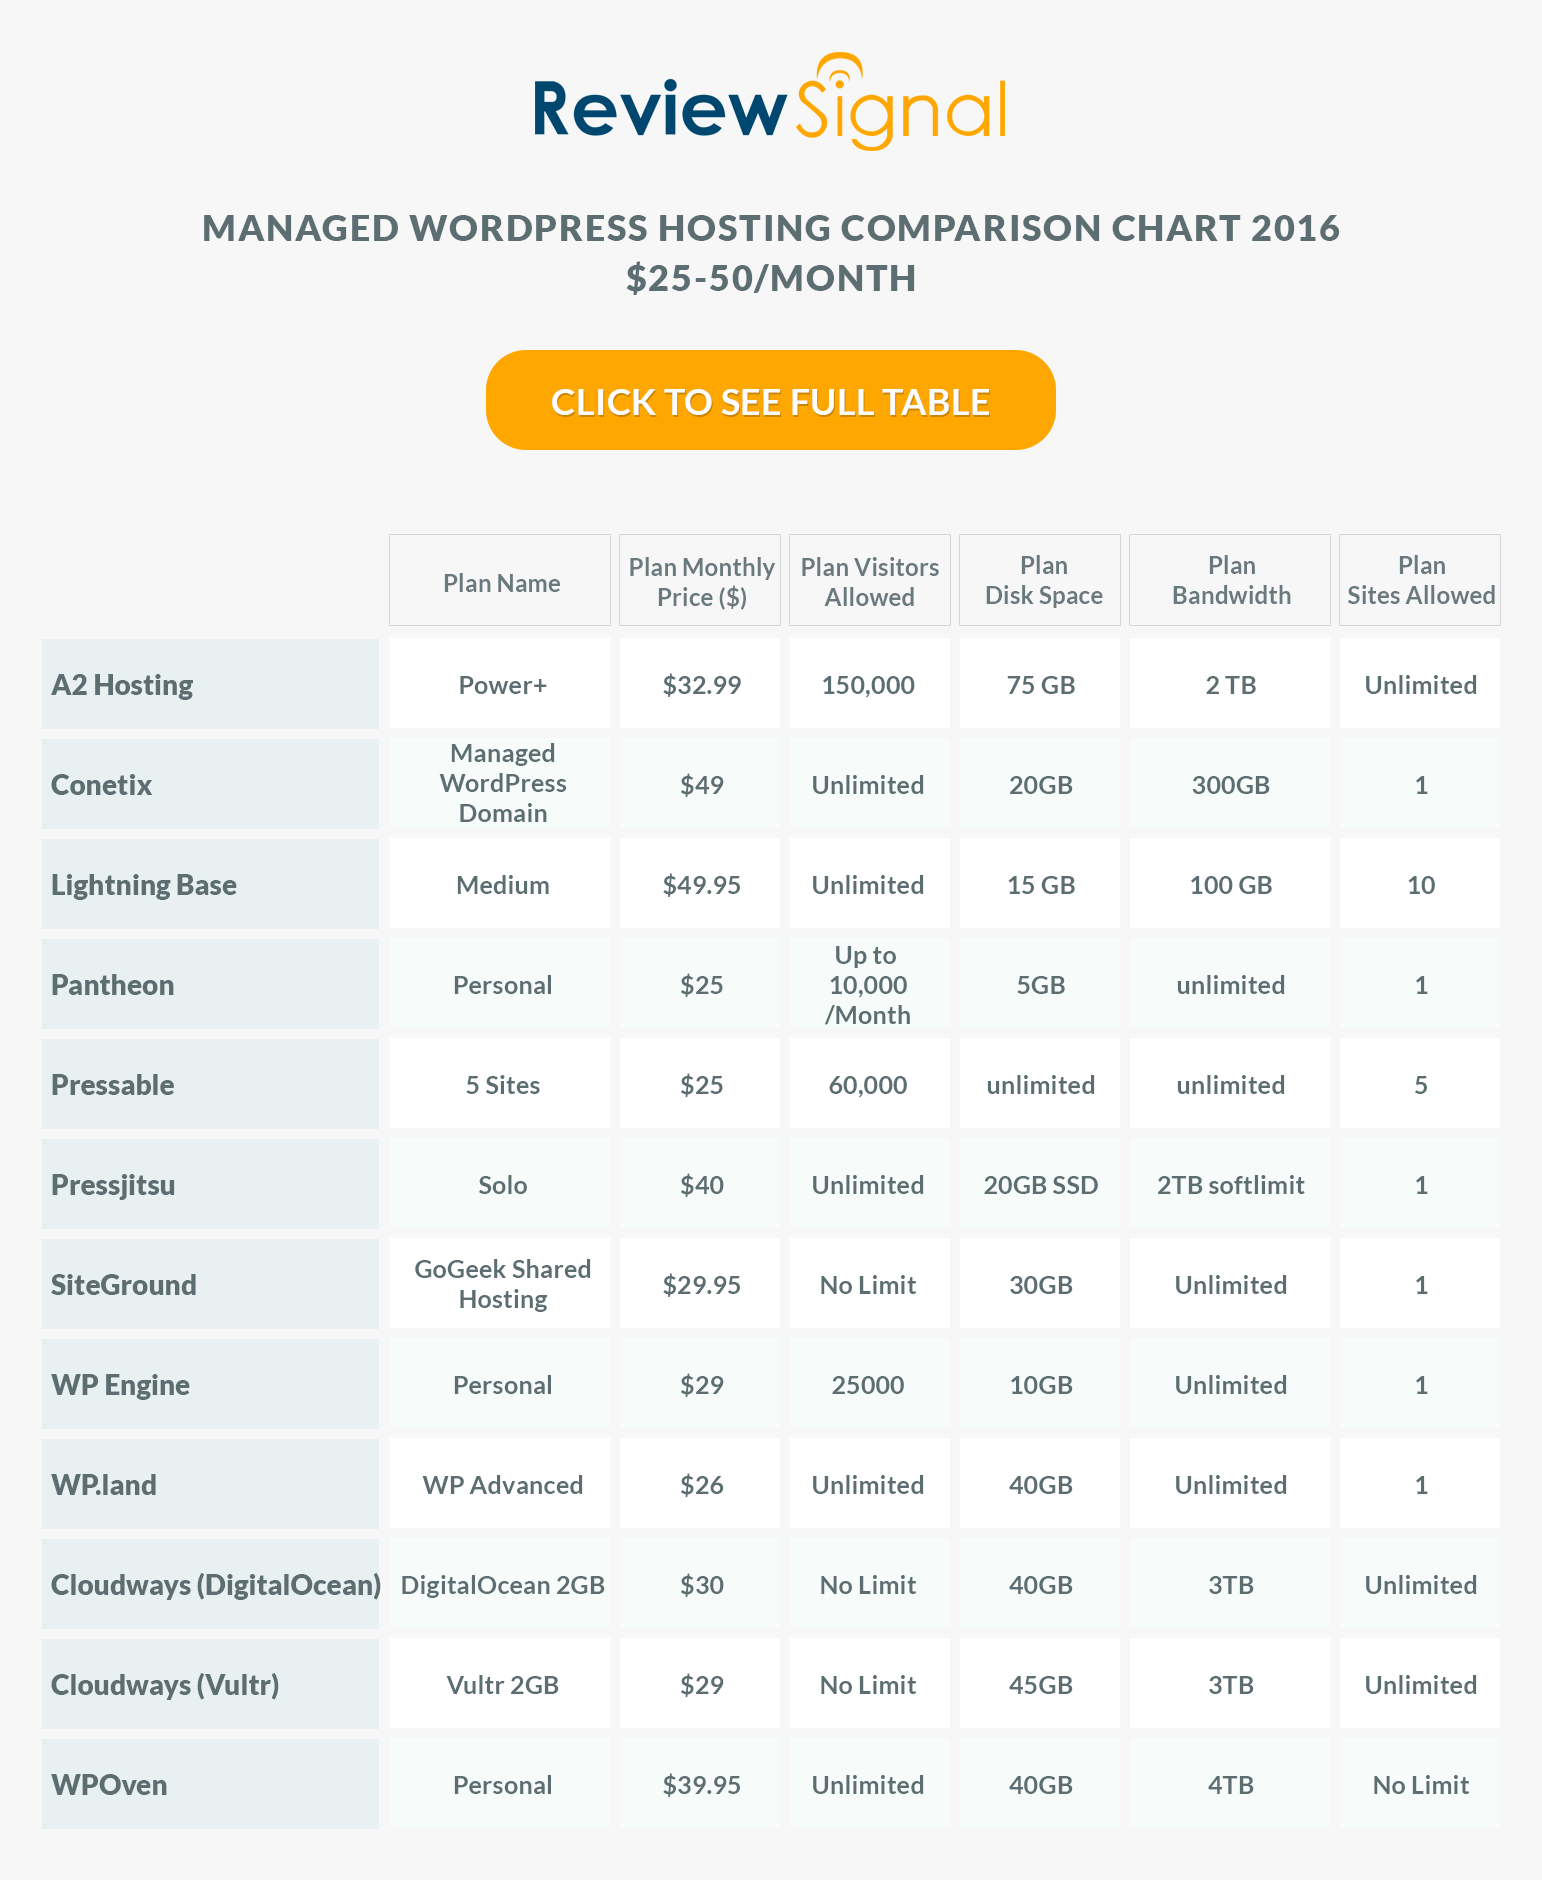
New (9/14/2016) The 2016 WordPress Hosting Performance Benchmarks are live.
New (8/20/2015) This post is also available as an Infographic.
Companies Tested
A Small Orange [Reviews]
BlueHost [Reviews]
CloudWays [Reviews]
DreamHost [Reviews]
FlyWheel [Reviews]
GoDaddy [Reviews]
Kinsta
LightningBase
MediaTemple [Reviews]
Nexcess
Pagely [Reviews]
Pantheon [Reviews]
Pressidium
PressLabs
SiteGround† [Reviews]
WebHostingBuzz
WPEngine* [Reviews]
WPOven.com
WPPronto
Note: Pressable and WebSynthesis [Reviews] were not interested in being tested this round and were excluded. WordPress.com dropped out due to technical difficulties in testing their platform (a large multi-site install).
Every company donated an account to test on. All were the WordPress specific plans (e.g. GoDaddy's WordPress option). I checked to make sure I was on what appeared to be a normal server. The exception is WPEngine*. They wrote that I was "moved over to isolated hardware (so your tests don’t cause any issues for other customers) that is in-line with what other $29/month folks use." From my understanding, all testing was done on a shared plan environment with no actual users on the server to share. So this is almost certainly the best case scenario performance wise, so I suspect the results look better than what most users would actually get.
†Tests were performed with SiteGround's proprietary SuperCacher module turned on fully with memcached.
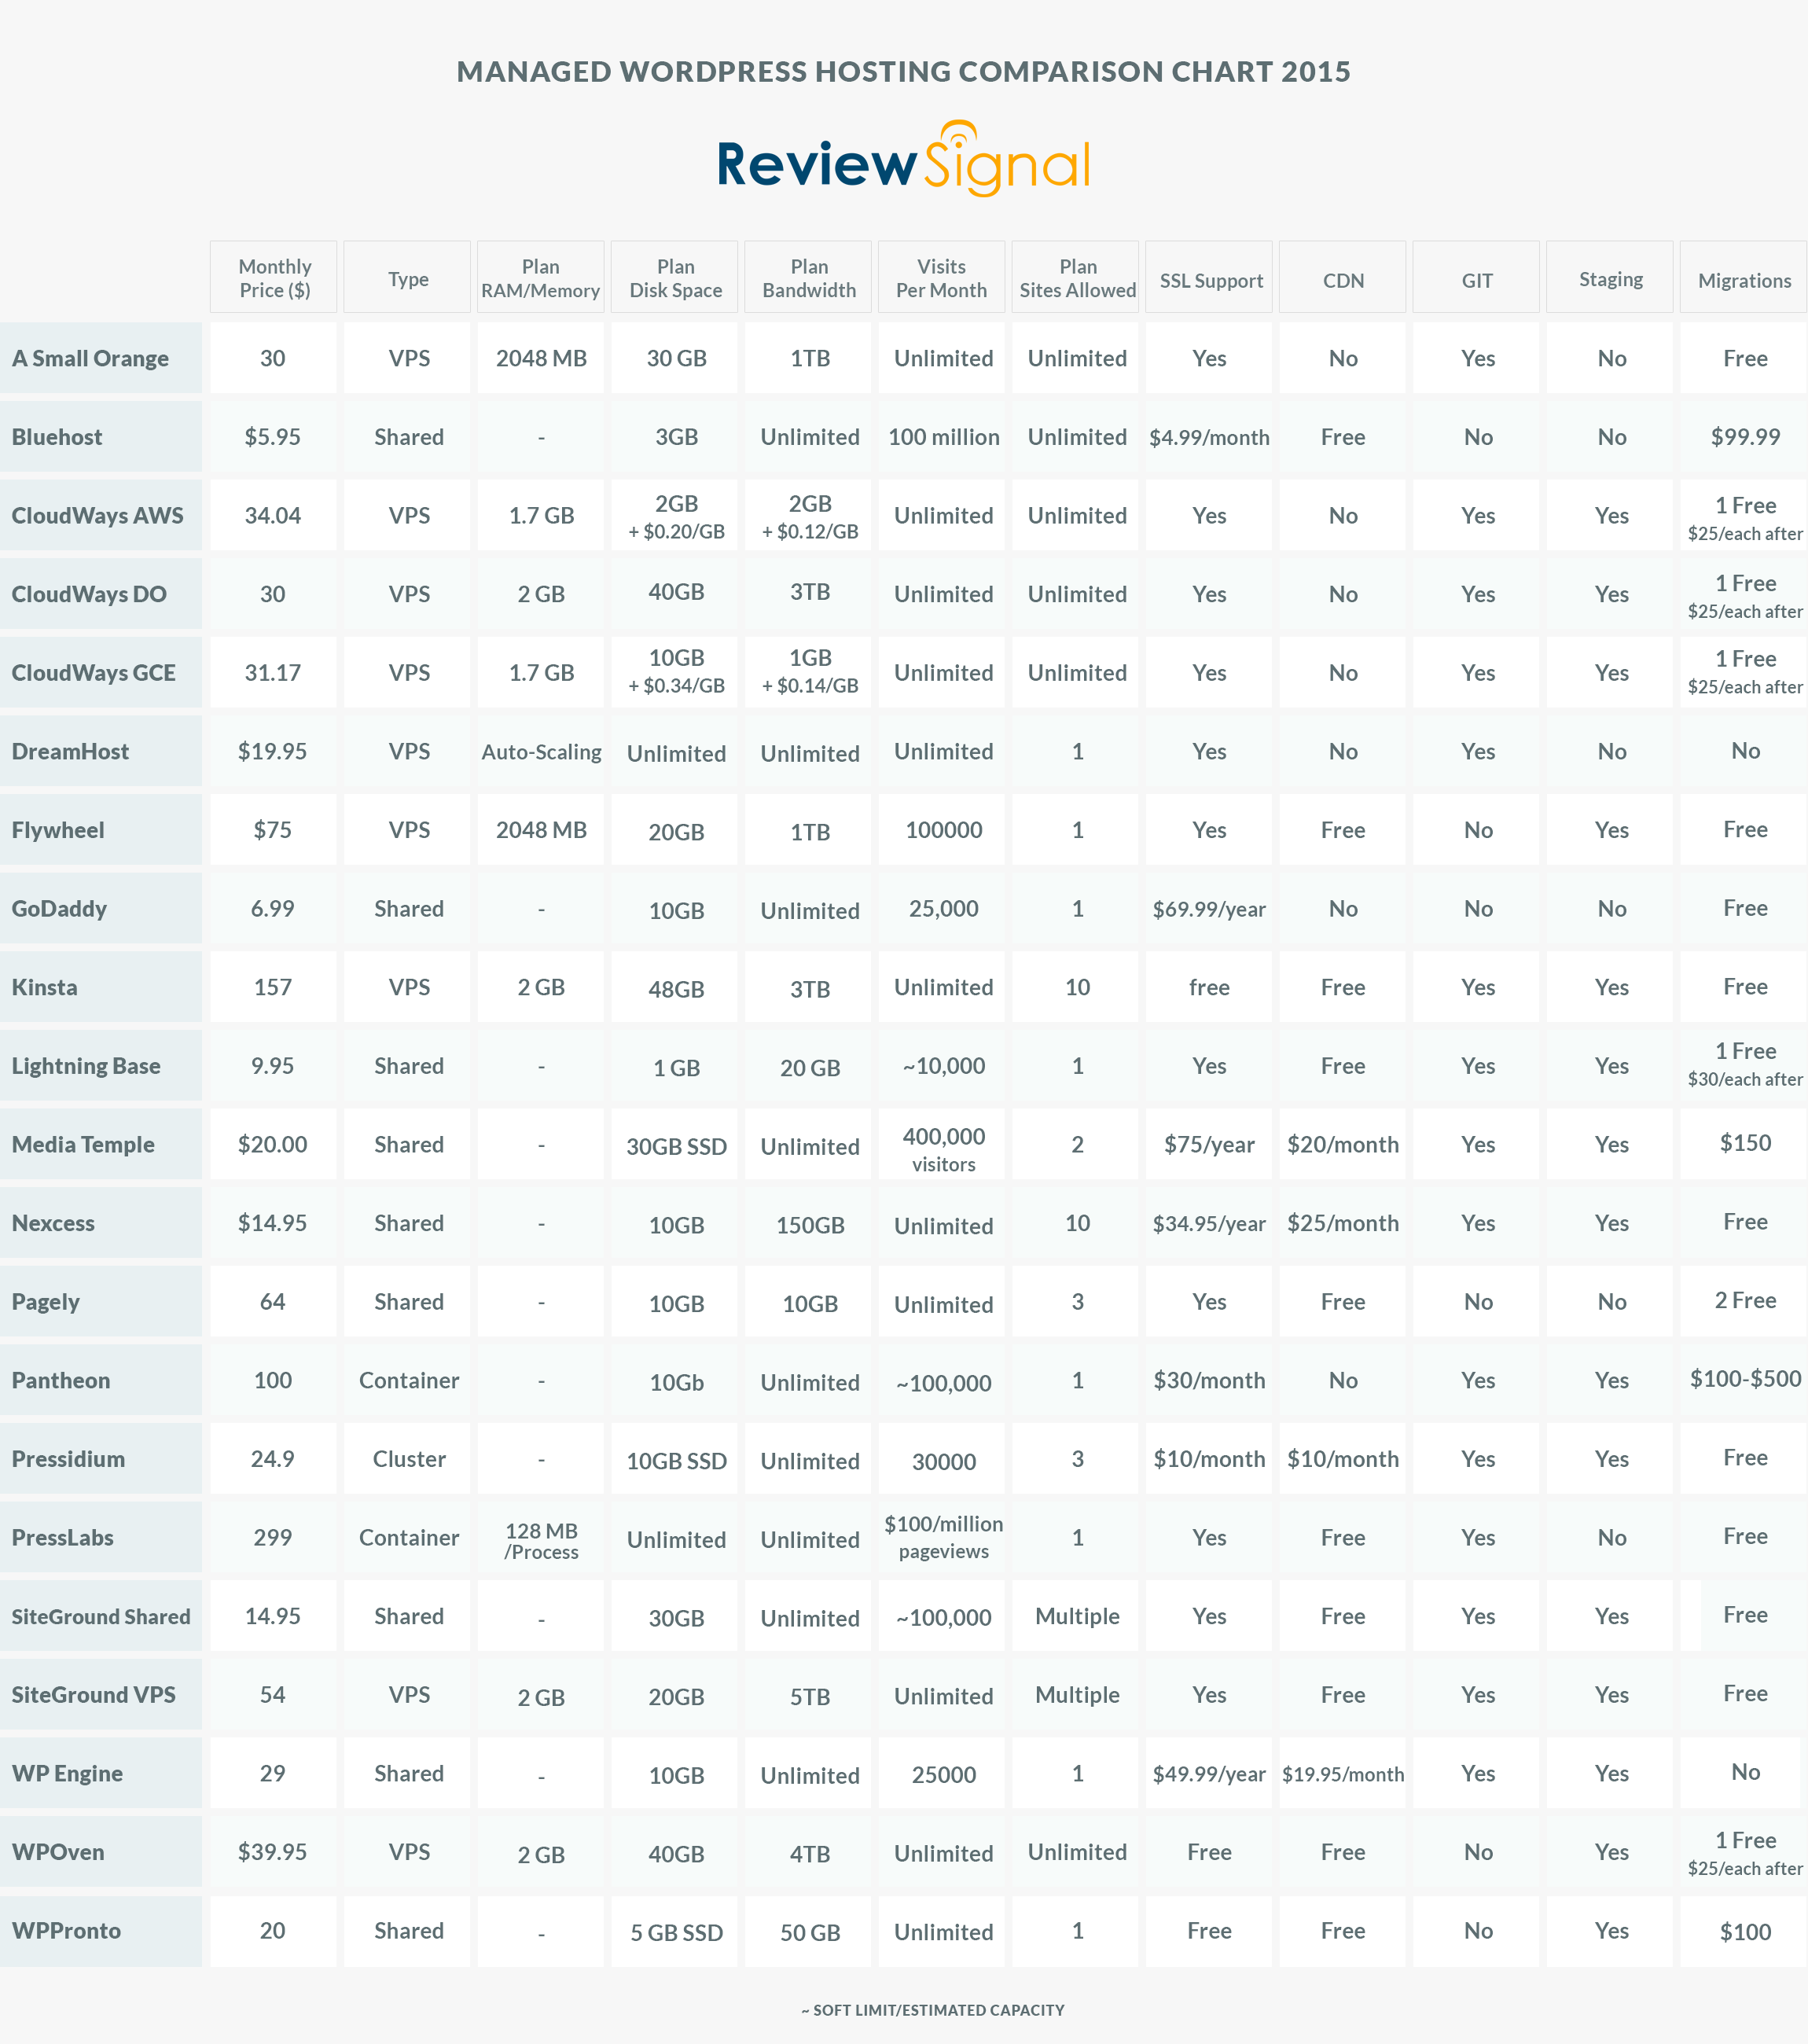
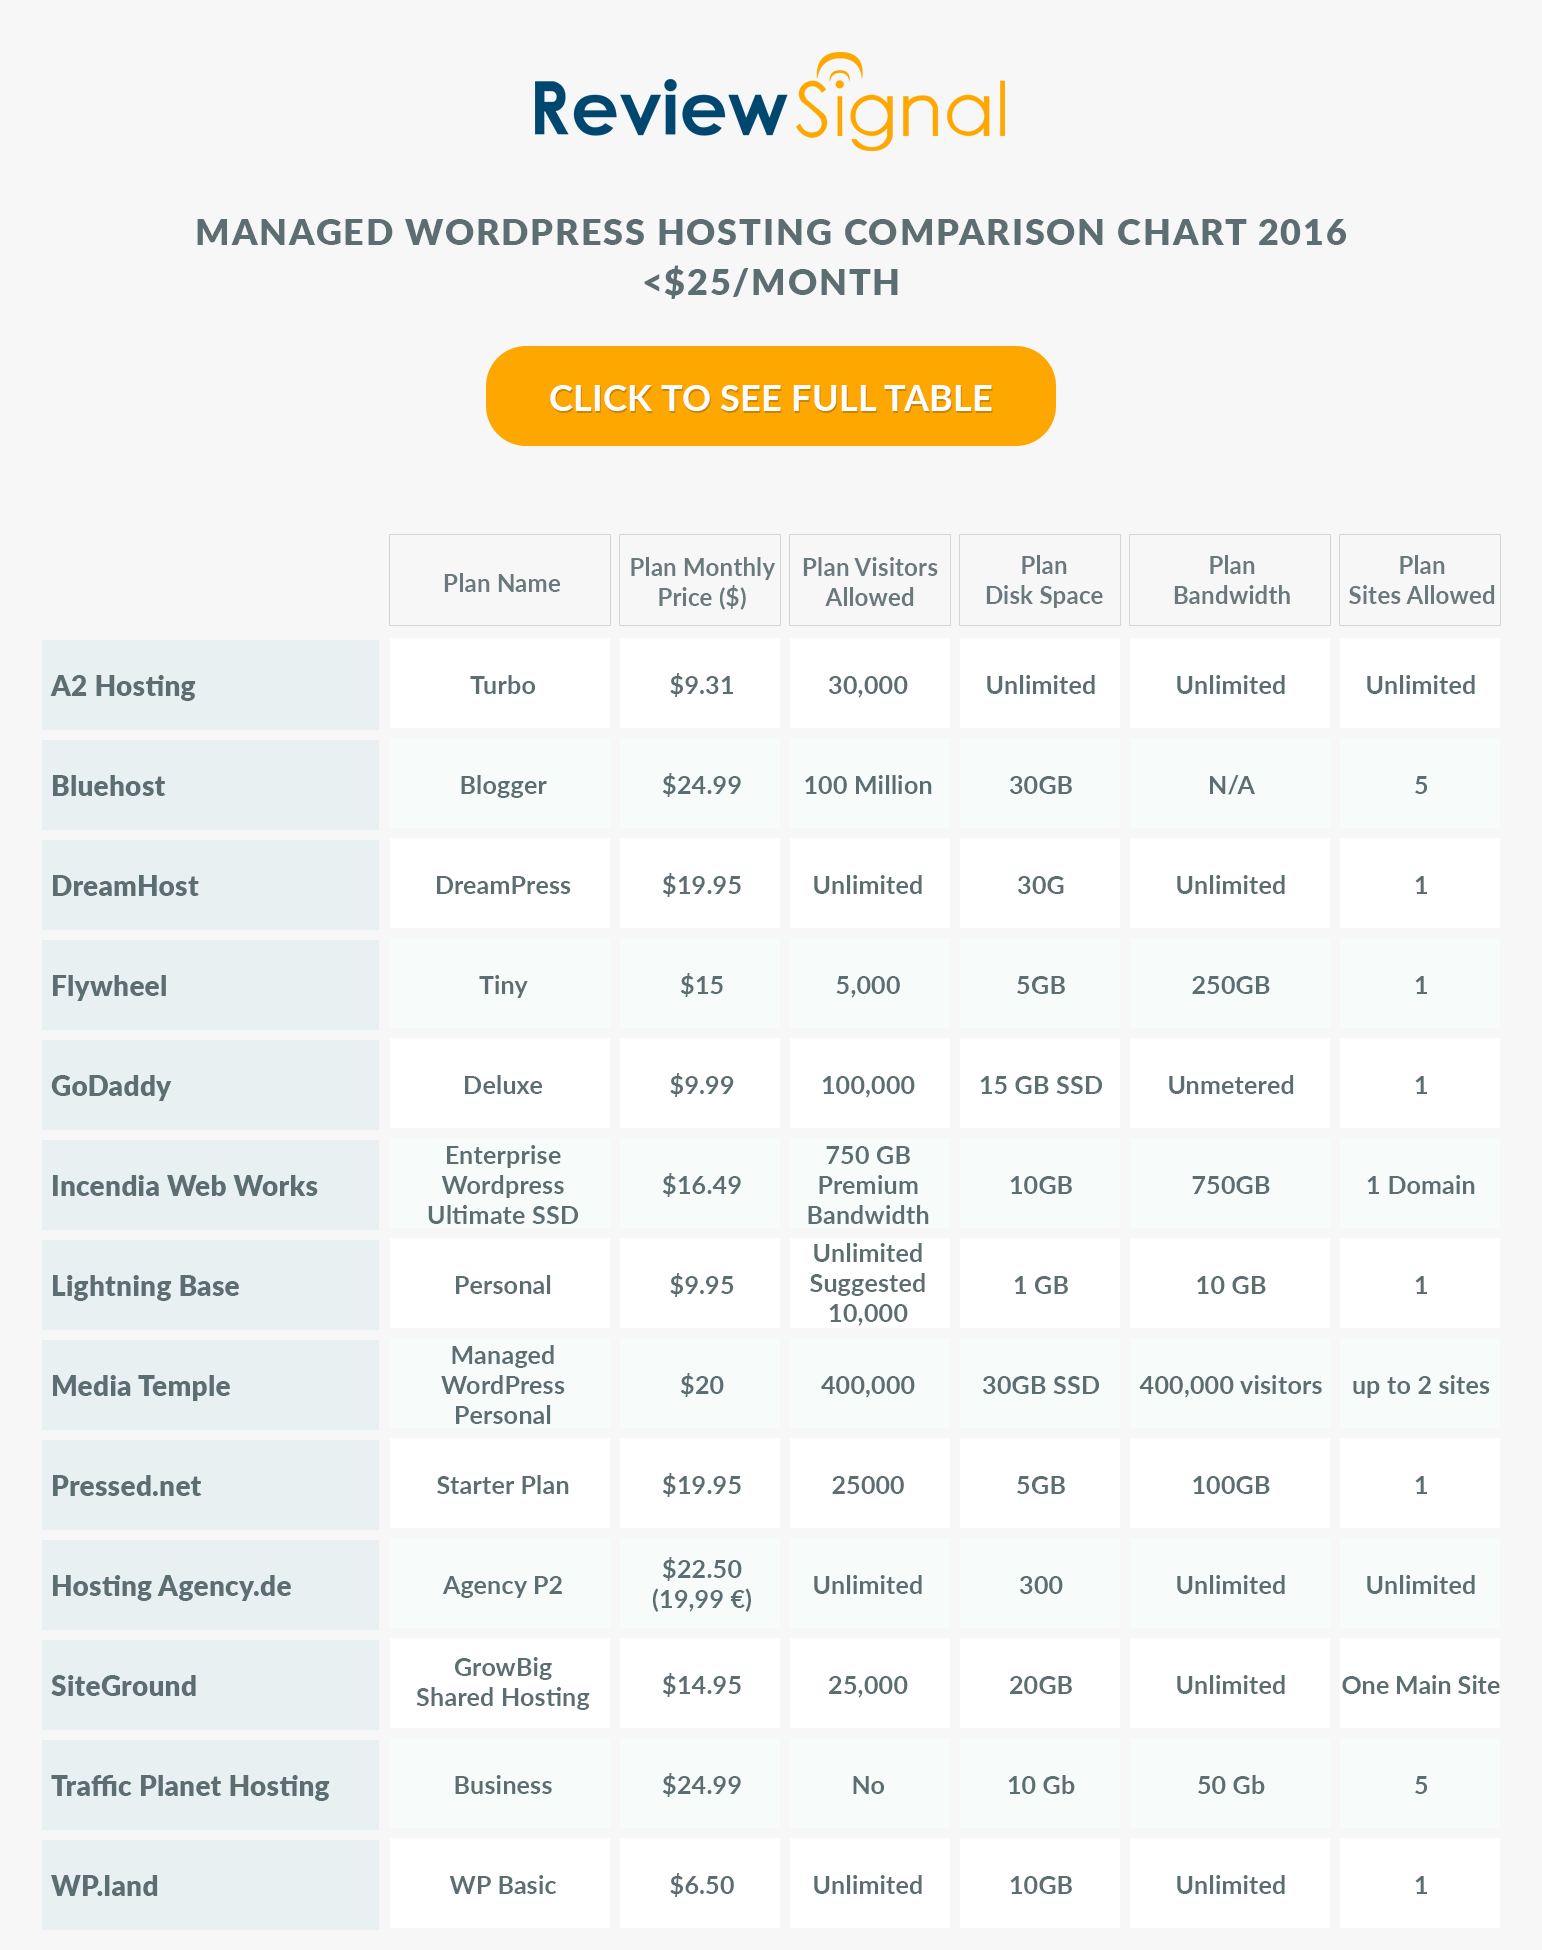
The Products (Click for Full-Size Image)
Methodology
The question I tried to answer is how well do these WordPress hosting services perform? I tested each company on two distinct measures of performance: peak performance and consistency. I've also included a new and experimental compute and database benchmark. Since it is brand new, it has no bearing on the results but is included for posterity and in the hope that it will lead to another meaningful benchmark in the future.
All tests were performed on an identical WordPress dummy website with the same plugins except in cases where hosts added extra plugins. Each site was monitored for over a month for consistency.
1. LoadStorm
LoadStorm was kind enough to give me unlimited resources to perform load testing on their platform and multiple staff members were involved in designing and testing these WordPress hosts. I created identical scripts for each host to load a site, login to the site and browse the site. I tested every company up to 2000 concurrent users. Logged in users were designed to break some of the caching and better simulate real user load.
2. Blitz.io
I used Blitz again to compare against previous results. Since the 1000 user test wasn't meaningful anymore, I did a single test for 60 seconds, scaling from 1-2000 users.
3. Uptime (UptimeRobot and StatusCake)
Consistency matters. I wanted to see how well these companies performed over a longer period of time. I used two separate uptime monitoring services over the course of a month to test consistency.
4. WebPageTest.org
"WebPagetest is an open source project that is primarily being developed and supported by Google as part of our efforts to make the web faster." WebPageTest grades performance and allows you to run tests from multiple locations simulating real users. I tested from Dulles, VA, Miami, FL, Denver, CO, and Los Angeles, CA.
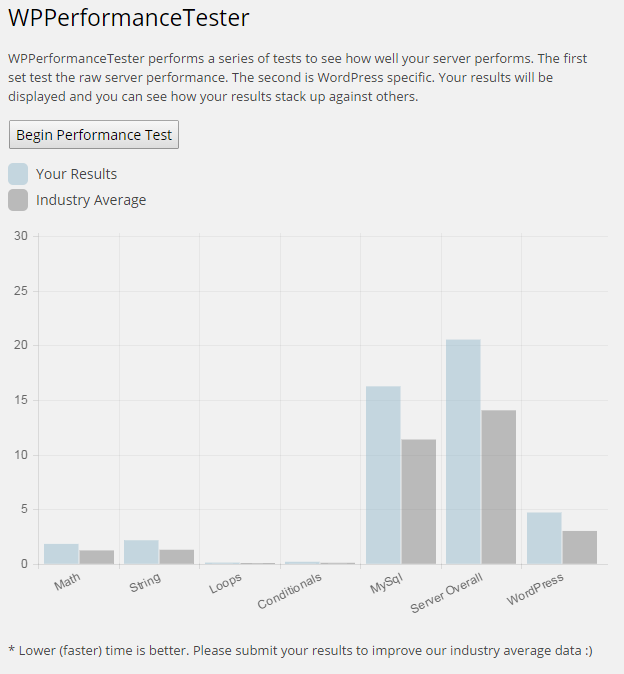
5. WPPerformanceTester
I created a WordPress plugin to benchmark CPU, MySql and WordPress DB performance. It is based on a PHP benchmark script I forked (available on GitHub) and adapted to WordPress. The CPU/MySql benchmarks are testing the compute power. The WordPress component tests actually calling $wpdb and executing insert, select, update and delete queries. This plugin will be open sourced once I clean it up and make it usable for someone beyond myself.
Background Information
Before I go over the results I wanted to explain and discuss a few things. Every provider I tested had the latest version of WordPress installed. I had to ask a lot of companies to disable some security features to perform accurate load tests. Those companies were: DreamHost, Kinsta, LightningBase, Nexcess, Pagely, Pressidium, PressLabs, SiteGround, and WPEngine.
Every company that uses a VPS based platform were standardized around 2GB of memory for their plan (or equivalent) in an effort to make those results more comparable. The exception is DreamHost which uses a VPS platform but uses multiple scaling VPSs.
CloudWays's platform that lets you deploy your WordPress stack to multiple providers: Digital Ocean, Amazon (AWS)'s EC2 servers or Google Compute Engine. I was given a server on each platform of near comparable specs (EC2 Small 1.7GB vs Digital Ocean 2GB vs GCE 1.7GB g1 Small). So CloudWays is listed as CloudWays AWS, CloudWays DO, CloudWays GCE to indicate which provider the stack was running on.
SiteGround contributed a shared and VPS account designated by the Shared or VPS after it.
Results
Since last round didn't have any real issues until 1000 users I skipped all the little tests and began with 100-1000 users. I also did the 500-2000 user test on every company instead of simply disqualifying companies. I ran these tests with an immense amount of help from Phillip Odom at LoadStorm. He spent hours with me, teaching me how to use LoadStorm more effectively, build tests and offering guidance/feedback on the tests themselves.
Test 1. 100-1000 Concurrent Users over 30 minutes
| Name of Test |
Total Requests |
Peak RPS |
Average RPS |
Peak Response Time(ms) |
Average Response Time(ms) |
Total Data Transferred(GB) |
Peak Throughput(kB/s) |
Average Throughput(kB/s) |
Total Errors |
| A Small Orange |
114997 |
90.27 |
61.83 |
1785 |
259 |
2.41 |
1878.14 |
1295.82 |
0 |
| BlueHost |
117569 |
93.62 |
63.21 |
15271 |
2522 |
5.41 |
4680.6 |
2909.16 |
23350 |
| CloudWays AWS |
138176 |
109.1 |
74.29 |
15086 |
397 |
7.15 |
6016.88 |
3844.49 |
44 |
| CloudWays DO |
139355 |
109.88 |
74.92 |
2666 |
321 |
7.21 |
5863.82 |
3876.3 |
0 |
| CloudWays GCE |
95114 |
76.22 |
52.84 |
15220 |
7138 |
3.63 |
3247.38 |
2014.92 |
23629 |
| DreamHost |
143259 |
113.57 |
77.02 |
15098 |
314 |
7.1 |
6136.75 |
3815.73 |
60 |
| FlyWheel |
128672 |
101.98 |
69.18 |
9782 |
571 |
7 |
6197.92 |
3764.6 |
333 |
| GoDaddy |
134827 |
104.6 |
72.49 |
15084 |
352 |
7.49 |
6368.32 |
4028.45 |
511 |
| Kinsta |
132011 |
102.98 |
70.97 |
3359 |
229 |
7.35 |
6078.95 |
3951.75 |
0 |
| LightningBase |
123522 |
100.73 |
68.62 |
4959 |
308 |
6.53 |
5883.15 |
3626.2 |
4 |
| MediaTemple |
134278 |
105.72 |
74.6 |
15096 |
363 |
7.45 |
6397.68 |
4140.7 |
640 |
| Nexcess |
131422 |
104.47 |
70.66 |
7430 |
307 |
7.17 |
6256.08 |
3854.27 |
0 |
| Pagely |
87669 |
70.8 |
47.13 |
7386 |
334 |
5.75 |
5090.11 |
3091.06 |
3 |
| Pantheon |
135560 |
106.42 |
72.88 |
7811 |
297 |
7.24 |
5908.27 |
3890.83 |
0 |
| Pressidium |
131234 |
103.03 |
70.56 |
7533 |
352 |
7.23 |
6092.36 |
3889.64 |
0 |
| PressLabs |
132931 |
107.43 |
71.47 |
10326 |
306 |
3.66 |
3264.02 |
1968.98 |
0 |
| SiteGround Shared |
137659 |
111.35 |
74.01 |
7480 |
843 |
6.85 |
5565.02 |
3683.04 |
111 |
| SiteGround VPS |
130993 |
103.45 |
70.43 |
15074 |
310 |
7.17 |
6061.82 |
3855.86 |
19 |
| WebHostingBuzz |
|
|
|
|
|
|
|
|
|
| WPEngine |
148744 |
117.15 |
79.97 |
15085 |
206 |
7.32 |
6224.06 |
3935.35 |
4 |
| WPOven.com |
112285 |
96.58 |
60.37 |
15199 |
2153 |
5.78 |
5680.23 |
3108.94 |
5594 |
| WPPronto |
120148 |
99.08 |
64.6 |
15098 |
681 |
5.61 |
4698.51 |
3018.33 |
19295 |
Discussion of Load Storm Test 1 Results
Most companies were ok with this test, but a few didn't do well: BlueHost, CloudWays GCE, WPOven and WPPronto. FlyWheel, GoDaddy and Media Temple had a couple spikes but nothing too concerning. I was actually able to work with someone at DreamHost this time and bypass their security features and their results look better than last time. I am also excited that we got PressLabs working this time around after the difficulties last round.
In general, the 1000 user test isn't terribly exciting, 7/21 companies got perfect scores with no errors. Another 6 didn't have more than 100 errors. Again, this test pointed out some weak candidates but really didn't do much for the upper end of the field.
Test 2. 500 - 2000 Concurrent Users over 30 Minutes
Note: Click the company name to see full test results.
|
Total Requests |
Peak RPS |
Average RPS |
Peak Response Time(ms) |
Average Response Time(ms) |
Total Data Transferred(GB) |
Peak Throughput(kB/s) |
Average Throughput(kB/s) |
Total Errors |
| A Small Orange |
242965 |
181.62 |
130.63 |
15078 |
411 |
5.09 |
3844.54 |
2737 |
1 |
| BlueHost |
201556 |
166.83 |
111.98 |
15438 |
8186 |
5.32 |
5229.07 |
2953.17 |
93781 |
| CloudWays AWS |
261050 |
195.23 |
145.03 |
15245 |
2076 |
13.13 |
9685.95 |
7296.4 |
11346 |
| CloudWays DO |
290470 |
218.17 |
161.37 |
15105 |
532 |
14.87 |
12003.3 |
8262.77 |
1189 |
| CloudWays GCE |
193024 |
147.22 |
107.24 |
15168 |
8291 |
4.72 |
4583.86 |
2622.85 |
93821 |
| DreamHost |
303536 |
232.27 |
163.19 |
15100 |
442 |
14.95 |
12619.67 |
8039.54 |
210 |
| FlyWheel |
253801 |
202.15 |
136.45 |
15218 |
1530 |
11.26 |
9939.17 |
6052.49 |
56387 |
| GoDaddy |
283904 |
221.12 |
152.64 |
15025 |
356 |
15.74 |
13731.97 |
8460.12 |
1432 |
| Kinsta |
276547 |
214.93 |
148.68 |
15025 |
573 |
15.16 |
13444.75 |
8151.37 |
1811 |
| LightningBase |
263967 |
211.12 |
141.92 |
7250 |
330 |
13.82 |
13061.01 |
7429.91 |
18 |
| MediaTemple |
286087 |
223.93 |
153.81 |
15093 |
355 |
15.83 |
14532.42 |
8512.11 |
1641 |
| Nexcess |
277111 |
207.73 |
148.98 |
15087 |
548 |
15 |
12313.29 |
8066.37 |
359 |
| Pagely |
181740 |
148.18 |
97.71 |
11824 |
791 |
11.82 |
10592.21 |
6355.09 |
1 |
| Pantheon |
287909 |
223.02 |
154.79 |
15039 |
276 |
15.28 |
13831.45 |
8217.49 |
3 |
| Pressidium |
278226 |
208.55 |
149.58 |
15044 |
439 |
15.28 |
12453.66 |
8213.63 |
12 |
| PressLabs |
280495 |
214.07 |
150.8 |
8042 |
328 |
7.66 |
6267.46 |
4118.34 |
0 |
| SiteGround Shared |
301291 |
231.93 |
161.98 |
15052 |
557 |
14.76 |
12799.09 |
7934.03 |
1837 |
| SiteGround VPS |
279109 |
209.67 |
150.06 |
12777 |
374 |
15.21 |
12506.79 |
8178.5 |
20 |
| WebHostingBuzz |
|
|
|
|
|
|
|
|
|
| WPEngine |
316924 |
241.67 |
170.39 |
7235 |
285 |
15.52 |
12989.23 |
8341.47 |
3 |
| WPOven.com |
213809 |
169.97 |
118.78 |
15268 |
4442 |
8.81 |
7153.5 |
4894.98 |
35292 |
| WPPronto |
258092 |
206.53 |
143.38 |
15246 |
539 |
10.85 |
9483.74 |
6026.26 |
76276 |
Discussion of Load Storm Test 2 Results
The previous companies that struggled ( BlueHost, CloudWays GCE, WPOven and WPPronto) didn't improve, which is to be expected. FlyWheel which had a few spikes ran into more serious difficulties and wasn't able to withstand the load. CloudWays AWS ended up failing, but their Digital Ocean machine spiked but was able to handle the load.
The signs of load were much more apparent this round with a lot more spikes from many more companies. GoDaddy and Media Temple who also had spikes in the first test, had spikes again but seemed to be able to withstand the load. Kinsta spiked early but was stable for the duration of the test. SiteGround Shared had a steady set of small spikes but didn't fail.
Nobody had the same level of perfection as last time with no spike in response times. Only one company managed an error-less run this time (PressLabs) but many achieved similar results, like A Small Orange went from 0 errors to 1, Pantheon went from 0 to 3 and Pagely had only 1 error, again.
The biggest change that occurred was WPEngine. It went from failing on the 1000 user test to having one of the better runs in the 2000 user test. I have to emphasize it was a shared plan on isolated hardware though with no competition for resources.
Test 1. 1-2000 Concurrent Users over 60 seconds
Blitz Test 1. Quick Results Table
Note: Click the company name to see full test results.
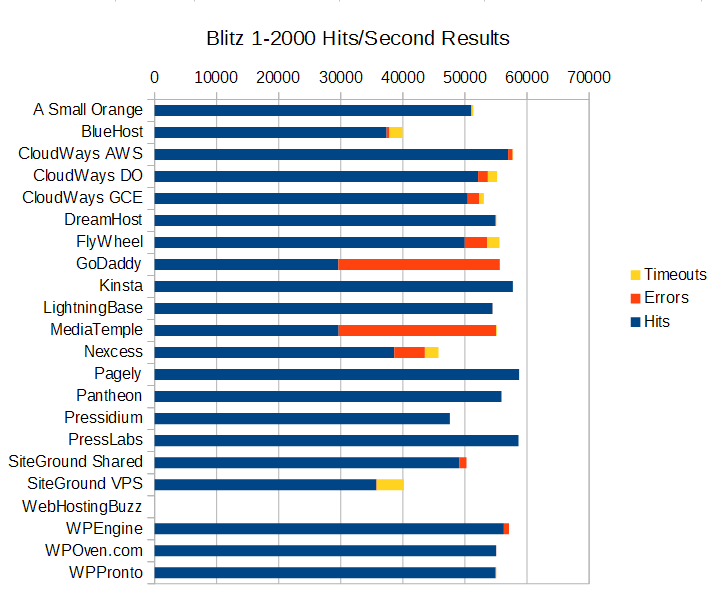
Discussion of Blitz Test 1 Results
This test is just testing whether the company is caching the front page and how well whatever caching system they have setup is performing (generally this hits something like Varnish or Nginx).
Who performed without any major issues?
DreamHost, Kinsta, LightningBase, Pagely, Pantheon, Pressidium, PressLabs, WPOven, WPPronto all performed near perfect. There's nothing more to say for these companies other than they did excellent.
Who had some minor issues?
A Small Orange started showing signs of load towards the end. CloudWays AWS had a spike and started to show signs of load towards the end. SiteGround Shared had a spike at the end that ruined a very beautiful looking run otherwise. WPEngine started to show signs of load towards the end of the test.
Who had some major issues?
BlueHost, CloudWays DO, CloudWays GCE, FlyWheel, GoDaddy, MediaTemple, Nexcess, and SiteGround VPS had some major issues. The CloudWays platform pushed a ton of requests (the only companies over 50,000) but also had a lot of errors and timeouts. The rest were below 50,000 (although FlyWheel was only a hair behind) and also had a lot of errors and timeouts. SiteGround VPS might be an example of how shared resources can get better performance versus dedicated resources. GoDaddy and Media Temple have near identical performance (again, it's the same technology I believe). Both look perfect until near the end where they crash and start erroring out. Nexcess just shows load taking its toll.
Uptime Monitoring
Both uptime monitoring solutions were third party providers that offer free services. All the companies were monitored over an entire month+ (May-June 2015).
Uptime Robot
|
Uptime (30 Day) |
| A Small Orange |
100 |
| BlueHost |
100 |
| CloudWays AWS |
100 |
| CloudWays DO |
100 |
| CloudWays GCE |
100 |
| DreamHost |
94.06 |
| FlyWheel |
100 |
| GoDaddy |
100 |
| Kinsta |
100 |
| LightningBase |
100 |
| MediaTemple |
100 |
| Nexcess |
100 |
| Pagely |
100 |
| Pantheon |
99.94 |
| Pressidium |
100 |
| PressLabs |
100 |
| SiteGround Shared |
100 |
| SiteGround VPS |
100 |
| WebHostingBuzz |
42.9 |
| WPEngine |
100 |
| WPOven.com |
100 |
| WPPronto |
100 |
At this point, I will finally address the odd elephant in the blog post. WebHostingBuzz has empty lines for all the previous tests. Why? Because their service went down and never came back online. I was told that I put an incorrect IP address for the DNS. However, that IP worked when I started and was the IP address I was originally given (hence the 42% uptime, it was online when I started testing). It took weeks to even get a response and once I corrected the IP, all it ever got was a configuration error page from the server. I've not received a response yet about this issue and have written them off as untestable.
The only other company that had any major issue was DreamHost. I'm not sure what happened, but they experienced some severe downtime while I was testing the system and returned an internal server error for 42 hours.
Every other company had 99.9% uptime or better.
StatusCake
StatusCake had a slightly longer window available from their reporting interface, so the percentages are a little bit different and noticeable on companies like DreamHost.
| StatusCake |
Availability (%) |
Response Time (ms) |
| A Small Orange |
99.96 |
0.21 |
| BlueHost |
99.99 |
0.93 |
| CloudWays AWS |
100 |
0.76 |
| CloudWays DO |
100 |
0.47 |
| CloudWays GCE |
100 |
0.69 |
| DreamHost |
97.14 |
1.11 |
| FlyWheel |
100 |
1.25 |
| GoDaddy |
100 |
0.65 |
| Kinsta |
100 |
0.71 |
| LightningBase |
99.99 |
0.61 |
| MediaTemple |
100 |
1.38 |
| Nexcess |
100 |
0.61 |
| Pagely |
99.99 |
0.47 |
| Pantheon |
99.98 |
0.56 |
| Pressidium |
99.99 |
0.94 |
| PressLabs |
100 |
0.65 |
| SiteGround Shared |
100 |
0.54 |
| SiteGround VPS |
100 |
0.9 |
| WebHostingBuzz |
58.1 |
0.67 |
| WPEngine |
100 |
0.71 |
| WPOven.com |
100 |
0.73 |
| WPPronto |
100 |
1.19 |
The results mirror UptimeRobot pretty closely. WebHostingBuzz and DreamHost had issues. Everyone else is 99.9% or better.
StatusCake uses a real browser to track response time as well. Compared to last year, everything looks faster. Only two companies were sub one second average response time last year. This year, almost every company maintained sub one second response time, even the company that had servers in Europe (Pressidium).
WebPageTest.org
Every test was run with the settings: Chrome Browser, 9 Runs, native connection (no traffic shaping), first view only.
| Company |
Dulles,VA |
Miami, FL |
Denver, CO |
Los Angeles, CA |
Average |
| A Small Orange |
0.624 |
0.709 |
0.391 |
0.8 |
0.631 |
| BlueHost |
0.909 |
1.092 |
0.527 |
0.748 |
0.819 |
| CloudWays AWS |
0.627 |
0.748 |
0.694 |
1.031 |
0.775 |
| CloudWays DO |
0.605 |
0.751 |
0.635 |
1.075 |
0.7665 |
| CloudWays GCE |
0.787 |
0.858 |
0.588 |
1.019 |
0.813 |
| DreamHost |
0.415 |
0.648 |
0.522 |
0.919 |
0.626 |
| FlyWheel |
0.509 |
0.547 |
0.594 |
0.856 |
0.6265 |
| GoDaddy |
0.816 |
1.247 |
0.917 |
0.672 |
0.913 |
| Kinsta |
0.574 |
0.559 |
0.587 |
0.903 |
0.65575 |
| LightningBase |
0.544 |
0.656 |
0.5 |
0.616 |
0.579 |
| MediaTemple |
0.822 |
0.975 |
0.983 |
0.584 |
0.841 |
| Nexcess |
0.712 |
0.871 |
0.593 |
0.795 |
0.74275 |
| Pagely |
0.547 |
0.553 |
0.665 |
0.601 |
0.5915 |
| Pantheon |
0.627 |
0.567 |
0.474 |
0.67 |
0.5845 |
| Pressidium |
0.777 |
0.945 |
0.898 |
1.05 |
0.9175 |
| PressLabs |
0.542 |
1.257 |
0.723 |
0.732 |
0.8135 |
| SiteGround Shared |
0.721 |
0.85 |
0.478 |
0.808 |
0.71425 |
| SiteGround VPS |
0.667 |
0.651 |
0.515 |
0.657 |
0.6225 |
| WebHostingBuzz |
|
|
|
|
0 |
| WPEngine |
0.648 |
0.554 |
0.588 |
0.816 |
0.6515 |
| WPOven.com |
0.624 |
0.574 |
0.556 |
0.595 |
0.58725 |
| WPPronto |
0.698 |
0.809 |
0.443 |
0.721 |
0.66775 |
In line with the StatusCake results, the WebPageTest results were shockingly fast. The first time I did this testing, only one company had a sub one second average response time. Last year about half the companies were over one second average response time. The fastest last year was LightningBase at 0.7455 seconds. This year that would be in the slower half of the results. The fastest this year was LightningBase again at 0.579 seconds. The good news for consumers appears to be that everyone is getting faster and your content will get to consumers faster than ever no matter who you choose.
| Company |
PHP Ver |
MySql Ver |
PHP Bench |
WP Bench |
MySql |
| A Small Orange |
5.5.24 |
5.5.42-MariaDB |
13.441 |
406.67 |
LOCALHOST |
| BlueHost |
5.4.28 |
5.5.42 |
12.217 |
738.01 |
LOCALHOST |
| CloudWays AWS |
5.5.26 |
5.5.43 |
10.808 |
220.12 |
LOCALHOST |
| CloudWays DO |
5.5.26 |
5.5.43 |
11.888 |
146.76 |
LOCALHOST |
| CloudWays GCE |
5.5.26 |
5.5.43 |
10.617 |
192.2 |
LOCALHOST |
| DreamHost |
5.5.26 |
5.1.39 |
27.144 |
298.6 |
REMOTE |
| FlyWheel |
5.5.26 |
5.5.43 |
12.082 |
105.76 |
LOCALHOST |
| GoDaddy |
5.4.16 |
5.5.40 |
11.846 |
365.76 |
REMOTE |
| Kinsta |
5.6.7 |
10.0.17-MariaDB |
11.198 |
619.58 |
LOCALHOST |
| LightningBase |
5.5.24 |
5.5.42 |
12.369 |
768.64 |
LOCALHOST |
| MediaTemple |
5.4.16 |
5.5.37 |
12.578 |
333.33 |
REMOTE |
| Nexcess |
5.3.24 |
5.6.23 |
12.276 |
421.76 |
LOCALHOST |
| Pagely |
5.5.22 |
5.6.19 |
10.791 |
79.79 |
REMOTE |
| Pantheon |
5.5.24 |
5.5.337-MariaDB |
12.669 |
194.86 |
REMOTE |
| Pressidium |
5.5.23 |
5.6.22 |
11.551 |
327.76 |
LOCALHOST |
| PressLabs |
5.6.1 |
5.5.43 |
8.918 |
527.7 |
REMOTE |
| SiteGround Shared |
5.5.25 |
5.5.40 |
14.171 |
788.02 |
LOCALHOST |
| SiteGround VPS |
5.6.99 |
5.5.31 |
11.156 |
350.51 |
LOCALHOST |
| WebHostingBuzz |
|
|
|
|
|
| WPEngine |
5.5.9 |
5.6.24 |
10.97 |
597.37 |
LOCALHOST |
| WPOven.com |
5.3.1 |
5.5.43 |
11.6 |
570.13 |
LOCALHOST |
| WPPronto |
5.5.25 |
5.5.42 |
11.485 |
889.68 |
LOCALHOST |
This test is of my own creation. I created a plugin designed to test a few aspects of performance and get information about the system it was running on. The results here have no bearing on how I am evaluating these companies because I don't have enough details to make these meaningful. My goal is to publish the plugin and get people to submit their own benchmarks though. This would allow me to get a better picture of the real performance people are experiencing from companies and track changes over time. The server details it extracted may be of some interest to many people. Most companies were running PHP 5.5 or later but a few aren't. Most companies seem to be running normal MySql, but ASO, Kinsta and Pantheon all are running MariaDB which many people think has better performance. Considering where all three of those companies ended up performing on these tests, it's not hard to believe. There seems to be an even split between running MySql localhost (BlueHost, LightningBase, Nexcess, SiteGround, WPEngine, WPPronto) or having a remote MySql server (DreamHost, GoDaddy, MediaTemple, Pagely, Pantheon, PressLabs).
The PHP Bench was fascinating because most companies were pretty close with the exception of DreamHost which took nearly twice as long to execute.
The WP Bench was all over the place. Pagely had by far the slowest result but on every load test and speed test they went through, they performed with near perfect scores. The test simulates 1000 $wpdb calls doing the primary mysql functions (insert, select, update, delete). Other companies had outrageously fast scores like WPPronto or BlueHost but didn't perform anywhere near as well as Pagely on more established tests.
For those reasons, I don't think this benchmark is usable yet. But I would love feedback and thoughts on it from the community and the hosting companies themselves.
Attempting VPS Parity in Testing
One substantial change to the testing methodology this round was that all VPS providers were tested with the same amount of memory (2 GB Ram). Since the most interesting tests were the load tests I have only graphed them below:
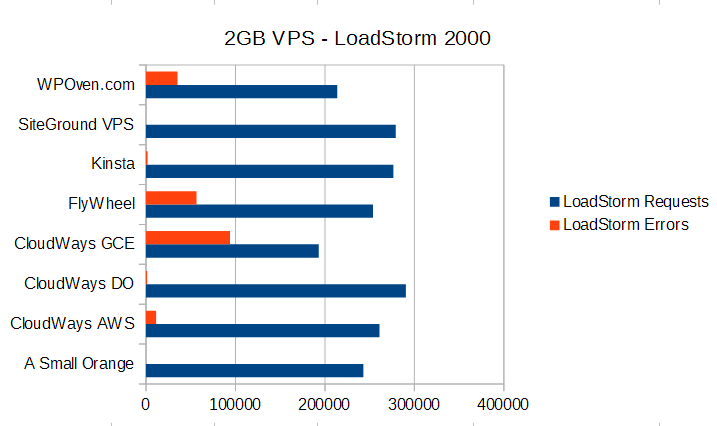
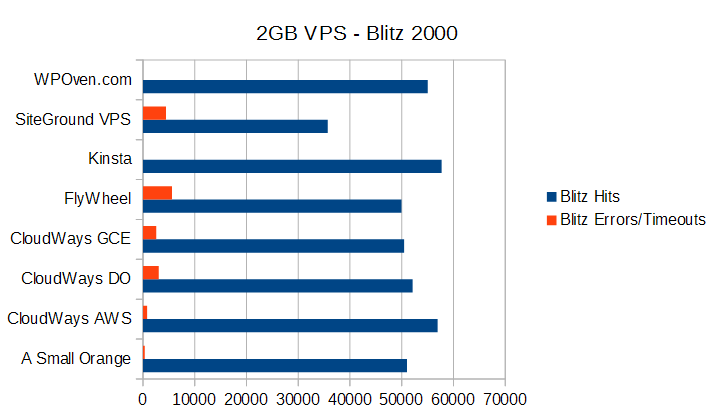
The LoadStorm test had a huge spread in terms of performance. The Google Compute Engine server from CloudWays was by far the worst (an issue we touched on before that it's not a true VPS with dedicated resources). FlyWheel and WPOven also struggled to keep up with the LoadStorm test. Others like ASO, CloudWays DO, Kinsta, and SiteGround handled the test with minimal issues. On the other hand, it's very interesting to see how fairly consistent most of the VPSs perform in the Blitz test between 50,000 and roughly 55,000 hits. The error rates are a bit interesting though because this hardware should be about as close to the same as possible.
The easier result to explain is the Blitz performance. It is testing the ability of these companies to spit back a single page from cache (most likely Varnish or Nginx). So that level of caching seems to be pretty close to parity.
The LoadStorm test shows a wide difference in performance. The LoadStorm test is far more comprehensive and designed to bust through some caching and hit other parts of the stack. It really elucidates the difference in company's ability to tune and optimize their servers from both software and hardware perspectives.
Conclusion
Every service seems to have their issues somewhere if you look hard enough. I try to avoid injecting my personal opinion and bias as much as possible. As I've added more companies to the testing, drawing a line between which companies performed in the top tier and which did not has become blurrier. The closest test was the LoadStorm 2000 test where multiple companies (CloudWays DO, GoDaddy, Kinsta, Media Temple, SiteGround Shared) were on the absolute edge of being top tier providers. Last time I picked an arbitrary 0.5% error rate and these companies were all around the 0.5-0.7% mark. Last year the difference was quite large after that point. I openly admit to having personal connections with people at nearly all these companies and my ability to draw the line in this instance could be considered questionable. So this year I deferred the judgment to an independent party, Phillip Odom at LoadStorm, to determine what he thought of the performances. Phillip is the Director of Performance Engineering at LoadStorm and he has more experience with load testing and the LoadStorm product than almost anyone I know. His job was to determine if the performance could be considered top tier or not. He said a couple spikes early but a stable performance otherwise seemed top tier. The difference in 1/100 of a percent didn't seem like a big deal, especially over a 30 minute test where the issues were at the start as it ramped up to 2000 concurrent users. So the companies on the edge that exhibited that behavior were considered top tier for the LoadStorm test.
I won't be ranking or outright saying any single company is the best. Some providers did exceptionally well and tended to clump together performance-wise, I will call those the top tier providers. This top tier designation is related to performance only and is claimed only from the results of these tests. What each of these companies is offering is different and may best suit different audiences depending on a variety of factors beyond performance, such as features, price, support, and scale (I tested mostly entry level plans OR 2GB RAM plans for VPS providers). I will also provide a short summary and discussion of the results for each provider.
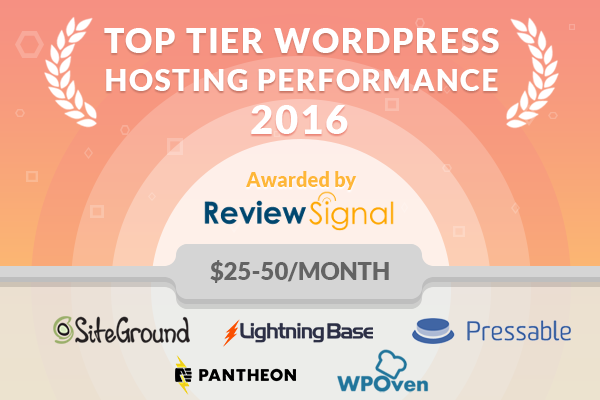
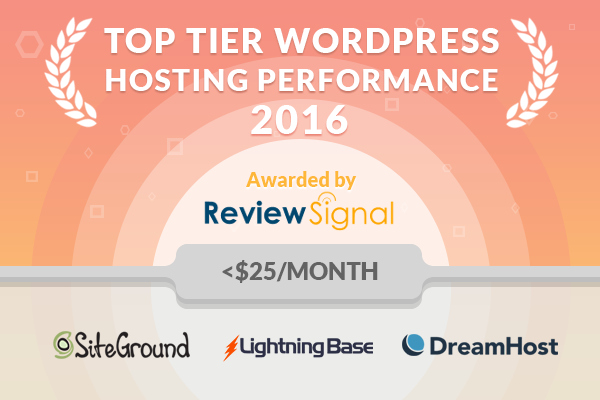
Top Tier WordPress Hosting Performance
A Small Orange, Kinsta, LightningBase, Pagely, Pantheon, Pressidium, PressLabs
Each of these companies performed with little to no failures in all tests and exhibited best in class performance for WordPress hosting.
Honorable Mentions
CloudWays gets an honorable mention because it's Digital Ocean (DO) instance performed quite well overall. It had some issue with the Blitz test at the end but still managed to push through over 52,000 successful hits. It's Amazon stack performed better on the Blitz test but not as well on LoadStorm. I'm not sure why the performance of identical stacks is differing across tests so much between AWS/DO but they improved dramatically since the last test and are on the cusp of becoming a top tier provider.
SiteGround's Shared hosting also gets an honorable mention. It was on that edge for both LoadStorm and Blitz. It had one spike at the end of the Blitz test which caused it's error rate to spike but the response times didn't move.
WPEngine gets an honorable mention because they performed well on most tests. They struggled and were showing signs of load on the Blitz test though that kept them out of the top tier of providers.
Individual Host Analysis
A Small Orange [Reviews]
Another top tier performance from ASO. They didn't really struggle much with any of the tests. Although their performances were slightly below their results last time, it's hard to beat things like having zero errors during LoadStorm's test. It's become easier to launch the LEMP VPS stack which is also nice. All in all, the experience was in-line with what I would expect from a company that has one of the highest support ratings on our site.
BlueHost [Reviews]
Improved against their last results but well below par in the performance department. The pricing and performance just don't match yet.
CloudWays [Reviews]
CloudWays is always a fun company to test. They added another provider since their last test: Google Compute Engine (GCE). Their Digital Ocean and Amazon performances both went up substantially which tells me they've made major improvements on their WordPress stack. We did run into some huge flaws in GCE though which aren't CloudWays's fault. We used the g1.small server on GCE and ran into huge performance walls that were repeatable and inexplicable from a software standpoint. Google was contacted and we learned that the "g1 family has "fractional" CPU, meaning that not a full virtual CPU is assigned to a server. This also means that the CPU is shared with other VMs and "capped" if usage exceeds a certain amount. This is exactly what happened during the load test. The VM runs out of CPU cycles and has to wait for new ones being assigned on the shared CPU to continue to server requests." Essentially, it's not a real VPS with dedicated resources and I was told a comparable would be N1.standard1 which is 2-3x the price of the AWS/DO comparables servers. It doesn't make GCE a very attractive platform to host on if you're looking for performance and cost efficiency. CloudWays did show major improvements this round and earned themselves that honorable mention. They were by far the most improved provider between tests.
DreamHost [Reviews]
DreamPress improved their performance a lot over last round. In fact they did fantastically well on every load test once I got the opportunity to actually work with their engineers to bypass the security measures. However, they failed pretty badly on the uptime metrics. I have no idea what happened but I experienced a huge amount of downtime and ran into some very strange errors. If it wasn't for the severe downtime issues, DreamPress could have been in the top tier.
FlyWheel [Reviews]
FlyWheel were excellent on every test except the final seconds of the Blitz test. Although they were just shy of the top tier, they are showing a lot of consistency in very good performance getting an honorable mention the last two times. Just some minor performance kinks to work out. Not bad at all for a company with the best reviews of any company Review Signal has ever tracked. FlyWheel is definitely worth a look.
GoDaddy [Reviews]
GoDaddy's performance declined this round. It struggled with the Blitz test this time around. I'm not sure what changed, but it handled Blitz far worse than before and LoadStorm slightly worse. The performance between GoDaddy and Media Temple again looked near identical with the same failure points on Blitz. At the retail $6.99 price though, it's still a lot of bang for your buck compared to most providers who are in the $20-30/month range.
Kinsta
Kinsta had another top tier performance. There was a slight decline in performance but that could be explained by the fact we tested different products. Kinsta's test last year was a Shared plan they no longer offer. This year it was a 2GB VPS that we tested. Dedicated resources are great but sometimes shared gives you a little bit extra with good neighbors which could explain the difference. Either way, Kinsta handled all of the tests exceptionally well and earned itself top tier status.
LightningBase
LightningBase is another consistent performer on our list. Another test, another top tier rank earned. It had ridiculous consistency with the Blitz test where the fastest and slowest response were both 81ms. A textbook performance at incredible value of $9.95/month.
Media Temple [Reviews]
Media Temple and GoDaddy are still running the same platform by all indications. Media Temple offers a more premium set of features like Git, WP-CLI, Staging but the performance was identical. It declined from last time and had the same bottlenecks as GoDaddy.
Nexcess
I feel like copy and paste is the right move for Nexcess. Nexcess's performance was excellent in the Load Storm testing. However, it collapsed during the Blitz load testing. This was the same behavior as last year. It handled the Blitz test better this year, but still not well enough. Nexcess ends up looking like a middle of the pack web host instead of a top tier one because of the Blitz test, again.
Pagely [Reviews]
Is the extra money worth it? Only if you value perfection. Pagely came through again with an amazing set of results. It handled more hits than anyone in the Blitz test at a staggering 58,722 hits in 60 seconds (979 hits/second). We're approaching the theoretical maximum at this point of 1000 hits/second. And Pagely did it with 1 error and a 3ms performance difference from the fastest to slowest responses. The original managed WordPress company continues to put on dominant performance results.
Pantheon [Reviews]
Another test, another top tier performance. Just another day being one of the most respected web hosts in the space. Everyone I talk to wants to compare their company to these guys. It's obvious why, they've built a very developer/agency friendly platform that looks nothing like anything else on the market. It also performs fantastically well. They didn't perform the absolute best on any particular test but they were right in the top echelon with minimal errors on everything.
Pressidium
Pressidium was a new entrant and it did exceptionally well. They are UK based and suffered slightly on some performance tests because of latency between the UK and the US testing locations used. For example, the Blitz testing showed fewer responses, but their total of 10 errors shows pretty clearly that it was a throughput across the Atlantic ocean issue more than their service struggling because it had a 1 second spread from the fastest to slowest response. Incredibly consistent performance. Despite their geographic disadvantage in this testing they still managed to keep a sub-one second response from four US testing locations in the WebPageTest testing. Overall, a top tier performance from a competitor from across the pond.
PressLabs
We finally got PressLabs working with the LoadStorm testing software. And it was worth the wait. They were the only company to handle the 2000 logged in user test with zero errors. Combined with the second fastest Blitz test (again without a single error) puts PressLabs firmly in the top tier as you would expect from the most expensive offering tested this round.
SiteGround [Reviews]
It was nice that we finally worked out the security issues in testing with LoadStorm on SiteGround. SiteGround's Shared hosting platform bounced back after last years testing. Their Blitz performance went up substantially and put it back into the honorable mention category. The VPS performance was slightly worse on the Blitz test, but noticeably better on the much longer LoadStorm test. This could be a good example of when Shared hosting can outperform dedicated resources because Shared hosting generally has access to a lot more resources than smaller VPS plans. Depending on how they are setup and managed, you can often get more burst performance from Shared over a small VPS. But in the longer term, dedicated resources are generally more stable (and guaranteed). SiteGround's Shared hosting definitely helps keep the lower priced options with excellent performance a reality for many.
WebHostingBuzz
WebHostingBuzz asked to be included in this testing and then completely disintegrated to the point I couldn't even test them. I still never heard anything from them for months. I would like to know what happened, but until I actually get a response, this one will remain a bizarre mystery.
WPEngine [Reviews]
This is a difficult one to write about. There are definitely performance improvements that occurred. They jumped up to an honorable mention. Their engineers actually worked to resolve some security issues that hindered previous testing. My biggest concern is the isolated shared environment I was on. A shared environment has a lot more resources than many dedicated environments and I was isolated away to prevent the testing from affecting any customers (which is a reasonable explanation). But that means I was likely to be getting the absolute dream scenario in terms of resource allocation, so a normal user would see this in the very best case scenario. So WPEngine is certainly capable of delivering better performance than they did in the past, but I do have concerns about the reasonable expectation of a new user getting the same results.
WPOven
WPOven was another new entrant to this testing and they performed well in a couple tests. They flew through the Blitz test without any issues. Their WebPageTest results were one of the absolute fastest in an already fast pack. Their uptime was perfect. They did struggle with the LoadStorm tests though both at the 1000 and 2000 user levels. It's nice to see more competitors enter the space, WPOven put on a good first show, but there is still some serious improvements to make to catch up to the front of the field.
WPPronto
Another new entrant who ran into a severe testing issue which caused me to re-do all the tests. The server was given more resources than the plan specified while debugging some security issues. The results on the extra resources were on par with some of the top in the field, but not representative of what the actual plan would be able to achieve. I didn't believe it was malicious (they were quite transparent about what happened), so I gave the benefit of the doubt and re-did all testing in a closely monitored condition. With the default resource allocation, WPPronto couldn't withstand LoadStorm's test. The results were pretty easy to see in the 508 errors it started to throw on the properly resourced plan. It ran out of processes to handle new connections as expected. As with all new entrants that don't leap to the forefront, I hope they continue to improve their service and do better next round.
Thank You
Thank you to all the companies for participating and helping make this testing a reality. Thanks to LoadStorm and specifically Phillip Odom for all his time and the tools to perform this testing. Thanks to Peter at Kinsta for offering his design support.
Updates
8/13/2015 : The wrong PDF was linked for DreamHost and its Blitz numbers were adjusted to reflect their actual performance. This change has no effect on how they were ranked since the issue was with downtime.


 WordPress & WooCommerce Hosting Performance Benchmarks 2021
 WooCommerce Hosting Performance Benchmarks 2020
 WordPress Hosting Performance Benchmarks (2020)
 The Case for Regulatory Capture at ICANN
 WordPress Hosting – Does Price Give Better Performance?
 Hostinger Review – 0 Stars for Lack of Ethics
 The Sinking of Site5 – Tracking EIG Brands Post Acquisition
 Dirty, Slimy, Shady Secrets of the Web Hosting Review (Under)World – Episode 1
 Free Web Hosting Offers for Startups