
Introduction
WooCommerce Hosting Performance Benchmarks is spawned off WordPress Hosting Performance Benchmarks and is designed to create a consistent set of benchmarks showing how WooCommerce specialized web hosting companies perform. The focus of these tests is performance, not support, not features, not any other dimension. These benchmarks should be looked at in combination with other sources of information when making any hosting decision. Review Signal's web hosting reviews has insights for some of the companies with regards to aspects beyond performance. That said, for the performance conscious, these benchmarks should be a good guide.
Companies Tested
GreenGeeks
Nestify
Pressable
Seravo
Servebolt
SiteGround [Reviews]
Wetopi
WooCommerce Hosting Performance Benchmarks are entirely opt-in, any company not listed chose not to participate or wasn't aware. You can ask any company to participate and hopefully consumer interest pushes them towards it. Web hosting companies can signup for our Web Hosting Company Mailing List to keep track of when signups are open.
Every plan was donated by the company for testing purposes with the strict stipulation that it would be the same as if any normal user signed up. There is a notes section that details the minutiae of changes made to plans at the end of this post. Nearly every single company had security issues that I had to get around, so they worked to make sure my testing went through properly. Load testing often looks like an attack and it's the only way I can do these tests.
The Products
The only price tier that had enough interest to test was the <$100/month group.

Methodology
The goal of this research is testing the performance of specialized WooCommerce hosting. The two measures to determine performance are peak performance and consistency. Peak performance is measured using load testing services which emulate large numbers of users visiting a website and watching how well the hosting responds under these stressful conditions. Consistency is measured using uptime monitoring to make sure that the servers remain available for a longer duration of time.The methodology is similar to WordPress Hosting Performance Benchmarks. However, the difference is the Load Storm test which was designed to test cached used performance has been modified to test WooCommerce specific paths and emulate an ecommerce traffic profile.
There are some non-impacting measurements taken as well that are recorded to help inform more advanced users and potentially be used to create a benchmark at a later time. Geographic response times from multiple (12) locations using WebPageTest. The WPPerformanceTester performs PHP Benchmarks and WP benchmarks to see how fast the underlying server performs for different kinds of operations. SSL test was added to all price tiers this year. These measures don’t impact the Top-Tier WordPress Hosting status we give, nor the Honorable Mention status.
Uptime monitoring lasted a minimum of three months this year.
The hosting packages are as close to default as possible. In some circumstances where turning on performance enhancements is very simple, e.g. clicking an option to turn on caching, this will be done. Otherwise everything is as-is for new customers upon sign up to avoid as much as possible the extra benefit of companies knowing they are being tested.
This methodology isn’t perfect. One of the most common complaints companies participating have is that it doesn’t encapsulate their service well because they do ‘something special’ for every client. This may be true, but it’s hard to allow this behavior because the difference between ‘every’ client and ‘this specific test’ isn’t measurable. It also relies on good faith from the companies because load testing servers requires permission to do at a meaningful scale. These type of tests often trigger security measures and can impact existing clients. Working with the companies being tested is often a necessity to do these tests properly. Packages are compared to what was submitted and checking for cheating is done regularly. The comparison is designed to be as apples-to-apples as possible.
Testing Costs and Fees
These tests are expensive to run and I refused to accept any hosting sponsorships. There is a participation fee involved to cover the costs. Every company paid the same amount to participate: $250.
There is a re-testing fee if the load tests require more than two attempts for whatever reason. Load testing is the primary cost involved with testing, and if a company fails twice for a legitimate reason (almost exclusively security related), then re-testing is allowed to accommodate dealing with security measures with the associated fee based on tier.
No company needed any additional testing and no additional fees were collected.
Notes - Changes made to Hosting Plans
Almost every company had to disable security measures of some sort.
Many companies had caching turned on from either a click, welcome email instructions or other obvious way that was presented clearly to new users. Some of the instructions might be inside wp-admin, others had features in the control panel to turn on caching/performance optimizing. If it wasn't made explicitly obvious it did not count as default.
Tests
All tests were performed on an identical WooCommerce dummy website with the same plugins except in cases where hosts added extra plugins or code. The Storefront theme was used with the following sample products. The following Plugins were installed: Jetpack, WooCommerce, WooCommerce Admin, WooCommerce Services, WooCommerce Stripe Gateway, and WP Performance Tester.
WooCommerce Specific Settings were a US address, $USD, digital products, Stripe payment gateway, Storefront theme, automated taxes with Jetpack installed.
LoadStorm
The process for LoadStorm was the unique WooCommerce specific test. There were four different profiles created and given their own user distributions (in % after profile), all with 5-10 second page think time. The test scaled from 10 to 1000 concurrent users over 40 minutes and stayed at 1,000 concurrent users for 20 minutes (60 minute test, 20 minute peak).
Profile 1 (20%): Buyer - Homepage, add item to cart, go to cart, checkout (doesn't submit order)
Profile 2 (10%): Existing customer - Homepage, login, view orders, view account details
Profile 3 (20%): Browser - Homepage, second page, product, related product, homepage, product, related product
Profile 4 (50%): Visitor - Homepage only
Results
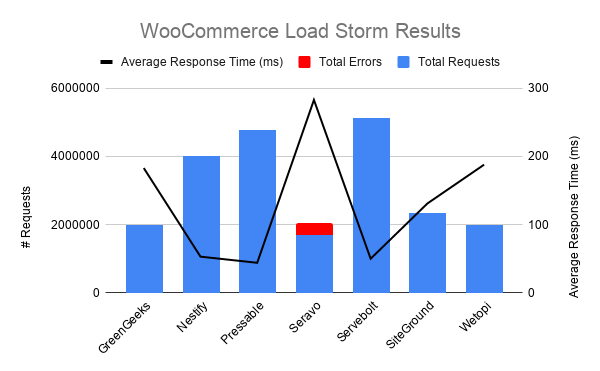
| Company Name | Total Requests | Total Errors | Peak RPS | Average RPS | Peak Response Time(ms) | Average Response Time (ms) | Total Data Transferred (GB) | Peak Throughput (MB/s) |
Average Throughput (MB/s)
|
| GreenGeeks | 1,985,092 | 258 (0.01%) | 788.48 | 551.41 | 15,106 | 183 | 50.34 | 19.92 | 13.98 |
| Nestify | 4,018,521 | 3 (0%) | 1,544.18 | 1,116.26 | 15,075 | 53 | 99.46 | 37.98 | 27.63 |
| Pressable | 4,773,225 | 2 (0%) | 1,847.27 | 1,325.90 | 15,049 | 44 | 119.45 | 46.17 | 33.18 |
| Seravo | 1,702,737 | 343,818 (20.19%) | 576.37 | 472.98 | 15,013 | 283 | 36.56 | 11.75 | 10.15 |
| Servebolt | 5,125,262 | 218 (0%) | 2,016.50 | 1,423.68 | 15,106 | 50 | 118.16 | 46.58 | 32.82 |
| SiteGround | 2,350,950 | 6 (0%) | 914.48 | 653.04 | 10,028 | 131 | 58.49 | 22.87 | 16.25 |
| Wetopi | 1,985,848 | 120 (0.01%) | 729.80 | 551.62 | 10,362 | 188 | 46 | 16.91 | 12.78 |
Discussion
GreenGeeks, Nestify, Pressable, Servebolt, SiteGround and Wetopi handled Load Storm without issue.
Seravo had similar issue in their other load tests in the WordPress Hosting Performance Benchmarks in the $101-200 tier which was a docker proxy bug that couldn't be resolved during the tests.
I decided to take a deeper look at the results and analyze the performance of loading HTML mime types, to ignore a lot of static assets which are cached and bring down average response times.
I broke it down by profile because each script is different in terms of which endpoints on WooCommerce they are hitting.
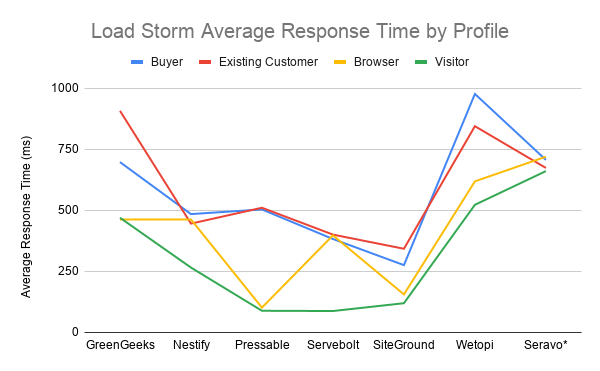
| Average Response Time by Script | Buyer | Existing Customer | Browser | Visitor |
| GreenGeeks | 698 | 908 | 463 | 470 |
| Nestify | 485 | 446 | 463 | 266 |
| Pressable | 504 | 511 | 102 | 89 |
| Servebolt | 383 | 401 | 398 | 88 |
| SiteGround | 276 | 343 | 156 | 120 |
| Wetopi | 977 | 845 | 619 | 523 |
| Seravo* | 707 | 674 | 720 | 661 |
*Seravo included but high error rate makes this number not mean a whole lot.
What we can see from the results is that the homepage only (Visitor profile) is universally the fastest page for every company. That would be expected since the page should be cached and it's only hitting that single endpoint.
The second fastest profile in general seems to be the be the product viewer (Browser profile) who simply looks at different products on the site.
The Buyer and Existing Customer profiles appear to be the heaviest - although it's unclear one is obviously more stressful for WooCommerce based on the results. Both are having to deal with data being sent to the server and handled in a unique manner for each request.
It is reassuring to see that the generally expected outcome matches the reality. It's also nice to see the average response time under 1000ms for even the heavier pages.
LoadImpact
LoadImpact ran a simple Lua script that requested the frontpage of the test site. It scaled from 1 to 2,000 users. It was designed to emulate the old Blitz.io test of simply hammering the cache. Source code.
Results
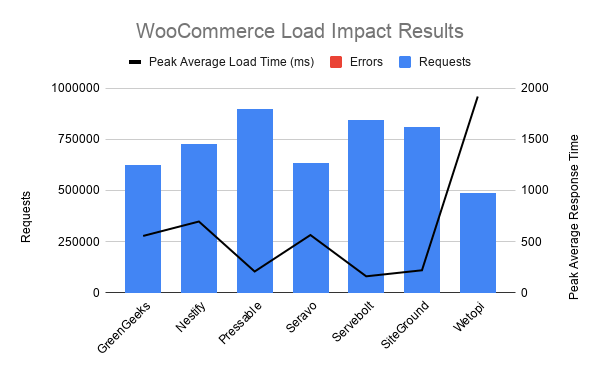
| Company Name | Requests | Errors | Data Transferred (GB) | Peak Average Load Time (ms) | Peak Average Bandwidth (Mbps) | Peak Average Requests/Sec |
| GreenGeeks | 626519 | 0 | 30.23 | 556 | 488.88 | 1210 |
| Nestify | 728945 | 0 | 36.33 | 697 | 602.67 | 1440 |
| Pressable | 899263 | 0 | 43.89 | 208 | 753.41 | 1840 |
| Seravo | 632203 | 0 | 30.67 | 565 | 488.38 | 1230 |
| Servebolt | 843550 | 12 | 38.26 | 161 | 621.11 | 1630 |
| SiteGround | 808259 | 0 | 38.9 | 220 | 619 | 1530 |
| Wetopi | 487848 | 551 | 24.22 | 1920 | 311.42 | 766.76 |
Discussion
Green Geeks, Nestify, Pressable, Seravo Servebolt and SiteGround all handled this test without issue.
Wetopi struggled a some and peak average load time was up to 1920ms.
WebPageTest.org
Tests will be run from 12 locations. Dulles, Denver, LA, London, Frankfurt, Rose Hill (Mauritius), Singapore, Mumbai, Japan, Sydney, Brazil and Israel using EC2 instances where possible.
Results
Discussion
Servebolt was the fastest in three locations but had the lowest average response time around the world doing consistently well amongst its peers. Wetopi was the fastest in 4 locations and slowest in four locations, an interesting pattern. Nestify was the slowest in 7/12 locations which is a little disappointing but then it ends up being the fastest in Frankfurt and second fastest in Dulles.
Uptime Monitoring
Uptime was monitored for at least three months for the homepage of the site. UptimeRobot and StatusCake were used to monitor uptime at 1 minute and 5 minute intervals respectively. A self-hosted an uptime monitor as a third (backup) to compare against, if discrepancies existed between UptimeRobot and StatusCake, using PHP Server Monitor was also running (Custom Uptime).
Results
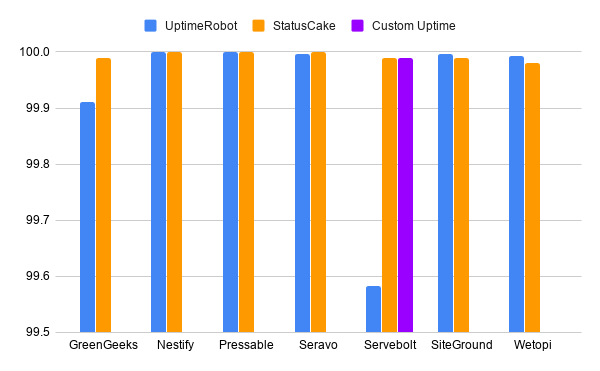
| Company Name | UptimeRobot | StatusCake | Custom Uptime |
| GreenGeeks | 99.911 | 99.99 | |
| Nestify | 100 | 100 | |
| Pressable | 100 | 100 | |
| Seravo | 99.997 | 100 | |
| Servebolt | 99.583 | 99.99 | 99.99 |
| SiteGround | 99.996 | 99.99 | |
| Wetopi | 99.993 | 99.98 |
Discussion
Every company was above the 99.9% threshold I would expect from any company. The only issue was a strange discrepancy between UptimeRobot and StatusCake on Servebolt's uptime. One showed a very low 99.583 and the other 99.99. The third monitor I setup showed 99.99%, so the issue appears to be with Uptime Robot.
WPPerformanceTester
This plugin will run its performance test. Plugin is available at WordPress.org.
Results
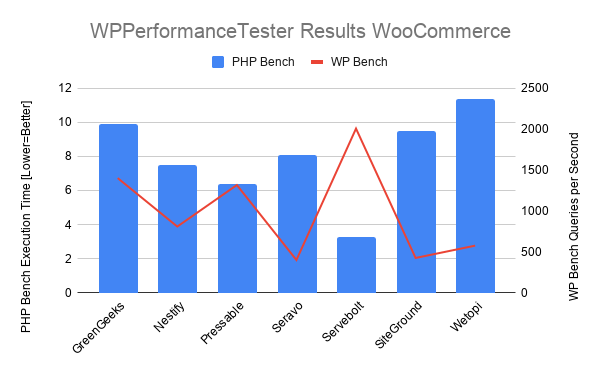
Discussion
Servebolt was the obvious standout here. They had the highest queries per second and lowest PHP Bench time.
Qualsys SSL Report Grade
The tool is available at https://www.ssllabs.com/ssltest/. Every single B grade this year was for the following reason according to Qualsys: "This server supports TLS 1.0 and TLS 1.1. Grade capped to B."
Results
| Company Name | Qualys SSL Report |
| GreenGeeks | A+ |
| Nestify | B |
| Pressable | A |
| Seravo | B |
| Servebolt | B |
| SiteGround | A |
| Wetopi | B |
Discussion
Green Geeks was the only company to receive an A+ rating.
Ratings
There are two levels of recognition awarded to companies that participate in the tests. There is no ‘best’ declared, it’s simply tiered, it’s hard to come up with an objective ranking system because of the complex nature of hosting. These tests also don’t take into account outside factors such as reviews, support, and features. It is simply testing performance as described in the methodology.
Top Tier WooCommerce Hosting
This is awarded to companies who maintain 99.9% uptime throughout the entire testing and show little to no performance degradation during load testing, primarily focused on error rate and response times.
Congratulations to Green Geeks, Nestify, Pressable, Servebolt and SiteGround for earning the first ever Top Tier WooCommerce Performance award.
Honorable Mention
Honorable mentions are given to companies that came close to Top Tier status but for one reason or another fell just slightly short. This could be struggling slightly on a load test or having some minor uptime issues.
No Honorable Mentions were earned this year.
Individual Host Analysis
GreenGeeks
Green Geeks did well on every test. It didn't stand out in any of them as the fastest but it handled every test without failures and kept response times from increasing. It was also on the cheapest package competing. Well done and congratulations to Green Geeks for earning Top Tier honors.
Nestify
Nestify had only three errors total in both load tests which is excellent. The average response time on Load Storm was a very fast 53ms. Capped off with perfect 100% uptime on both monitors was an excellent performance overall for Nestify. I'd like to see WebPageTest scores get faster but that's a minor complaint. It was a Top Tier performance and Nestify deserves the recognition.
Pressable
Perfect uptime is a solid start. Pressable also had the second fastest Average Response Time on WebPageTest. It also was the fastest average response time on Load Storm. It was fastest on Browser profile as well as 1ms behind the fastest on the visitor profile. It was also the second fastest on Load Impact and handled the most requests. Pressable earned Top Tier performance for an impressive inaugural run on the WooCommerce tests.
Seravo
Near perfect uptime with 100% and 99.97% was a solid start. The Load Impact test went smoothly with zero errors. However, an unfortunate docker proxy bug that couldn't be fixed caused a high number of errors on Load Storm knocking it out of any recognition. A solid start, hopefully next year the kinks will be worked out and we will see them do better.
Servebolt
Servebolt had the fastest WebPageTest average, fastest PHP Bench, highest WP Bench and fastest Peak Average Load Time on Load Impact. Throw in second fastest average response on Load Storm. Then on the broken down by script measuring time for key pages to load, they were the second fastest on both Buyer and Existing Customer profiles, third on Browser profile and first on the Visitor profile. Servebolt had an awful lot of fast across all the tests, a very well earned Top Tier performance.
SiteGround [Reviews]
SiteGround had solid uptime with 99.99% and 99.996%. It had the third fastest Load Impact Peak Average Load Time. It was also the fastest on the Buyer and Existing Customer profiles along with second and third on Browser and Visitor profiles respectively. SiteGround earned Top Tier recognition for its great performance.
Wetopi
A solid uptime was recorded at 99.993% and 99.98%. WebPageTest had Wetopi earning the fastest and slowest in some locations. Interesting pattern on the radar chart. Load Storm Wetopi held up but it was on the slower end in most measures compared to its competitors. Unfortunately, the problem was Load Impact which caused load times to peak at almost 2 seconds. It was a decent performance but there's still improvements to be made.
Kevin Ohashi
Latest posts by Kevin Ohashi (see all)
- Analyzing Digital Ocean’s First Major Move with Cloudways - February 28, 2023
- Removing old companies - June 28, 2021
- WordPress & WooCommerce Hosting Performance Benchmarks 2021 - May 27, 2021
 WordPress & WooCommerce Hosting Performance Benchmarks 2021
 WooCommerce Hosting Performance Benchmarks 2020
 WordPress Hosting Performance Benchmarks (2020)
 The Case for Regulatory Capture at ICANN
 WordPress Hosting – Does Price Give Better Performance?
 Hostinger Review – 0 Stars for Lack of Ethics
 The Sinking of Site5 – Tracking EIG Brands Post Acquisition
 Dirty, Slimy, Shady Secrets of the Web Hosting Review (Under)World – Episode 1
 Free Web Hosting Offers for Startups