The full company list, product list, methodology, and notes can be found here.
This post focuses only on the results of the testing in the $25-50/month price bracket for WordPress Hosting.
Contents
Other Price Tier Results
<$25/Month Tier$25-50/Month Tier$51-100/Month Tier$101-200/Month Tier$201-500/Month Tier$500+/Month (Enterprise) Tier
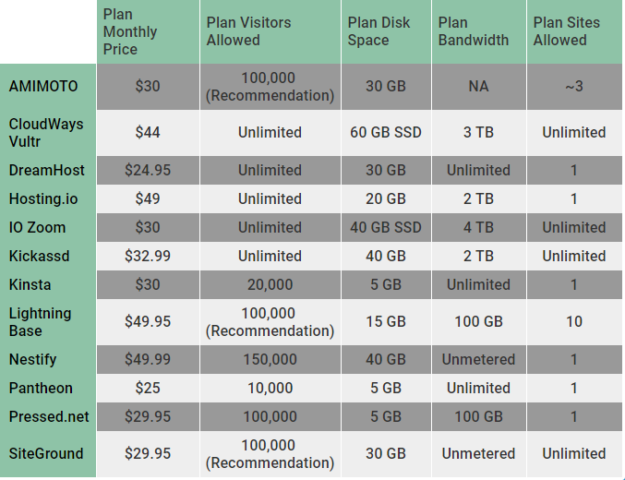
Hosting Plan Details
Click the table below to see the full product specifications sheet.
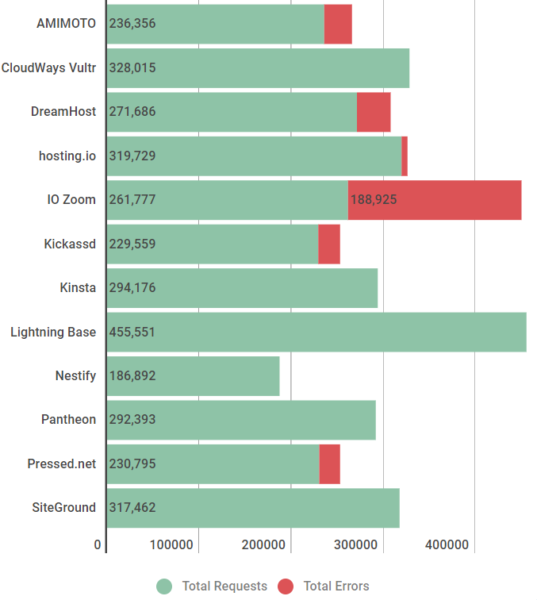
Load Storm Testing Results
This test scaled from 500 to 2000 users over 30 minutes with 10 minutes at the peak.
Results Table
| Total Requests | Total Errors | Peak RPS | Average RPS | Peak Response Time(ms) | Average Response Time (ms) | Total Data Transferred (GB) | Peak Throughput (MB/s) | Average Throughput (MB/s) | |
| AMIMOTO | 236356 | 30092 | 155.07 | 131.31 | 16233 | 3941 | 13.99 | 10.84 | 7.77 |
| CloudWays Vultr | 328015 | 0 | 249.5 | 182.23 | 7372 | 360 | 22.27 | 18.55 | 12.37 |
| DreamHost | 271686 | 36683 | 217.13 | 150.94 | 15732 | 1215 | 16.67 | 13.57 | 9.26 |
| hosting.io | 319729 | 6520 | 239.18 | 177.63 | 10156 | 310 | 24.48 | 20.23 | 13.6 |
| IO Zoom | 261777 | 188925 | 248.08 | 145.43 | 15400 | 2045 | 4246 | 7.64 | 2.36 |
| Kickassd | 229559 | 23536 | 196.28 | 127.53 | 17892 | 3507 | 13.97 | 10.77 | 7.76 |
| Kinsta | 294176 | 3 | 225.5 | 163.43 | 10036 | 355 | 21.38 | 17.58 | 11.88 |
| Lightning Base | 455551 | 16 | 360.55 | 253.08 | 15099 | 401 | 25.72 | 21.06 | 14.29 |
| Nestify | 186892 | 0 | 214.7 | 103.83 | 13293 | 2245 | 12.57 | 9.29 | 6.99 |
| Pantheon | 292393 | 5 | 220.72 | 162.44 | 4287 | 162 | 22.79 | 17.5 | 12.66 |
| Pressed.net | 230795 | 22493 | 180.27 | 128.22 | 16007 | 3030 | 15.7 | 14.19 | 8.72 |
| SiteGround | 317462 | 16 | 245.1 | 176.37 | 4569 | 404 | 21.23 | 17.25 | 11.79 |
Discussion
CloudWays [Reviews] Vultr, Kinsta, LightningBase, Pantheon [Reviews], and SiteGround [Reviews] handled this test without issue.
Hosting.io had a strange issue where two files wouldn't behave when being served off the CDN and generated a low level error rate throwing a consistent 429 too many requests error.
Nestify had no errors but the response time went up substantially to an average of over two seconds.
AMIMOTO, DreamHost [Reviews], IOZoom, Kickassd, and Pressed.net struggled with this test; they showed errors and increased response times.
Load Impact Testing Results
This test scaled from 1 to 1000 users over 15 minutes. Error count capped at 5,000.
Results Table
| Requests | Errors | Data Transferred (GB) | Peak Average Load Time (Seconds) | Peak Average Bandwidth (Mbps) | Peak Average Requests/Sec | |
| AMIMOTO | 196858 | 34 | 10.48 | 2.98 | 113 | 260 |
| CloudWays Vultr | 335275 | 0 | 18.21 | 0.544 | 278 | 624 |
| DreamHost | 335066 | 0 | 16.42 | 0.451 | 272 | 676 |
| hosting.io | 354067 | 12 | 15.96 | 0.438 | 276 | 746 |
| IO Zoom | 315307 | 49 | 16.85 | 0.921 | 237 | 541 |
| Kickassd | 334327 | 0 | 17.94 | 0.481 | 286 | 652 |
| Kinsta | 337031 | 0 | 18.05 | 0.41 | 304 | 694 |
| Lightning Base | 338834 | 0 | 18.19 | 0.398 | 302 | 688 |
| Nestify | 199049 | 120 | 10.58 | 3.25 | 134 | 308 |
| Pantheon | 426896 | 0 | 23.73 | 0.159 | 401 | 880 |
| Pressed.net | 350659 | 0 | 18.73 | 0.375 | 303 | 692 |
| SiteGround | 316927 | 0 | 16.89 | 0.531 | 280 | 642 |
Discussion
DreamHost [Reviews], Hosting.io, Kickassd, Kinsta, LightningBase, Pantheon [Reviews], Pressed.net, and SiteGround [Reviews] handled this test without issue.
CloudWays [Reviews] Vultr and IOZoom started to show a bit of load towards the end of the test with increased response times but neither went up by a huge amount maintaining 1s or lower.
AMIMOTO and Nestify appeared to hit a 100Mbps cap and load times started to increase as the network became saturated.
Impressively there were no complete failures on this test at this price tier.
Uptime Monitoring Results
Results Table
| UptimeRobot | StatusCake | |
| AMIMOTO | 100 | 100 |
| CloudWays Vultr | 100 | 100 |
| DreamHost | 100 | 100 |
| hosting.io | 100 | 100 |
| IO Zoom | 99.15 | 99.09 |
| Kickassd | 100 | 100 |
| Kinsta | 100 | 100 |
| Lightning Base | 100 | 100 |
| Nestify | 99.81 | 99.96 |
| Pantheon | 100 | 100 |
| Pressed.net | 99.66 | 99.58 |
| SiteGround | 99 | 98.94 |
Discussion
AMIMOTO, CloudWays Vultr, DreamHost, Hosting.io, Kickassd, Kinsta, LightningBase, and Pantheon all had perfect uptime.
Oddly enough, nobody was in the 99.9-<100 range, it was all or nothing in this price bracket.
IO Zoom, Nestify, Pressed and SiteGround struggled falling short of the 99.9% threshold.
WebPageTest.org Results
Results Table
| WPT Dulles | WPT Denver | WPT LA | WPT London | WPT Frankfurt | WPT Rose Hill, Mauritius | |
| AMIMOTO | 0.327 | 1.176 | 0.994 | 0.806 | 0.901 | 1.874 |
| CloudWays Vultr | 0.33 | 1.305 | 1.014 | 0.725 | 0.785 | 2.497 |
| DreamHost | 0.798 | 1.256 | 0.792 | 1.255 | 1.52 | 3.311 |
| hosting.io | 0.49 | 1.456 | 1.049 | 0.396 | 0.23 | 1.054 |
| IO Zoom | 0.415 | 1.244 | 0.822 | 1.174 | 1.261 | 3.099 |
| Kickassd | 0.346 | 1.427 | 1.149 | 0.811 | 0.909 | 2.65 |
| Kinsta | 0.387 | 1.287 | 0.833 | 1.076 | 1.014 | 2.436 |
| Lightning Base | 0.429 | 1.118 | 0.797 | 1.173 | 1.186 | 2.436 |
| Nestify | 0.363 | 1.353 | 1.167 | 0.794 | 0.738 | 2.34 |
| Pantheon | 0.355 | 1.57 | 0.797 | 0.448 | 0.369 | 1.093 |
| Pressed.net | 0.462 | 1.491 | 1.217 | 0.949 | 1.046 | 2.049 |
| SiteGround | 0.508 | 1.358 | 0.894 | 1.082 | 1.235 | 2.108 |
| WPT Singapore | WPT Mumbai | WPT Japan | WPT Sydney | WPT Brazil | |
| AMIMOTO | 2.433 | 1.664 | 1.61 | 1.876 | 1.103 |
| CloudWays Vultr | 2.163 | 2.287 | 1.613 | 1.978 | 1.195 |
| DreamHost | 1.92 | 2.701 | 1.073 | 1.935 | 2.305 |
| hosting.io | 0.89 | 1.041 | 0.849 | 0.915 | 0.679 |
| IO Zoom | 2.357 | 2.401 | 1.896 | 2.025 | 1.532 |
| Kickassd | 2.97 | 1.748 | 1.796 | 2.466 | 1.374 |
| Kinsta | 1.902 | 2.114 | 1.186 | 1.609 | 1.513 |
| Lightning Base | 1.728 | 2.098 | 1.304 | 1.771 | 1.479 |
| Nestify | 2.686 | 2.233 | 2.168 | 2.646 | 0.931 |
| Pantheon | 0.433 | 0.692 | 0.419 | 0.528 | 0.405 |
| Pressed.net | 2.589 | 1.992 | 1.891 | 2.167 | 1.362 |
| SiteGround | 2.564 | 2.329 | 1.769 | 2.126 | 1.565 |
Discussion
There isn't a whole lot to say since this is a non-impacting metric in terms of the results. Nobody had huge issues.
I looked at the aggregate change again for the locations which were similar. There were 12 companies this year and last year in this price bracket. Across the nine same locations used, there was a cumulative decrease in response time of 3.16 seconds. For instance, Dulles dropped from 0.95 to 0.43 seconds on average.
WPPerformanceTester Results
Results Table
| PHP Bench | WP Bench | |
| AMIMOTO | 10.016 | 803.8585209 |
| CloudWays Vultr | 9.616 | 346.1405331 |
| DreamHost | 7.939 | 77.70611547 |
| hosting.io | 9.799 | 701.2622721 |
| IO Zoom | 13.561 | 825.7638315 |
| Kickassd | 10.739 | 1584.786054 |
| Kinsta | 8.853 | 1036.26943 |
| Lightning Base | 8.726 | 1288.659794 |
| Nestify | 12.098 | 213.0833156 |
| Pantheon | 9.914 | 163.2120124 |
| Pressed.net | 10.697 | 218.7705097 |
| SiteGround | 10.44 | 890.4719501 |
Discussion
DreamHost had the fastest PHP bench and Kickassd had the fastest WP bench.
The average PHP bench went from 12.85 to 10.20 from the 2016 benchmarks in this price tier. The average WP bench went from 647 to 679. So we saw both scores improve, the PHP benchmark substantially.
One thing to note is that WP bench scores can vary tremendously based on the database architecture. You'll often see faster scores on architectures running the database locally compared to ones that run separately or have redundancy built in.
Conclusion
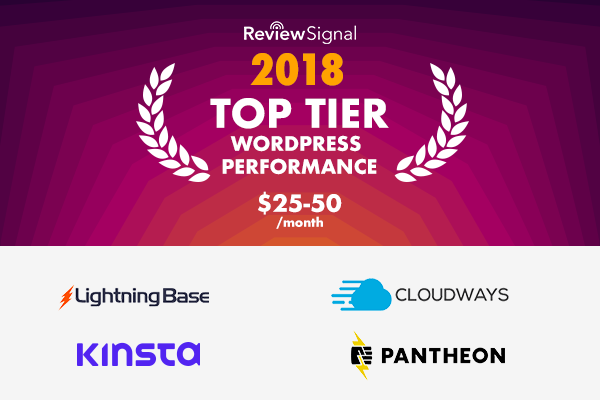
Top Tier
CloudWays [Reviews] Vultr, Kinsta, LightningBase and Pantheon [Reviews] all earned Top Tier status this year for going through all the tests without any significant issues.
Honorable Mention
Hosting.io earns an honorable mention for doing well on every test but having one strange CDN issue which we weren't able to resolve.
Individual Host Analysis
AMIMOTO
A new entrant is always nice to see. AMIMOTO kept perfect uptime at 100% on both monitors. They also had the quickest WebPageTest score for any single location test, Dulles - 0.327 seconds. Unfortunately, the load tests didn't go quite as well. Load Impact seemed to saturate the server's network connection at 100 Mbps. LoadStorm seemed to overwhelm the server and cause increased response times and errors.
CloudWays Vultr
CloudWays [Reviews] Vultr had one minor spike during the Load Impact test which caused response time to increase slightly peaking at around 600ms with no errors. Other than that, it was a near perfect run with 100% uptime and 0 errors on both load tests. This great performance earned CloudWays its' first Top Tier WordPress Hosting Performance award. I like to see companies compete year after year and improve. Congratulations to CloudWays.
DreamHost
DreamHost [Reviews] didn't do as well as last year which saw them earn Top Tier status. They were perfect on everything except the Load Storm test which seemed to overwhelm the server this year. It's a bit disappointing to see a decline from a company, but I know if anyone is going to work hard to make sure they are continually improving it's DreamHost. This isn't the first time they didn't do as well as they hoped and they came back the next year and earned Top Tier status.
Hosting.io
Hosting.io was another newcomer this year who did fantastically well. Hosting.io managed to earn and honorable mention on their first run. They had a perfect uptime and great Load Impact test scores. A weird CDN issue on Load Storm caused them to just fall short of Top Tier status. A few little kinks to work out and I expect them join the Top Tier next year. Overall, it looks like another great offering in the performance department.
IO Zoom
IOZoom is a new entrant that still has a lot of room for improvement. There were struggles across the board. The uptime wasn't quite up to par because of some server maintenance issues. The Load Storm test didn't go well. The Load Impact test went a lot better but still not at the top tier level. It's great to have IO Zoom participating and I hope big improvements to their system will help them make the jump up the rankings next year.
Kickassd
Kickassd was another new entrant who did well on a few of the tests. Kickassd had perfect uptime and put up a top tier level performance on the Load Impact test. However, the Load Storm test, which is the most difficult of them all, overwhelemed the Kickassd server. It was a good first performance and I know some performance improvements have already been deployed because of the test results. I look forward to seeing Kickassd kickass next year.
Kinsta
It's almost boring writing about Kinsta. 100% uptime. 0 Load Impact errors. 3 Load Storm errors. Another Top Tier performance that I've come to expect.
Lightning Base
I could literally just repeat what I wrote above about LightningBase. Near perfect tests that earned them their 4th consecutive Top Tier recognition.
Nestify
Nestify struggled, their uptime was borderline with one monitor showing above 99.9% and one below. This was caused by a block storage maintenance/failure at Vultr according to them. Load Impact got stressed but didn't error out hitting a 100 Mbps cap in the network. Load Storm had no errors but a slow response time. It looks like the pieces of a top tier host are there if they can put it all together and improve their network infrastructure.
Pantheon
Pantheon [Reviews] is another regular in the Top Tier category. They earned yet another recognition this year for a perfect uptime and near perfect load test scores. I also noticed they seem to have some of the best geographical response times on WebPageTest.
Pressed.net
Pressed.net earned an honorable mention last year but fell a bit this year. One thing to note is that there was a change in ownership with Envato buying the company between this period. There were some uptime struggles. Load Impact was fantastic. But Load Storm had a lot of errors. Heavy dynamic sites I was told was not their focus which the Load Storm test simulates.
SiteGround
SiteGround [Reviews] has regularly been awarded in these tests and earned awards in other price tiers. However, this plan had one major struggle - uptime. The server wasn't able to maintain the 99.9% uptime required to earn an award. They had excellent performances on the Load Storm and Load Impact tests.
SiteGround issued a statement about the issue,
"The recorded downtime for the SiteGround GoGeek hosting plan during the test was not a result of actual server availability issues. The uptime is below 99.9% because during performance testing an automatic limitation system temporarily kicked in, in a way that prevented the uptime test to be properly executed. SiteGround confirmed that this particular limitation system should not have been active on the tested accounts and is currently not active on any of their production servers."
Other Price Tier Results
<$25/Month Tier$25-50/Month Tier$51-100/Month Tier$101-200/Month Tier$201-500/Month Tier$500+/Month (Enterprise) Tier
Kevin Ohashi
Latest posts by Kevin Ohashi (see all)
- Analyzing Digital Ocean’s First Major Move with Cloudways - February 28, 2023
- Removing old companies - June 28, 2021
- WordPress & WooCommerce Hosting Performance Benchmarks 2021 - May 27, 2021
 WordPress & WooCommerce Hosting Performance Benchmarks 2021
 WooCommerce Hosting Performance Benchmarks 2020
 WordPress Hosting Performance Benchmarks (2020)
 The Case for Regulatory Capture at ICANN
 WordPress Hosting – Does Price Give Better Performance?
 Hostinger Review – 0 Stars for Lack of Ethics
 The Sinking of Site5 – Tracking EIG Brands Post Acquisition
 Dirty, Slimy, Shady Secrets of the Web Hosting Review (Under)World – Episode 1
 Free Web Hosting Offers for Startups