
The full company list, product list, methodology, and notes can be found here.
This post focuses only on the results of the testing in the $51-100/month price bracket for WordPress Hosting.
Contents
Other Price Tier Results
<$25/Month Tier$25-50/Month Tier$51-100/Month Tier$101-200/Month Tier$201-500/Month Tier$500+/Month (Enterprise) Tier
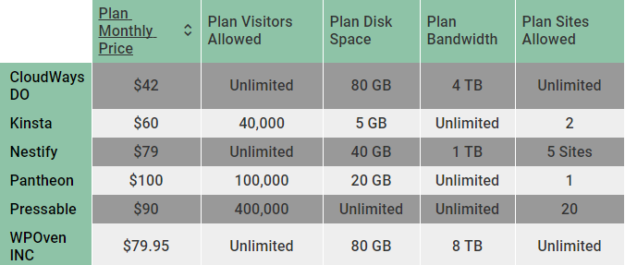
Hosting Plan Details
Click the table below to see the full product specifications sheet.
Load Storm Testing Results
This test scaled from 500 to 3000 users over 30 minutes with 10 minutes at the peak.
Results Table
| Total Requests | Total Errors | Peak RPS | Average RPS | Peak Response Time(ms) | Average Response Time (ms) | Total Data Transferred (GB) | Peak Throughput (MB/s) | Average Throughput (MB/s) | |
| CloudWays DO | 442424 | 243 | 331.95 | 245.79 | 15097 | 1131 | 30.11 | 21.79 | 16.73 |
| Kinsta | 425597 | 1 | 332.65 | 236.44 | 10017 | 377 | 30.98 | 25.62 | 17.21 |
| Nestify | 391561 | 12270 | 312.58 | 217.53 | 16016 | 1817 | 23.29 | 17.12 | 12.94 |
| Pantheon | 445581 | 37 | 336.4 | 247.54 | 15086 | 172 | 33.78 | 26.65 | 18.77 |
| Pressable | 475785 | 1112 | 371.22 | 264.32 | 10192 | 318 | 31.17 | 25.48 | 17.32 |
| WPOven INC | 438758 | 1 | 342.95 | 243.75 | 10051 | 370 | 30.96 | 25.71 | 17.2 |
Discussion
Kinsta, Pantheon [Reviews], and WPOven handled this test without issue. Pressable had nearly all errors from Tokyo again. A strange issue but a minor one.
CloudWays [Reviews] DO experienced increased response times to 1000ms.
Nestify experienced increased response times and errors.
Load Impact Testing Results
This test scaled from 1 to 2000 users over 15 minutes. Error count capped at 5,000.
Results Table
| Requests | Errors | Data Transferred (GB) | Peak Average Load Time (Seconds) | Peak Average Bandwidth (Mbps) | Peak Average Requests/Sec | |
| CloudWays DO | 457906 | 30 | 24.89 | 1.92 | 312 | 702 |
| Kinsta | 672240 | 0 | 36 | 0.416 | 583 | 1300 |
| Nestify | 223074 | 806 | 11.81 | 8.03 | 116 | 269 |
| Pantheon | 847397 | 0 | 47.26 | 0.196 | 773 | 1650 |
| Pressable | 656609 | 3 | 34.75 | 0.443 | 573 | 1260 |
| WPOven INC | 675881 | 0 | 36.07 | 0.398 | 619 | 1380 |
Discussion
Kinsta, Pantheon [Reviews], Pressable, and WPOven handled this test without issue.
CloudWays [Reviews] DO started showing signs of load with significantly increasing response times.
Nestify had a 100 Mbps network limit that was hit and caused increased response times and errors.
Uptime Monitoring Results
Results Table
| UptimeRobot | StatusCake | |
| CloudWays DO | 100 | 100 |
| Kinsta | 100 | 100 |
| Nestify | 99.9 | 99.93 |
| Pantheon | 100 | 100 |
| Pressable | 99.94 | 100 |
| WPOven INC | 99.98 | 99.97 |
Discussion
All companies kept great uptime (>=99.9%).
WebPageTest.org Results
Results Table
| WPT Dulles | WPT Denver | WPT LA | WPT London | WPT Frankfurt | WPT Rose Hill, Mauritius | |
| CloudWays DO | 0.328 | 1.101 | 1.069 | 0.718 | 0.819 | 1.86 |
| Kinsta | 0.373 | 1.163 | 0.79 | 1.104 | 1.009 | 2.446 |
| Nestify | 0.339 | 1.244 | 1.14 | 0.775 | 0.917 | 2.837 |
| Pantheon | 0.354 | 1.493 | 0.804 | 0.446 | 0.356 | 1.074 |
| Pressable | 0.479 | 1.334 | 0.879 | 0.856 | 0.923 | 2.355 |
| WPOven INC | 0.406 | 1.118 | 0.739 | 1.124 | 1.206 | 2.04 |
| WPT Singapore | WPT Mumbai | WPT Japan | WPT Sydney | WPT Brazil | |
| CloudWays DO | 2.25 | 1.646 | 1.573 | 2.068 | 1.172 |
| Kinsta | 1.729 | 2.279 | 1.183 | 1.766 | 1.364 |
| Nestify | 2.444 | 2.525 | 1.737 | 2.271 | 1.299 |
| Pantheon | 0.449 | 0.64 | 0.39 | 0.503 | 0.408 |
| Pressable | 2.224 | 1.828 | 1.733 | 1.903 | 1.375 |
| WPOven INC | 2.103 | 2.221 | 1.421 | 2.099 | 1.316 |
Discussion
There isn't a whole lot to say since this is a non-impacting metric in terms of the results. Nobody had huge issues.
I looked at the aggregate change again for the locations which were similar. There were 12 companies last year in this price bracket and only six this year. Across the nine same locations used, there was a cumulative decrease in response time of 3.14 seconds. For instance, Dulles dropped from 0.80 to 0.38 seconds on average.
WPPerformanceTester Results
Results Table
| PHP Bench | WP Bench | |
| CloudWays DO | 13.421 | 135.7036233 |
| Kinsta | 8.783 | 1173.70892 |
| Nestify | 11.8 | 136.3884343 |
| Pantheon | 9.229 | 276.2430939 |
| Pressable | 10.998 | 556.7928731 |
| WPOven INC | 9.634 | 211.1040743 |
Discussion
Kinsta had the fastest PHP bench and WP bench.
The average PHP bench went from 11.00 to 10.64 from the 2016 benchmarks in this price tier. The average WP bench went from 505 to 414. We saw the PHP bench improve slightly but the WP bench decrease a lot.
One thing to note is that WP bench scores can vary tremendously based on the database architecture. You'll often see faster scores on architectures running the database locally compared to ones that run separately or have redundancy built in.
Conclusion
Top Tier
Kinsta, Pantheon [Reviews], Pressable, and WPOven all earned Top Tier status this year for going through all the tests without any significant issues.
Honorable Mention
None.
Individual Host Analysis
CloudWays Digital Ocean
CloudWays [Reviews] DO had perfect uptime at 100%. But both load tests started to show signs of load with increased response times going into the multiple second range with a classic increased response time as load increases. I should also note this plan cost $70 when the testing occurred but Digital Ocean has reduced their pricing and this plan now costs $42.
Kinsta
Kinsta had 1 error between both load tests and 100% uptime. Nearly made that perfect score. Another Top Tier performance.
Nestify
Nestify had good uptime. But the load tests weren't kind. LoadImpact hit the same 100 Mbps limit as it did at other price tier. Load Storm seemed to cause a little too much load for the server to handle as well.
Pantheon
Pantheon [Reviews] earned top tier status again with 100% uptime and near perfect load tests.
Pressable
Pressable continued to have the weird Tokyo datacenter quirk for Load Storm. But beyond that the performance was near perfect. Another Top Tier performance.
WP Oven
Another repeat Top Tier performance from WPOven. Nobody seems to be paying attention to these guys, not sure why. Good uptime, 1 cumulative error on the load tests. Great job.
Other Price Tier Results
<$25/Month Tier$25-50/Month Tier$51-100/Month Tier$101-200/Month Tier$201-500/Month Tier$500+/Month (Enterprise) Tier
Kevin Ohashi
Latest posts by Kevin Ohashi (see all)
- Analyzing Digital Ocean’s First Major Move with Cloudways - February 28, 2023
- Removing old companies - June 28, 2021
- WordPress & WooCommerce Hosting Performance Benchmarks 2021 - May 27, 2021
 WordPress & WooCommerce Hosting Performance Benchmarks 2021
 WooCommerce Hosting Performance Benchmarks 2020
 WordPress Hosting Performance Benchmarks (2020)
 The Case for Regulatory Capture at ICANN
 WordPress Hosting – Does Price Give Better Performance?
 Hostinger Review – 0 Stars for Lack of Ethics
 The Sinking of Site5 – Tracking EIG Brands Post Acquisition
 Dirty, Slimy, Shady Secrets of the Web Hosting Review (Under)World – Episode 1
 Free Web Hosting Offers for Startups