The full company list, product list, methodology, and notes can be found here.
This post focuses only on the results of the testing in the Enterprise price bracket for WordPress Hosting.
Contents
Other Price Tier Results
<$25/Month Tier$25-50/Month Tier$51-100/Month Tier$101-200/Month Tier$201-500/Month Tier$500+/Month (Enterprise) Tier
Enterprise Hosting Introduction
The Enterprise testing this year had some fundamental differences from all the other price tiers that needs to be disclosed. These are complex and expensive systems that are normally customized on a per-customer basis by hosting companies. They all offer a much more hands on experience than hosting plans at the other end of the spectrum and charge accordingly. For that reason, the testing criteria are slightly different for the Enterprise tier.
The first change is there is no default setup, which is what I test in every other price tier. The companies were given explicit permission to customize their platform and knew what tests were coming their way. If the plans didn't perform as well as expected, their teams were allowed to optimize the configuration to attempt to improve performance. This is what I would expect from plans charging hundreds, if not thousands of dollars per month for large sites. So I wanted to let them perform their normal services for this tier.
The second major change is all sites were forced to use SSL (HTTPS) while every other plan tested in other price tiers were HTTP (the exception being Liquid Web which didn't want to disable SSL).
The third change is there is an additional test, an SSL test which was another non impacting metric.
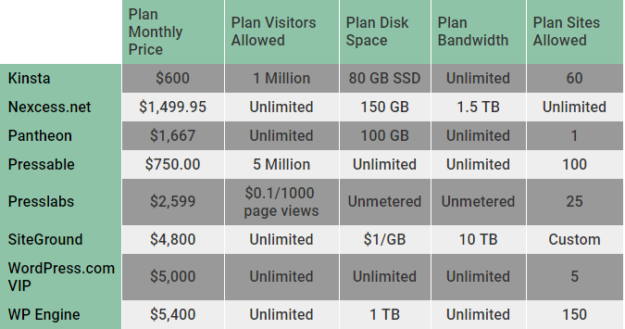
Hosting Plan Details
Click the table below to see the full product specifications sheet.
Load Storm Testing Results
This test scaled from 500 to 10,000 users over 30 minutes with 10 minutes at the peak.
Results Table
| Total Requests | Total Errors | Peak RPS | Average RPS | Peak Response Time(ms) | Average Response Time (ms) | Total Data Transferred (GB) | Peak Throughput (MB/s) | Average Throughput (MB/s) | |
| Kinsta | 1720465 | 0 | 1391.42 | 955.81 | 3906 | 417 | 112.7 | 91.9 | 62.61 |
| Nexcess.net | 1309520 | 14415 | 1036.43 | 727.51 | 10753 | 593 | 94.5 | 75.91 | 52.5 |
| Pantheon | 1370325 | 88 | 1088.48 | 761.29 | 7147 | 154 | 106.71 | 85.72 | 59.28 |
| Pressable | 1480277 | 1901 | 1180.13 | 822.38 | 10719 | 484 | 102.15 | 81.81 | 56.75 |
| Presslabs | 2012822 | 56 | 1576.23 | 1118.23 | 10099 | 208 | 116.54 | 90.85 | 64.75 |
| SiteGround | 1443091 | 15 | 1151.4 | 801.72 | 15086 | 209 | 105.15 | 84.68 | 58.42 |
| WordPress.com VIP | 1749966 | 3 | 1400.53 | 972.2 | 7484 | 108 | 147.94 | 118.68 | 82.19 |
| WP Engine | 1914457 | 786 | 1564.62 | 1063.59 | 11541 | 509 | 115.54 | 95.23 | 64.19 |
Discussion
Kinsta, Pantheon [Reviews], PressLabs, SiteGround [Reviews], WordPress.com VIP and WPEngine [Reviews] all handled this test without issue. Pressable had the same Tokyo issue but otherwise was just fine.
Nexcess struggled slightly towards the end of the test mainly with the login portion which bursts the cache and likely the heaviest page to load during the test.
Load Impact Testing Results
This test scaled from 1 to 5000 users over 15 minutes. Error count capped at 5,000.
Results Table
| Requests | Errors | Data Transferred (GB) | Peak Average Load Time (Seconds) | Peak Average Bandwidth (Mbps) | Peak Average Requests/Sec | |
| Kinsta | 1367747 | 0 | 73.4 | 0.802 | 1120 | 2540 |
| Nexcess.net | 1183677 | 5000 | 46.19 | 1.51 | 624 | 2210 |
| Pantheon | 2046874 | 0 | 113.47 | 0.181 | 1660 | 3650 |
| Pressable | 1389420 | 0 | 77.63 | 0.773 | 1150 | 2520 |
| Presslabs | 1991403 | 0 | 104.96 | 0.184 | 1980 | 4580 |
| SiteGround | 1627518 | 7 | 87.96 | 0.618 | 1370 | 3100 |
| WordPress.com VIP | 2085775 | 6 | 119.88 | 0.102 | 1860 | 3960 |
| WP Engine | 1461819 | 0 | 78 | 0.665 | 1210 | 2780 |
Discussion
Kinsta, Pantheon [Reviews], Pressable, PressLabs, SiteGround [Reviews], WordPress.com VIP and WPEngine [Reviews] handled this test without issue.
Nexcess struggled towards the end of this test showing increased response times and errors.
Uptime Monitoring Results
Results Table
| UptimeRobot | StatusCake | |
| Kinsta | 100 | 100 |
| Nexcess.net | 99.99 | 99.93 |
| Pantheon | 100 | 100 |
| Pressable | 99.98 | 99.99 |
| Presslabs | 100 | 100 |
| SiteGround | 99.96 | 100 |
| WordPress.com VIP | 99.95 | 100 |
| WP Engine | 99.95 | 99.96 |
Discussion
Overall, at the Enterprise level nobody struggled keeping the servers online. I would be shocked if that wasn't the case considering the cost and architecture of these systems.
WebPageTest.org Results
Results Table
| WPT Dulles | WPT Denver | WPT LA | WPT London | WPT Frankfurt | WPT Rose Hill, Mauritius | |
| Kinsta | 0.382 | 1.245 | 1.154 | 1.331 | 1.103 | 2.444 |
| Nexcess.net | 0.533 | 1.494 | 1.581 | 1.403 | 1.537 | 4.01 |
| Pantheon | 0.374 | 1.322 | 0.712 | 0.474 | 0.428 | 0.912 |
| Pressable | 0.563 | 2.261 | 1.304 | 1.161 | 1.334 | 3.823 |
| Presslabs | 0.378 | 1.352 | 0.85 | 0.49 | 0.381 | 1.335 |
| SiteGround | 0.812 | 1.342 | 1.06 | 0.998 | 0.999 | 2.636 |
| WordPress.com VIP | 0.334 | 1.112 | 0.649 | 0.444 | 0.353 | 0.874 |
| WP Engine | 0.436 | 1.155 | 0.948 | 1.155 | 1 | 2.109 |
| WPT Singapore | WPT Mumbai | WPT Japan | WPT Sydney | WPT Brazil | |
| Kinsta | 1.774 | 2.108 | 1.281 | 1.611 | 1.404 |
| Nexcess.net | 3.394 | 4.38 | 2.436 | 3.595 | 2.343 |
| Pantheon | 0.426 | 0.522 | 0.366 | 0.497 | 0.384 |
| Pressable | 3.068 | 2.447 | 2.106 | 2.771 | 1.897 |
| Presslabs | 0.485 | 0.721 | 0.66 | 0.551 | 1.336 |
| SiteGround | 1.908 | 2.109 | 1.394 | 1.588 | 1.187 |
| WordPress.com VIP | 0.395 | 0.544 | 0.358 | 0.506 | 0.363 |
| WP Engine | 1.536 | 1.891 | 1.062 | 1.428 | 1.238 |
Discussion
There isn't a whole lot to say since this is a non-impacting metric in terms of the results. Nobody had huge issues.
I looked at the aggregate change again for the locations which were similar. There were 7 companies last year in this price bracket and we moved up to 8 this year. Across the nine same locations used, there was a cumulative decrease in response time of 3.58 seconds. For instance, Dulles dropped from 0.86 to 0.47 seconds on average.
I also thought it could be interesting to see what the average response time around the world was by company.
|
Average WPT Response Time
|
|
| Kinsta | 1.44 |
| Nexcess.net | 2.43 |
| Pantheon | 0.58 |
| Pressable | 2.07 |
| Presslabs | 0.78 |
| SiteGround | 1.46 |
| WordPress.com VIP | 0.54 |
| WP Engine | 1.27 |
Pantheon and WordPress.com VIP seem to have the fastest delivery around the world with Presslabs following close behind.
WPPerformanceTester Results
Results Table
| PHP Bench | WP Bench | |
| Kinsta | 8.787 | 1207.729469 |
| Nexcess.net | 11.687 | 450.0450045 |
| Pantheon | 8.708 | 235.9046945 |
| Pressable | 10.924 | 529.1005291 |
| Presslabs | 7.215 | 823.0452675 |
| SiteGround | 10.457 | 196.61816751868 |
| WordPress.com VIP | 9.18 | 798.084597 |
| WP Engine | 10.766 | 418.4100418 |
Discussion
Presslabs had the fastest PHP bench and Kinsta had the fastest WP bench.
The average PHP bench went from 9.86 to 9.72 from the 2016 benchmarks in this price tier. The average WP bench went from 383 to 582. The PHP and WP bench both improved for this price tier, with the WP bench getting significantly faster.
WP Bench Historical Performance
| 2016 | 2018 | % Change | |
| Kinsta | 320 | 1208 | 376 |
| Pantheon | 216 | 236 | 9 |
| Pressable | 491 | 529 | 8 |
| WordPress.com VIP | 500 | 798 | 60 |
| WP Engine | 533 | 418 | -22 |
One thing to note is that WP bench scores can vary tremendously based on the database architecture. You'll often see faster scores on architectures running the database locally compared to ones that run separately or have redundancy built in.
Qualsys SSL Report Grade
The tool is available at https://www.ssllabs.com/ssltest/
Results Table
| Company | Qualsys SSL Report Grade |
| Kinsta | A |
| Nexcess.net | A |
| Pantheon | A |
| Pressable | A |
| Presslabs | A+ |
| SiteGround | A |
| WordPress.com VIP | A |
| WP Engine | A |
Discussion
There's very little to say here. Presslabs stands out because they earned an A+ but everyone else was an A.
Conclusion
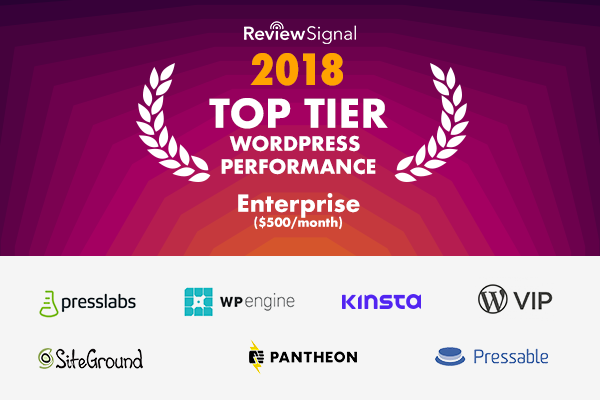
Top Tier
Kinsta, Pantheon [Reviews], Pressable, PressLabs, SiteGround [Reviews], WordPress.com VIP, and WPEngine [Reviews] all earned Top Tier status this year for going through all the tests without any significant issues.
Honorable Mention
None.
Individual Host Analysis
Kinsta
Kinsta had a perfect run at the Enterprise tier. This is why people shell out top dollar for Enterprise level hosting. Kinsta had perfect 100% uptime on both monitors. They also had 0 errors on both load tests and the lowest peak response time on the Load Storm test. A Top Tier Performance was rightly earned.
Nexcess
Nexcess had good uptime. The load tests were just out of the good range though. Load Impact started to show signs of load towards the end with increased response times and errors. Load Storm looked quite stable except it started to error out towards the end despite keeping a flat average response time. I'm sure they will be back next year with improved performance though watching how hard they were working to improve their entire WordPress stack throughout this testing. I'm glad to see another company jumping in at the Enterprise tier.
Pantheon
Pantheon [Reviews] had another near perfect run with 100% uptime on both monitors. A perfect Load Impact test with no errors. Just a handful of errors on the Load Storm test. Pantheon also consistently had some of the fastest delivery around the world in the WebPageTest tests at the Enterprise and lower price tiers. A Top Tier award was well deserved for Pantheon this year.
Pressable
Pressable. Great uptime. Great Load Impact test. Again the weird Tokyo data center issue with Load Storm. It didn't impact it much though and Pressable earns another Top Tier award in the Enterprise category.
Presslabs
A regular in our testing, this is the first year PressLabs jumped up to compete in the Enterprise tier. And they did fantastic. 100% uptime. Almost no errors on Load Storm and a perfect Load Impact test. They even had the best rating on their SSL certificate. Great to see Presslabs jump up to play with the biggest boys and earn a Top Tier performance award.
SiteGround
SiteGround [Reviews] is another regular in our testing, generally in the lowest price tiers, for the first time jumped into the Enterprise category. They've historically done pretty well earning many Top Tier and honorable mentions over the years. The Enterprise tier didn't disappoint. SiteGround had good uptime and a measly 22 errors from the Load Storm and Load Impact tests combined. Another Top Tier performance for SiteGround in a new price tier, great to have them stepping up their offerings and delivering.
WordPress.com VIP
WordPress.com VIP. Maybe the biggest name in the Enterprise WordPress space, they've participated for the second consecutive year in the Enterprise category. They had good uptime and a total of 9 cumulative errors between the Load Storm and Load Impact tests. Their underlying infrastructure seems to have improved substantially from last year according to the WP bench which tests database performance. It was already top notch, but they apparently aren't slacking under the hood either. They also were delivering content the fastest on average around the world in the WebPageTest tests. Another Top Tier Performance award easily earned for WordPress.com VIP.
WP Engine
After a disappointing result last year in the Enterprise category, WPEngine [Reviews] came back with a vengeance. They submitted the most expensive plan in the category and their performance lived up to expectations. They had good uptime. They had minimal errors on the Load Impact and Load Storm tests. They earned Top Tier status this year, it's nice to see WP Engine can deliver at the Enterprise level.
Other Price Tier Results
<$25/Month Tier$25-50/Month Tier$51-100/Month Tier$101-200/Month Tier$201-500/Month Tier$500+/Month (Enterprise) Tier
Kevin Ohashi
Latest posts by Kevin Ohashi (see all)
- Analyzing Digital Ocean’s First Major Move with Cloudways - February 28, 2023
- Removing old companies - June 28, 2021
- WordPress & WooCommerce Hosting Performance Benchmarks 2021 - May 27, 2021
 WordPress & WooCommerce Hosting Performance Benchmarks 2021
 WooCommerce Hosting Performance Benchmarks 2020
 WordPress Hosting Performance Benchmarks (2020)
 The Case for Regulatory Capture at ICANN
 WordPress Hosting – Does Price Give Better Performance?
 Hostinger Review – 0 Stars for Lack of Ethics
 The Sinking of Site5 – Tracking EIG Brands Post Acquisition
 Dirty, Slimy, Shady Secrets of the Web Hosting Review (Under)World – Episode 1
 Free Web Hosting Offers for Startups
Looking at the Requests table, if you compare requests vs bandwidth, it’s obvious that the page sizes were different with each provider. Do you know what accounts for the difference in request size?
While the sites I put up were the same, different providers may or may not add plugins (eg jetpack). Also compression techniques can vary dramatically (higher compression generally costs more CPU).
Great resource, I am getting a lot out of it. I have looked at it a few times now.
One question, with the WebPageTest.org Results section, what does the figure you report relate to exactly, is it WebPageSpeedTests “First Byte” result?
Load Time, not TTFB.
It looks like any of the options are suitable. However, Kinsta seems to win considerably in terms of value. Given someone is looking for a plan that satisfies Kinsta’s their specs / features, would there be any reason not to go with them?