The full company list, product list, methodology, and notes can be found here.
This post focuses only on the results of the testing in the <$25/month price bracket for WordPress Hosting.
Contents
Other Price Tier Results
<$25/Month Tier$25-50/Month Tier$51-100/Month Tier$101-200/Month Tier$201-500/Month Tier$500+/Month (Enterprise) Tier
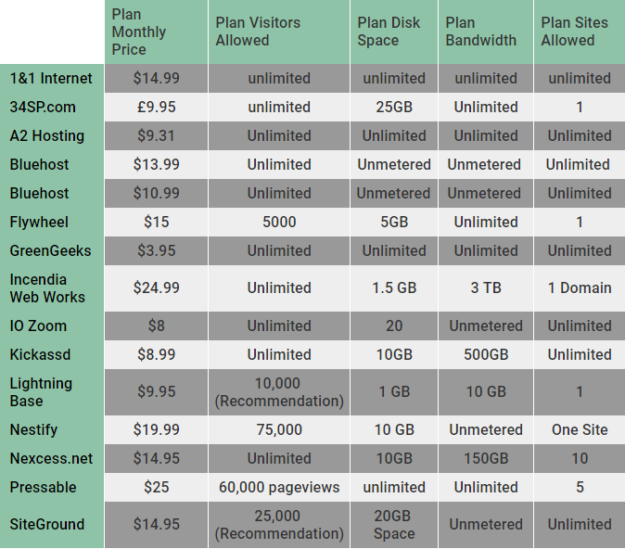
Hosting Plan Details
Click the table below to see the full product specifications sheet.
Load Storm Testing Results
This test scaled from 500 to 2000 users over 30 minutes with 10 minutes at the peak.
Results Table
| Total Requests | Total Errors | Peak RPS | Average RPS | Peak Response Time (ms) | Average Response Time (ms) | Total Data Transferred (GB) | Peak Throughput (MB/s) | Average Throughput (MB/s) | |
| 1&1 Internet | 296744 | 21024 | 231.12 | 164.86 | 16366 | 591 | 20.3 | 17.14 | 11.28 |
| 34SP.com | 300603 | 43631 | 89.77 | 58.92 | 15425 | 1730 | 3.13 | 2.49 | 1.74 |
| A2 Hosting | 372156 | 820 | 285.55 | 206.75 | 9002 | 657 | 23.51 | 18.59 | 13.06 |
| Bluehost Cloud | 290183 | 96207 | 249.07 | 161.21 | 15091 | 1553 | 12.47 | 14.74 | 6.93 |
| Bluehost Shared | 293146 | 143830 | 245.68 | 162.86 | 15263 | 1507 | 10 | 11.86 | 5.56 |
| FlyWheel | 249249 | 77140 | 189.82 | 138.47 | 15623 | 2415 | 11.81 | 10.25 | 6.56 |
| GreenGeeks | 348819 | 20 | 266.48 | 193.79 | 4708 | 314 | 24.49 | 19.89 | 13.61 |
| Incendia Web Works | 294518 | 0 | 222.42 | 163.62 | 4070 | 348 | 21.29 | 17.14 | 11.83 |
| IO Zoom | 326189 | 44784 | 269.7 | 181.22 | 15705 | 1351 | 15.13 | 14.33 | 8.41 |
| Kickassd | 189570 | 65553 | 144.65 | 105.32 | 18418 | 6184 | 9.02 | 12.6 | 5.01 |
| Lightning Base | 449766 | 93 | 365.18 | 249.87 | 15096 | 419 | 25.38 | 21.35 | 14.1 |
| Nestify | 230774 | 5 | 211.47 | 128.21 | 15100 | 1960 | 13.79 | 9.95 | 7.66 |
| Nexcess.net | 278151 | 438 | 211.47 | 154.53 | 15578 | 980 | 20.18 | 15.02 | 11.21 |
| Pressable | 330412 | 487 | 249.85 | 183.56 | 10102 | 268 | 21.65 | 17.38 | 12.03 |
| SiteGround | 316826 | 14 | 242.02 | 176.01 | 5361 | 445 | 21.18 | 16.98 | 11.76 |
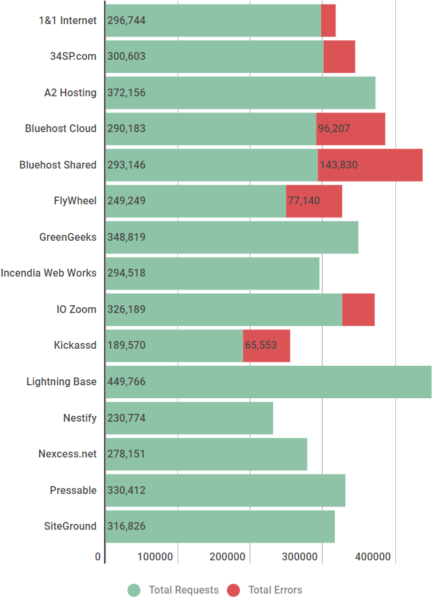
Discussion
GreenGeeks, Incendia Web Works, LightningBase, and SiteGround [Reviews] all handled this test without issue. A2 Hosting [Reviews], Nexcess and Pressable had some minor issues. A2 Hosting and Nexcess had a couple minor spikes. Pressable had a weird issue with the Tokyo data center for Load Storm which occurred every time on different plans tested. Nestify is interesting because they never failed but definitely started slowing down under load but their server stayed up and errored the second fewest times of any plan.
1&1 [Reviews] Internet seemed to be running into a security related issue - they weren't able to turn off their DDoS proxy for a single site. They kept a relatively constant response time and error rate. Overall it looked pretty decent while having the security issue.
BlueHost [Reviews] Cloud and Shared both ran into security issues we couldn't work to bypass. They were perhaps the most bizarre graphs I have seen during all my years of testing. Hard to say much based on them.
34SP.com, FlyWheel [Reviews], IOZoom, and Kickassd struggled with this test; they showed errors and increased response times.
Load Impact Testing Results
This test scaled from 1 to 1000 users over 15 minutes. Error count capped at 5,000.
Results Table
| Requests | Errors | Data Transferred (GB) | Peak Average Load Time (Seconds) | Peak Average Bandwidth (Mbps) | Peak Average Requests/Sec | |
| 1&1 Internet | 173410 | 5000 | 4.68 | 2.19 | 48 | 322 |
| 34SP.com | 309130 | 5000 | 6.64 | 1.03 | 67 | 532 |
| A2 Hosting | 333786 | 0 | 17.64 | 0.481 | 293.4 | 677 |
| Bluehost Cloud | 78659 | 5000 | 1.98 | 8.31 | 25.9 | 126 |
| Bluehost Shared | 82052 | 5000 | 1.97 | 8.08 | 25.2 | 138 |
| FlyWheel | 111199 | 467 | 5.83 | 7.25 | 57.1 | 137 |
| GreenGeeks | 310129 | 90 | 16.11 | 0.886 | 220.6 | 518 |
| Incendia Web Works | 339517 | 0 | 17.06 | 0.414 | 253.9 | 617 |
| IO Zoom | 303212 | 0 | 16.39 | 0.905 | 223.1 | 504 |
| Kickassd | 338072 | 0 | 18.04 | 0.424 | 289 | 660 |
| Lightning Base | 339672 | 0 | 18.26 | 0.412 | 300.6 | 682 |
| Nestify | 192838 | 181 | 10.25 | 3.09 | 113.8 | 262 |
| Nexcess.net | 320321 | 0 | 17.21 | 0.671 | 263 | 597 |
| Pressable | 326903 | 21 | 17.73 | 0.486 | 482.1 | 1060 |
| SiteGround | 318163 | 4 | 16.97 | 0.556 | 264 | 605 |
Discussion
A2 Hosting [Reviews], Incendia Web Works, Kickassd, LightningBase, Pressable, and SiteGround [Reviews] handled this test without issue.
GreenGeeks had a bit of a spike and started to increase in response time towards the end of the test.
IOZoom started to lag slightly towards the end of the test doubling in response time but didn't error once.
Nexcess started to show a little load towards the end but managed to not error at all and stayed below 800ms response time.
1&1 [Reviews], 34SP.com, BlueHost [Reviews] Cloud/Shared, FlyWheel [Reviews], and Nestify struggled with this test; they showed errors and increased response times.
Uptime Monitoring Results
Results Table
| UptimeRobot | StatusCake | |
| 1&1 Internet | 99.98 | 99.97 |
| 34SP.com | 99.98 | 99.96 |
| A2 Hosting | 99.95 | 98.86 |
| Bluehost Cloud | 99.97 | 99.97 |
| Bluehost Shared | 99.98 | 99.94 |
| FlyWheel | 100 | 100 |
| GreenGeeks | 99.98 | 99.97 |
| Incendia Web Works | 99.99 | 99.97 |
| IO Zoom | 95.18 | 95.39 |
| Kickassd | 100 | 100 |
| Lightning Base | 100 | 100 |
| Nestify | 99.83 | 99.92 |
| Nexcess.net | 100 | 99.72 |
| Pressable | 99.99 | 99.99 |
| SiteGround | 99.99 | 99.99 |
Discussion
Most companies maintained above the 99.9% threshold on both uptime monitors.
A2 Hosting had some issues with UptimeRobot showing 99.95% and StatusCake 98.96%.
IO Zoom had a major downtime issue with UptimeRobot showing 95.18% and StatusCake 95.39%. What happened was a server upgrade and my account wasn't upgraded to a new PHP handler. Beyond that event was fine, but that caused the low numbers being reported.
Nestify had some issues with UptimeRobot showing 99.83% and StatusCake 99.92%.
Nexcess had a strange phenomena where UptimeRobot recorded 100% and StatusCake showed 99.72%. StatusCake showed multiple relatively short downtimes across two days in August which were the cause of this low number. UptimeRobot which was checking far more frequently didn't experience any of these issues, so I suspect it might have been issue more with StatusCake being able to connect than Nexcess being actually down.
WebPageTest.org Results
Results Table
| WPT Dulles | WPT Denver | WPT LA | WPT London | WPT Frankfurt | WPT Mauritius | |
| 1&1 Internet | 0.595 | 1.306 | 1.066 | 1.366 | 1.483 | 3.033 |
| 34SP.com | 0.814 | 1.636 | 1.651 | 0.442 | 0.455 | 2.059 |
| A2 Hosting | 0.398 | 1.091 | 1.172 | 1.558 | 1.291 | 2.78 |
| Bluehost Cloud | 0.525 | 1.466 | 1.389 | 1.271 | 1.32 | 2.38 |
| Bluehost Shared | 0.605 | 1.45 | 0.924 | 1.697 | 2.552 | 3.493 |
| FlyWheel | 0.348 | 1.149 | 1.193 | 0.746 | 0.827 | 1.866 |
| GreenGeeks | 0.356 | 1.043 | 0.829 | 0.841 | 1.18 | 1.993 |
| Incendia Web Works | 0.366 | 1.21 | 1.094 | 0.791 | 0.894 | 1.988 |
| IO Zoom | 0.607 | 1.207 | 0.695 | 1.365 | 1.51 | 2.217 |
| Kickassd | 0.35 | 1.503 | 1.449 | 0.818 | 0.919 | 2.642 |
| Lightning Base | 0.429 | 1.212 | 0.843 | 1.169 | 1.091 | 2.435 |
| Nestify | 0.347 | 1.186 | 1.211 | 0.801 | 1.02 | 3.86 |
| Nexcess.net | 0.401 | 1.342 | 1.163 | 0.983 | 1.197 | 2.796 |
| Pressable | 0.468 | 1.366 | 1.008 | 0.862 | 0.947 | 2.347 |
| SiteGround | 0.432 | 1.489 | 0.909 | 0.937 | 1.087 | 1.945 |
| WPT Singapore | WPT Mumbai | WPT Japan | WPT Sydney | WPT Brazil | |
| 1&1 Internet | 2.553 | 2.971 | 1.783 | 2.514 | 1.597 |
| 34SP.com | 1.634 | 2.339 | 2.1 | 3.177 | 2.22 |
| A2 Hosting | 2.52 | 3.407 | 1.77 | 2.824 | 1.796 |
| Bluehost Cloud | 2.484 | 2.527 | 1.746 | 2.152 | 1.706 |
| Bluehost Shared | 1.845 | 2.341 | 1.364 | 1.608 | 1.756 |
| FlyWheel | 2.085 | 1.811 | 1.75 | 2.091 | 1.266 |
| GreenGeeks | 2.228 | 2.422 | 1.699 | 1.932 | 1.395 |
| Incendia Web Works | 2.243 | 2.432 | 1.713 | 2.081 | 1.207 |
| IO Zoom | 1.847 | 2.478 | 1.11 | 1.375 | 1.786 |
| Kickassd | 2.967 | 1.92 | 1.733 | 2.398 | 1.375 |
| Lightning Base | 1.863 | 2.33 | 1.292 | 1.762 | 1.511 |
| Nestify | 3.634 | 3.036 | 3.244 | 2.666 | 2.317 |
| Nexcess.net | 2.402 | 2.82 | 1.608 | 2.425 | 1.498 |
| Pressable | 2.436 | 2.59 | 1.698 | 1.923 | 1.389 |
| SiteGround | 2.088 | 1.957 | 1.617 | 1.781 | 1.392 |
Discussion
There isn't a whole lot to say since this is a non-impacting metric in terms of the results. Nobody had huge issues.
One interesting thing I compared was the average response time from 2016's benchmarks in the 9 locations that were the same. The best average improvements were Dulles going from an average of .809 to .503 and Frankfurt going from 1.698 to 1.270. The worst change was LA by a wide margin going from 0.72 to 1.404. In aggregate 2018's results were 0.471 seconds slower on the same 9 locations as 2016. Could just be the testing location that day. I don't use these as an impacting measure for a reason.
WPPerformanceTester Results
Results Table
| PHP Bench | WP Bench | |
| 1&1 Internet | 10.069 | 574.7126437 |
| 34SP.com | 10.995 | 510.4645227 |
| A2 Hosting | 11.246 | 560.5381166 |
| Bluehost Cloud | 10.411 | 1043.841336 |
| Bluehost Shared | 10.854 | 960.6147935 |
| FlyWheel | 9.731 | 554.9389567 |
| GreenGeeks | 10.946 | 1312.335958 |
| Incendia Web Works | 6.63 | 749.6251874 |
| IO Zoom | 12.916 | 761.0350076 |
| Kickassd | 10.721 | 1477.104874 |
| Lightning Base | 8.678 | 1388.888889 |
| Nestify | 11.284 | 181.356547 |
| Nexcess.net | 12.094 | 484.496124 |
| Pressable | 10.87 | 562.7462015 |
| SiteGround | 10.49 | 1157.407407 |
Discussion
Incendia Web Works led the way with the fastest PHP Bench score. Kickassd had the fastest WP Bench.
Compared in aggregate to 2016's results we see on average we are seeing higher speeds. 2016 had an average PHP Bench of 11.573 while this year had an average of 11.281. WP Bench had an average of 684 in 2016 and this year had of 877.
One thing to note is that WP bench scores can vary tremendously based on the database architecture. You'll often see faster scores on architectures running the database locally compared to ones that run separately or have redundancy built in.
Conclusion
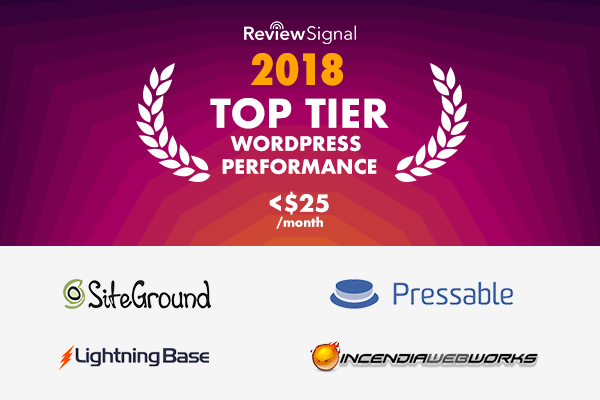
Top Tier
Incendia Web Works, LightningBase, Pressable and SiteGround [Reviews] all earned Top Tier status this year for going through all the tests without any issues.
Honorable Mention
A2 Hosting [Reviews], Green Geeks and Nexcess earned honorable mention status.
A2 Hosting [Reviews] had a borderline uptime performance that kept it out of the top tier. Green Geeks had some response time issues on the Load Impact test where it started to slow down. Nexcess had a strange uptime monitor and was borderline on the load tests but never errored out.
Individual Host Analysis
1&1 Internet
1&1 [Reviews] was a new participant this year and they were interesting. While they didn't win any awards, their tests were having issues because of a DDoS proxy they couldn't turn off on an account specific level. I wish we could have gotten a clean test through to see how they really stacked up. 1&1 kept a solid uptime above 99.97%
34SP
34SP.com was another new participant; based in the UK. They were by far the fastest to connect to London and Frankfurt on WebPageTest which is nice to see. On the load testing front 34SP just couldn't quite handle the stress of so many visitors. They did manage to keep a good uptime during tests though with above 99.96%.
A2 Hosting
A2 Hosting [Reviews] earned an honorable mention this year. Their performance was quite good but there were a few issues. Their uptime was borderline with one monitor showing below 99.9% but the average of the two monitors above 99.9%. The LoadStorm test had a minor spike issue but nothing serious. LoadImpact was good with no errors. It was a huge improvement over last year where they failed the load tests. Nice to see such a big improvement.
BlueHost Cloud + BlueHost Shared
BlueHost [Reviews] were grouped together because I was hoping to see a meaningful difference in performance between the different offerings but it really wasn't very clear that either offering was the obvious better choice. The Shared plan outperformed in LoadImpact while Cloud outperformed in Load Storm. They had similar uptimes, both averaging 99.97%, which was perhaps the highlight of their results. We were unable to work around some security measures in their network and get clean tests through. It led to some of the strangest looking LoadStorm tests I've ever seen.
FlyWheel
FlyWheel [Reviews] while still maintaining the best score on our review site at 81% at the time of writing, continues to underperform on the performance tests. It's just a reminder that peak performance isn't everything for everyone. They didn't do well in either load test but managed a perfect 100% uptime on both monitors.
GreenGeeks
GreenGeeks is another new entrant who put up a stellar first performance earning themselves an honorable mention. The only test they had a little bit of issue with is the Load Impact test where they had a spike and started to show a bit of increased response times towards the end. Very happy to have another strong offering in the mix for people to choose from.
Incendia Web Works
Incendia Web Works had some uptime issues last year which marred their results. This year no such thing happened. IWW continued to have great load testing results and earned itself Top Tier status. They had flawless load test results being the only company with 0 errors on both LoadStorm and LoadImpact. It's nice to see companies improve their consistency and earn a higher ranking.
IO Zoom
IOZoom was another new entrant this year. The uptime issue was really unfortunate and in the future I hope their upgrade process is now better equipped to make sure things like that don't happen. They had a good Load Impact test with just some minor increase in response times. Unfortunately IO Zoom did poorly on the LoadStorm test. These tests are difficult and companies sometimes take years to manage them, I hope IO Zoom comes back next year swinging with better results.
Kickassd
Kickassd was yet another new entrant who impressed in some tests. Kickassd had perfect uptime at 100%. They also had a perfect LoadImpact test with a flat response time and zero errors. Unfortunately, the Load Storm test was a bit much for the server and it didn't do as well. Overall, really impressed with a new entrant who can manage do well on a lot of the tests. I also know a lot of improvements were deployed customer wide because of the testing. Next year I hope to see those improvements earn Kickassd an award.
Lightning Base
LightningBase. Another year, another near perfect run. 100% uptime. Great load tests. This is the 4th year in a row LightningBase has earned top tier recognition. It seems almost expected at this point.
Nestify
Nestify was a new entrant this year. Their LoadStorm test was a decent start. It definitely started to slow down, but they had the second fewest errors of any company. Their Load Impact test went similarly, increased response times with some errors but not an overwhelming number. Nestify's uptime left something to be desired with an average below 99.9%. This was caused by a block storage maintenance/failure at Vultr according to them. During testing we realized one of the potentially limiting factors was the 100Mbps connection to the server being saturated during the load tests. There are the makings of a very solid competitor if they can figure out a few issues.
Nexcess.net
Nexcess returned to the tests this year after not participating last year. They brought in the person responsible for A Small Orange's WordPress stack that did so well in early versions of these benchmarks. This resulted in Nexcess earning an honorable mention status. Their results were pretty good in all the meaningful tests. Their uptime was a bit strange with one showing 100% and the other 99.72%. The LoadStorm test had a couple spikes but nothing major. LoadImpact had some increased response time but stayed under 800ms which is quite good. Glad to see their return and they're making at mark at the entry level.
Pressable
99.9% was Pressable's uptime and pretty much sums up their results as a whole. Another Top Tier award for Pressable. The only strange issue which consistently happened on all their plans is a weird issue with LoadStorm's Tokyo data center having some errors. It really didn't have much impact with an error rate at 0.15%. Another great year for Pressable.
SiteGround
Another Top Tier award for SiteGround [Reviews]. They had the second fewest cumulative errors at 18 for Load Storm and Load Impact tests (14+4) respectively. Combined with a 99.99% uptime, they continue to look great.
Other Price Tier Results
<$25/Month Tier$25-50/Month Tier$51-100/Month Tier$101-200/Month Tier$201-500/Month Tier$500+/Month (Enterprise) Tier
Kevin Ohashi
Latest posts by Kevin Ohashi (see all)
- Analyzing Digital Ocean’s First Major Move with Cloudways - February 28, 2023
- Removing old companies - June 28, 2021
- WordPress & WooCommerce Hosting Performance Benchmarks 2021 - May 27, 2021
 WordPress & WooCommerce Hosting Performance Benchmarks 2021
 WooCommerce Hosting Performance Benchmarks 2020
 WordPress Hosting Performance Benchmarks (2020)
 The Case for Regulatory Capture at ICANN
 WordPress Hosting – Does Price Give Better Performance?
 Hostinger Review – 0 Stars for Lack of Ethics
 The Sinking of Site5 – Tracking EIG Brands Post Acquisition
 Dirty, Slimy, Shady Secrets of the Web Hosting Review (Under)World – Episode 1
 Free Web Hosting Offers for Startups