Author Archives: Kevin Ohashi

avatar

About Kevin Ohashi

Kevin Ohashi is the geek-in-charge at Review Signal. He is passionate about making data meaningful for consumers. Kevin is based in Washington, DC.

Pantheon Review (2018)

Pantheon participated for the fourth time in our WordPress Hosting Performance Benchmarks (2018). Last year Pantheon earned two Top Tier awards. This review is based off the results of this years test.

Pantheon stepped up their game this year and earned three Top Tier awards and one honorable mention. Pantheon also has the honor of being the highest rated company on Review Signal for reviews based on customer opinions (84%).

The Products

Plan Name Plan Monthly Price Plan Visitors Allowed Plan Memory/RAM Plan Disk Space Plan Bandwidth
Plan Sites Allowed
Personal Plan $25 10,000 (with no overage charges) 1024MB 5GB Unlimited 1
Professional $100 100,000 2048 20GB Unlimited 1
Business $400 500,000 8192 30GB Unlimited 1
Elite $1,667 Unlimited Unlimited 100GB+ Unlimited 1

Performance Review

Load Storm

Plan Tier Total Requests Total Errors Peak RPS Average RPS Peak Response Time(ms) Average Response Time (ms) Total Data Transferred (GB) Peak Throughput (MB/s) Average Throughput (MB/s)
$25-50 292,393 5 220.72 162.44 4,287 162 22.79 17.5 12.66
$51-100 445,581 37 336.4 247.54 15,086 172 33.78 26.65 18.77
$200-$500 702,823 7,065 544.27 390.46 11,462 455 52.65 43.64 29.25
Enterprise 1,370,325 88 1,088.48 761.29 7,147 154 106.71 85.72 59.28

The Load Storm test is designed to simulate real users coming to the site, logging in and browsing the site bursting some of the caching mechanisms typically found on managed WordPress hosts.

Pantheon overall did very well. The only issue was in the $200-500 price range it started to show signs of load. It wasn't a huge issue and the plan still earned an honorable mention in the price tier.

Load Impact

Plan Tier Requests Errors Data Transferred (GB) Peak Average Load Time (Seconds) Peak Average Bandwidth (Mbps)
Peak Average Requests/Sec
$25-50 426896 0 23.73 0.159 401 880
$51-100 847397 0 47.26 0.196 773 1650
$200-$500 1257940 0 69.92 0.173 1020 2240
Enterprise 2046874 0 113.47 0.181 1660 3650

The Load Impact test makes sure static caching is effective so that if a page gets a lot of traffic the site will keep responding without issue.

Pantheon aced the LoadImpact tests across every price tier. Zero errors on all four tests and maintained a sub 200 millisecond response time average. Couldn't ask for a better performance.

Uptime

Plan Tier UptimeRobot StatusCake
$25-50 100 100
$51-100 100 100
$200-$500 99.97 100
Enterprise 100 100

Not a whole lot to say here other than excellent. 100% uptime across the board except one monitor out of two showing 99.97%.

WebPageTest / WPPerformanceTester

Plan Tier $25-50 $51-100 $200-$500 Enterprise
Dulles 0.355 0.354 0.353 0.374
Denver 1.57 1.493 1.236 1.322
LA 0.797 0.804 0.804 0.712
London 0.448 0.446 0.45 0.474
Frankfurt 0.369 0.356 0.375 0.428
Rose Hill, Mauritius 1.093 1.074 1.088 0.912
Singapore 0.433 0.449 0.045 0.426
Mumbai 0.692 0.64 0.662 0.522
Japan 0.419 0.39 0.393 0.366
Sydney 0.528 0.503 0.516 0.497
Brazil 0.405 0.408 0.4 0.384

The WPT tests were pretty phenomenal, I rarely comment on these because it's rare a company stands out so much. Once you left the US, Pantheon was often the fastest amongst their peers. Their global coverage appears to be top notch out of the box.

Plan Tier PHP Bench WP Bench
$25-50 9.914 163.2120124
$51-100 9.229 276.2430939
$200-$500 8.723 294.55081
Enterprise 8.708 235.9046945

The WPPerformanceTester results were pretty consistent. Since it's supposed to be the same platform that scales up, the results looking similar seems to make sense. The slight improvement in PHP bench scores as you scale is nice, but without a lot of repeated testing, unclear if that's by design or just a happy coincidence.

Conclusion

Another year, another fabulous performance from Pantheon. Not only are they the highest rated company on Review Signal's reviews - they consistently earn top tier performance awards in our testing. They stepped up their game from last year and earned an extra Top Tier performance award and an honorable mention. Their global response times were maybe the most impressive feature. They earned fastest average response time in 3/4 tiers on Load Impact and 2/4 on Load Storm, along with often having the fastest response time in their price tiers on WebPageTest. Overall, it was a pretty impressive performance from Pantheon this year.

SiteGround Review (2018)

SiteGround participated for the fifth time in our WordPress Hosting Performance Benchmarks (2018). This review is based off the results of that test. Last year SiteGround competed in four price tiers and earned 3 Top Tier awards.  This year SiteGround competed in the <$25, $25-50, and Enterprise tier.

SiteGround is one of the oldest competitors in our benchmarks and have for years now topped our reviews based on what people say on social media leading the shared category by a whopping 13% over the next highest competitor at the time of writing (Sep 2018).

The Products

Plan Name Plan Monthly Price Plan Visitors Allowed Plan Disk Space Plan Bandwidth
Plan Sites Allowed
GrowBig $14.95 Suitable for ~ 25,000 Visits Monthly 20GB Unmetered Unlimited
GoGeek $29.95 Suitable for ~ 100,000 Visits Monthly 30GB Unmetered Unlimited
Enterprise $4,800 Unlimited $1 per 1GB for distrbuted storage + shared file system 10TB Custom

Enterprise was a custom setup: 8 servers - 2 load balancers, 4 application nodes (PHP workers) and two MySQL database servers. Every server had 16GB of RAM. The total RAM for the whole solution was 128GB RAM.

Performance Review

Load Storm

Total Requests Total Errors Peak RPS Average RPS Peak Response Time(ms) Average Response Time (ms) Total Data Transferred (GB) Peak Throughput (MB/s)
Average Throughput (MB/s)
<25 316,826 14 242.02 176.01 5,361 445 21.18 16.98 11.76
25-50 317,462 16 245.1 176.37 4,569 404 21.23 17.25 11.79
Enterprise 1,443,091 15 1,151.40 801.72 15,086 209 105.15 84.68 58.42

Sources: <25, 25-50, Enterprise

The Load Storm test is designed to simulate real users coming to the site, logging in and browsing the site bursting some of the caching mechanisms typically found on managed WordPress hosts.

SiteGround aced the LoadStorm tests having minimal errors across every price tier. The enterprise configuration really shined here and makes it clear the value of all the redundancy and scalabliity where it had half the average response time and handled 1.43 million requests without issue.

Load Impact

Requests Errors Data Transferred (GB) Peak Average Load Time (Seconds) Peak Average Bandwidth (Mbps)
Peak Average Requests/Sec
<25 318163 4 16.97 0.556 264 605
25-50 316927 0 16.89 0.531 280 642
Enterprise 1627518 7 87.96 0.618 1370 3100

Sources: <2525-50, Enterprise

The Load Impact test makes sure static caching is effective so that if a page gets a lot of traffic the site will keep responding without issue.

SiteGround again aced the Load Impact tests. Nearly no errors on <25 and Enterprise and zero on the 25-50 test.

Uptime

UptimeRobot StatusCake
<25 99.99 99.99
25-50 99 98.94
Enterprise 99.96 100

The <25 and Enterprise didn't have any uptime issues. Unfortunately the 25-50 plan ran into some issues. SiteGround issued a statement about the issue:

"The recorded downtime for the SiteGround GoGeek hosting plan during the test was not a result of actual server availability issues. The uptime is below 99.9% because during performance testing an automatic limitation system temporarily kicked in, in a way that prevented the uptime test to be properly executed. SiteGround confirmed that this particular limitation system should not have been active on the tested accounts and is currently not active on any of their production servers."

WebPageTest / WPPerformanceTester

PHP Bench WP Bench
<25 10.49 1157.407407
25-50 10.44 890.4719501
Enterprise 10.457 196.6181675

The WPPerformanceTester results were average. The distributed nature of the Enterprise shows quite clearly how having redundant and scalable systems can reduce thoroughput on the WP Bench (MySQL) when you run multiple and separate database servers.

<25 25-50 Enterprise
Dulles 0.432 0.508 0.812
Denver 1.489 1.358 1.342
LA 0.909 0.894 1.06
London 0.937 1.082 0.998
Frankfurt 1.087 1.235 0.999
Rose Hill, Mauritius 1.945 2.108 2.636
Singapore 2.088 2.564 1.908
Mumbai 1.957 2.329 2.109
Japan 1.617 1.769 1.394
Sydney 1.781 2.126 1.588
Brazil 1.392 1.565 1.187

Nothing special to say here, it performed as expected.

Conclusion

SiteGround had excellent load testing performances. Load Storm and Load Impact results were great across the board. The <25 plan also had the second fewest errors cumulatively in its price tier. The 25-50 plan looked solid except there was an uptime issue which disqualified it from earning top tier status. SiteGround's Enterprise offering was a new entry in the tier. They made quite a splash with an 8 server configuration which handled our heaviest load tests without batting an eye. It's nice to see SiteGround offering great performance at an entry level price point and being able to scale that performance up to an Enterprise grade solution.

Web Hosting

CloudWays Review (2018)

CloudWays participated for the fourth time in our WordPress Hosting Performance Benchmarks (2018). This review is based off the results of that test. This year CloudWays participated in the 25-50, 51-100 and 201-500 price tiers.

In years past it's been interesting to see CloudWays compete with the same stack on different platforms. This year is the furthest departure from that we've seen so far. It's also the first time CloudWays has earned Top Tier status for two out of three plans that competed this year. It's also important to note, the Digital Ocean plan was originally $70 when testing started but Digital Ocean reduced their pricing causing the cost of the plan to drop dramatically to $42 hence the competing in a different tier above (51-100).

The Products

Plan Monthly Price Plan Visitors Allowed Plan Memory/RAM Plan Disk Space Plan Bandwidth
Plan Sites Allowed
Vultr 4GB New York $44 Unlimited 4GB 60GB SSD 3 TB Unlimited
DigitalOcean 4GB $42 Unlimited 4GB 80gb 4TB unlimited
AWS EC2 - 2XL - USA N.Virginia $495.50 Unlimited 32GB Starts from 4GB (variable) 2GB Unlimited

Performance Review

Load Storm

Total Requests Total Errors Peak RPS Average RPS Peak Response Time(ms) Average Response Time (ms) Total Data Transferred (GB) Peak Throughput (MB/s) Average Throughput (MB/s)
CloudWays AWS 770,304 822 607.12 427.95 15,083 324 52.27 42.27 29.04
CloudWays Vultr 328,015 0 249.5 182.23 7,372 360 22.27 18.55 12.37
CloudWays DO 442,424 243 331.95 245.79 15,097 1,131 30.11 21.79 16.73

Sources: AWS, Vultr, DO

The Load Storm test is designed to simulate real users coming to the site, logging in and browsing the site bursting some of the caching mechanisms typically found on managed WordPress hosts.

The Vultr plan had no issue, the AWS and DO had a few errors but around 0.1% which is negligible. The big issue was Digital Ocean's response time started to increase as the load increased which knocked it out of earning Top Tier status. AWS and Vultr did great overall. With the price change, I wonder if the smaller test would have been handled better though.

Load Impact

Requests Errors Data Transferred (GB) Peak Average Load Time (Seconds) Peak Average Bandwidth (Mbps)
Peak Average Requests/Sec
CloudWays AWS 1049669 0 57 0.36 908 1990
CloudWays Vultr 335275 0 18.21 0.544 278 624
CloudWays DO 457906 30 24.89 1.92 312 702

Sources: AWS, Vultr, DO.

The Load Impact test makes sure static caching is effective so that if a page gets a lot of traffic the site will keep responding without issue.

AWS and Vultr handled it perfectly with zero errors. Digital Ocean had a miniscule 30 errors but an increased response time as the test went on. Great showing overall on the Load Impact test for AWS and Vultr.

Uptime

UptimeRobot StatusCake
CloudWays AWS 100 100
CloudWays Vultr 100 100
CloudWays DO 100 100

Perfect. Across the board, perfect uptime.

WebPageTest / WPPerformanceTester

PHP Bench WP Bench
CloudWays AWS 8.831 266.5955745
CloudWays Vultr 9.616 346.1405331
CloudWays DO 13.421 135.7036233

The WPPerformanceTester results are normal.

CloudWays AWS CloudWays Vultr CloudWays DO
Dulles 0.312 0.33 0.328
Denver 1.137 1.305 1.101
LA 0.924 1.014 1.069
London 0.763 0.725 0.718
Frankfurt 0.816 0.785 0.819
Rose Hill, Mauritius 1.867 2.497 1.86
Singapore 2.281 2.163 2.25
Mumbai 1.65 2.287 1.646
Japan 1.578 1.613 1.573
Sydney 1.837 1.978 2.068
Brazil 1.1 1.195 1.172

The WPT tests look good. The Dulles test scores were some of the fastest, especially the CloudWays AWS server which was located in the same testing data center.

Conclusion

Hard work does pay off. CloudWays has been participating for years and continually has been improving. Two Top Tier awards for AWS and Vultr plans. The Digital Ocean plan unfortunately didn't share the same honor but it seems it was competing above its weight with a price drop that would have put it one cost tier below now.

Pressable Review (2018)

Pressable participated for the third time in our WordPress Hosting Performance Benchmarks (2018). This review is based off the results of that test. Pressable participated in the following price brackets: <$25, $51-100, $101-200, $201-500, and Enterprise.

In the previous test, Pressable earned four Top Tier status out of 5. This year Pressable earned 5/5 Top Tier awards.

The Products

Plan Name Plan Monthly Price Plan Visitors Allowed Plan Disk Space Plan Bandwidth
Plan Sites Allowed
5 Sites $25 60,000 pageviews unlimited unlimited 5
20 Sites $90 400,000 pageviews unlimited unlimited 20
Agency 1 $135 600,000 pageviews unlimited unlimited 30
Agency 3 $225 1,000,000 pageviews unlimited unlimited 50
VIP 2 $750.00 5 million pageviews unlimited Unlimited 100

Performance Review

Load Storm

Total Requests Total Errors Peak RPS Average RPS Peak Response Time(ms) Average Response Time (ms) Total Data Transferred (GB) Peak Throughput (MB/s)
Average Throughput (MB/s)
<$25 330,412 487 249.85 183.56 10102 268 21.65 17.38 12.03
$51-100 475,785 1,112 371.22 264.32 10,192 318 31.17 25.48 17.32
$101-200 622,516 1,555 490.82 345.84 15,063 320 40.76 32.76 22.65
$200-$500 766,477 2,603 610.07 425.82 15,273 355 49.98 40.48 27.77
Enterprise 1,480,277 1,901 1,180.13 822.38 10,719 484 102.15 81.81 56.75

Sources: <25, 51-100, 101-200, 201-500, Enterprise

The Load Storm test is designed to simulate real users coming to the site, logging in and browsing the site bursting some of the caching mechanisms typically found on managed WordPress hosts.

The error rates were a bit higher than before on Load Storm but they seemed to almost exclusively be an issue with the Tokyo testing location for Load Storm. There wasn't any other real noticeable impact, but it was a consistent minor issue in all the tests. The average response times were excellent and error rates were still under control given the Tokyo issue.

Load Impact

Requests Errors Data Transferred (GB) Peak Average Load Time (Seconds) Peak Average Bandwidth (Mbps)
Peak Average Requests/Sec
<$25 326903 21 17.73 0.486 482.1 1060
$51-100 656609 3 34.75 0.443 573 1260
$101-200 979942 21 53.2 0.462 685 1900
$200-$500 977315 27 53.06 0.475 831 1820
Enterprise 1389420 0 77.63 0.773 1150 2520

Sources: <25, 51-100, 101-200, 201-500, Enterprise

The Load Impact test makes sure static caching is effective so that if a page gets a lot of traffic the site will keep responding without issue.

Pressable across the board did fantastic. The enterprise level even managed a perfect run without any errors.

Uptime

UptimeRobot StatusCake
<$25/month 99.99 99.99
$51-100/month 99.94 100
$101-200/month 100 99.99
$200-$500/month 99.93 100
Enterprise 99.98 99.99

Overall every plan maintained above 99.9%. I'd like to see it closes to 100 than 99.9 given their past issue was uptime in the previous test, but overall they improved this year keeping every plan above 99.9% which is great.

WebPageTest / WPPerformanceTester

PHP Bench WP Bench
<$25/month 10.87 562.7462015
$51-100/month 10.998 556.7928731
$101-200/month 10.803 471.6981132
$200-$500/month 10.797 540.8328826
Enterprise 10.924 529.1005291

The WPPerformanceTester results were pretty uniform across all the price tiers. Given the infrastructure is shared this makes a lot of sense. You get the same performance from the lowest price to the enterprise tier.


<$25 51-100 101-200 201-500 Enterprise
Dulles 0.468 0.479 0.474 0.495 0.563
Denver 1.366 1.334 1.384 1.315 2.261
LA 1.008 0.879 1.037 0.971 1.304
London 0.862 0.856 0.868 0.856 1.161
Frankfurt 0.947 0.923 0.881 0.863 1.334
Rose Hill, Mauritius 2.347 2.355 2.362 2.36 3.823
Singapore 2.436 2.224 2.223 2.339 3.068
Mumbai 2.59 1.828 2.558 2.555 2.447
Japan 1.698 1.733 1.748 1.579 2.106
Sydney 1.923 1.903 1.932 1.912 2.771
Brazil 1.389 1.375 1.444 1.397 1.897

The WPT tests look relatively normal. The only strange thing I noticed is that the Enterprise tier was slower in almost every case compared to the other plans. I have no idea why, could just be a timing issue when the tests were run.

Conclusion

This year Pressable stepped up their performance game just that extra bit to push all five plans into earning Top Tier status. When you're near the top it's those little gains that make all the difference. A well earned 5/5 Top Tier WordPress Hosting Performance from Review Signal in 2018.

pressable234x60

LightningBase Review (2018)

LightningBase participated for the fourth time in a row in our WordPress Hosting Performance Benchmarks (2018). This review is based off the results of that test. This year LightningBase entered in the <$25/month and $25-50/month price brackets.

LightningBase has consistently earned Top Tier status in every year they've participated. This year was no exception.

The Products

Plan Name Plan Monthly Price Plan Visitors Allowed Plan Memory/RAM Plan Disk Space Plan Bandwidth
Plan Sites Allowed
Personal $9.95 10,000 (Guideline*) 3 GB 1 GB 10 GB 1
Medium $49.95 100,000 (Guideline*) 6 GB 15 GB 100 GB 10
  • Guideline based on the resources provided, although if most are cached and the site is efficient this may be exceeded dramatically, as we don't artificially limit pageviews.

Performance Review

Load Storm

Plan Total Requests Total Errors Peak RPS Average RPS Peak Response Time(ms) Average Response Time (ms) Total Data Transferred (GB) Peak Throughput (MB/s) Average Throughput (MB/s)
<$25 449,766 93 365.18 249.87 15,096 419 25.38 21.35 14.1
$25-50 455,551 16 360.55 253.08 15,099 401 25.72 21.06 14.29

Sources: https://pro.loadstorm.com/#!test/562070, https://pro.loadstorm.com/#!test/562159

The Load Storm test is designed to simulate real users coming to the site, logging in and browsing the site bursting some of the caching mechanisms typically found on managed WordPress hosts.

In both tests there were minimal errors and the average response time was stable at just over 400ms. The tests at these price tiers are identical, so it's logical that the more expensive plan slightly outperformed the cheaper one.

Load Impact

Requests Errors Data Transferred (GB) Peak Average Load Time (Seconds) Peak Average Bandwidth (Mbps)
Peak Average Requests/Sec
<$25 339672 0 18.26 0.412 300.6 682
$25-50 338834 0 18.19 0.398 302 688

Source: <2525-50

The Load Impact test makes sure static caching is effective so that if a page gets a lot of traffic the site will keep responding without issue.

LightningBase had perfect results on the Load Impact test, zero errors and no noticeable impact on response times.

Uptime

Uptime Robot and StatusCake both showed 100% uptime across the board for LightningBase.

WebPageTest / WPPerformanceTester

PHP Bench WP Bench
8.678 1388.888889
8.726 1288.659794

The WPPerformanceTester results were quite fast. The WP bench scores were very fast (the second fastest in both price tiers).

<25 Load Time 25-50 Load Time
Dulles 0.429 0.429
Denver 1.212 1.118
LA 0.843 0.797
London 1.169 1.173
Frankfurt 1.091 1.186
Rose Hill, Mauritius 2.435 2.436
Singapore 1.863 1.728
Mumbai 2.33 2.098
Japan 1.292 1.304
Sydney 1.762 1.771
Brazil 1.511 1.479

Nothing much to say about the WebPageTest results. They were decidedly normal which is what most people need unless you're targeting a specific geographic region.

Conclusion

LightningBase. Another year, another set of near perfect runs. 100% uptime. Great load tests. This is the 4th year in a row LightningBase has earned top tier recognition. It seems almost expected at this point. I'm still puzzled how they are still flying so far under the radar.


lightning-base-logo

Incendia Web Works Review (2018)

Incendia Web Works (IWW) participated for the second time in our WordPress Hosting Performance Benchmarks (2018). This review is based off the results of that test. This year IWW entered in the same <$25/month price tier.

In the previous test, IWW aced the load tests but fell a bit short on the uptime monitors which prevented them from earning Top Tier status.  In 2018, IWW improved on their first year performance all around and earned themselves Top Tier status from Review Signal.

The Product

Plan Monthly Price Visitors Allowed Disk Space Bandwidth Sites Allowed
Enterprise WordPress Ultimate SSD $16.49 N/A 10 GB 750 GB 1

Performance Review

Load Storm

Total Requests Total Errors Peak RPS Average RPS Peak Response Time(ms) Average Response Time (ms) Total Data Transferred (GB) Peak Throughput (MB/s) Average Throughput (MB/s)
294,518 0 222.42 163.62 4,070 348 21.29 17.14 11.83

Source: https://pro.loadstorm.com#!test/562123

IWW performed great in the Load Storm test. The Load Storm test is designed to simulate real users coming to the site, logging in and browsing the site bursting some of the caching mechanisms typically found on managed WordPress hosts. The most important number is zero errors, every request was responded to. The average response time was 358ms which is also fantastic and good for third best average out of the 15 companies tested in this price bracket.

Load Impact

Requests Errors Data Transferred (GB) Peak Average Load Time (Seconds) Peak Average Bandwidth (Mbps) Peak Average Requests/Sec
339517 0 17.06 0.414 253.9 617

Source: Load Impact Results

IWW managed zero errors again for the Load Impact test. The Load Impact test makes sure static caching is effective so that if a page gets a lot of traffic the site will keep responding without issue. They also had the second lowest peak average load time (second by a mere 2ms). Another great performance for IWW.

Uptime

IWW had 99.99% uptime on UptimeRobot and 99.97% uptime on StatusCake.

WebPageTest / WPPerformanceTester

PHP Bench WP Bench
6.63 749.6251874

The WPPerformanceTester results were the fastest of any company in the price tier for PHP bench.

WPT Location Load Time
Dulles 0.366
Denver 1.21
LA 1.094
London 0.791
Frankfurt 0.894
Rose Hill 1.988
Singapore 2.243
Mumbai 2.432
Japan 1.713
Sydney 2.081
Brazil 1.207

Not a whole lot to say about the WPT results. IWW had the fastest response time in Brazil of any company in the price bracket.

Conclusion

Incendia Web Works had some uptime issues last year which marred their results. This year no such thing happened. IWW continued to have great load testing results and earned itself Top Tier status. They had flawless load test results being the only company with 0 errors on both LoadStorm and LoadImpact. It's nice to see companies improve their consistency and earn a higher ranking.

Hostinger Review

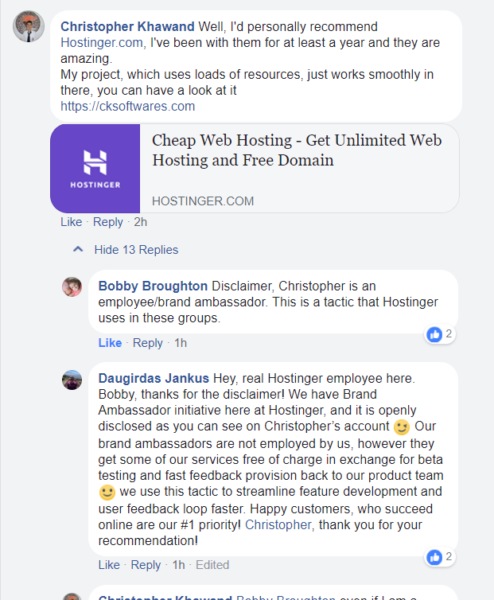
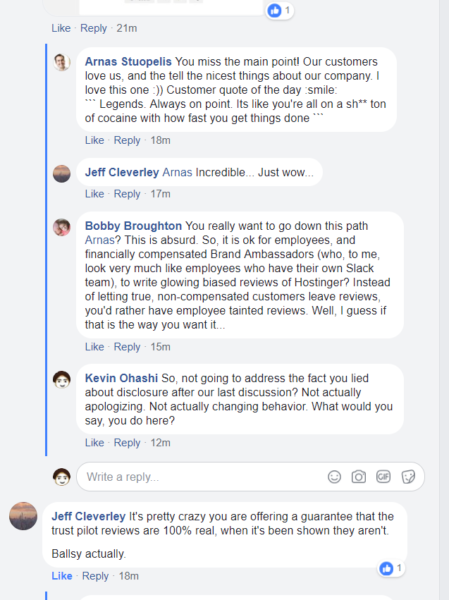
Hostinger Review – 0 Stars for Lack of Ethics

This is Review Signal's FIRST review of a web hosting company! I hope you're excited.

Background

This is a follow up to our original blog post exposing Hostinger's fraudulent reviews which were encouraged and defended by their CEO.

Part 1

Most companies would reconsider their behavior after being caught and called out so publicly. But Hostinger is a special kind of company. The kind where the CEO seems pathologically intent on deceiving customers and passes his values down the corporate chain.

Hostinger's follow up performance was their notorious 'brand ambassador' program. Screenshots below take place on the WordPress Hosting group on facebook around April 19, 2018.

This 'brand ambassador' was caught within an hour of posting. One Hostinger rep jumps in to defend this practice (Daugirdas Jankus, a familiar name if you read the first article). The 'brand ambassador' also tells us there is 32 brand ambassadors in this program. Their CEO, Arnas Stuopolis joins in as well.

The entire thread devolves into a joke with their brand ambassador embarrassing himself. Arnas doesn't do his company any favors either. He even tries to use Hostinger's TrustPilot rating to defend himself. Yes. The very same ones from the last article which exposed his employees were manipulating with his blessing. The full thread can be read here (warning: long).

Part Two

Then the next part of the saga starts with Arnas Stuopelis issuing a statement to the group.

He uses the same lines, including defending their Trust Pilot reviews which were manipulated by their employees. He gets called out immediately, because he's lying.

Of course I had to go grab a screen shot as he made these statements. His 'brand ambassadors' are also posting reviews on Trust Pilot. Posted after he became a brand ambassador of course, wouldn't want to think a legitimate customer posted a review and then became an ambassador after all.

Of course, this was brought up with him at the time as well.

I lay out the evidence. Multiple 'brand ambassadors' posting in multiple places (including commenting on here on Review Signal) trying to promote Hostinger. Posting fake reviews. Hiding their relationships. The exact behavior that got them in trouble the first time.

Apparently laying out all those facts is 'missing the point.'

Just like their employees are customers, brand ambassadors are customers too and he seems to believe they should be feel free to spam communities all over the internet.

Brand Ambassador in Hostinger : I had been the brand ambassador for the company Hostinger and am still working as a brand Ambassador and I met lot of people from abroad and we work together as a team for the growth of our company. (Source: Sai Kiran Bali, Brand Ambassador)

Does this sound like customers who are getting to try new hosting features? He's responsible for working as a team with other brand ambassadors (and Hostinger staff?). The growth of our company. Doesn't sound like a customer at all, smells like employee. Our friend Christopher Khawand also started a github repo called hostinger-ba-dashboard. Why these guys are listing it as a job on LinkedIn, Facebook and resumes? Why are they building software for Hostinger? Who is team drago? Why is Christopher also posting reviews on HostingFacts, TBWHS, whoishostingthis, their own review site and more? Does Mumbere Ausbel post more than a russian troll factory?

#Banned

Hostinger was banned from the WordPress hosting group on facebook for their repeated and calculated deception of an entire community. Good riddance.

Epilogue

I thought this saga was done. Arnas Stuopelis said the brand ambassador program was shut down. Why would should anyone believe this liar?

Guess who I found on Quora (posting as recently as July 20, 2018)? Guess you missed that I dig up web hosting spam networks on Quora too.

Source: Mumbere AusbelAditya Bhavsar

So much for actually shutting down your program, these 'brand ambassadors' (spammers, shills), are back at it in coordinated fashion.


List of Known Hostinger Brand Ambassadors (6/32?)

Mumbere Ausbel

Aditya Bhavsar

Christopher Khawand

Pranshu Maheshwari

Mit Rao

Sai Kiran Bali

Conclusion

My Hostinger Review: avoid with a 100 foot pole. It's hard to in conscience believe a company so intent on lying to people is a good company by any definition of the word.  Their CEO is happy to lie to people's faces about facts. His employees are happy to do the same. They spend a lot of time coming up with ways to manipulate communities into believing they are good by astroturfing (brand spamdassadors). Hostinger is a company anyone with a sense of ethics should steer clear of, 0 stars.

Hostinger’s Fake Reviews – A Guide on How NOT to Promote Your Company

Update: Part 2 Here. Arnas Stuopelis defends Hostinger's Trust Pilot Reviews and uses 'brand ambassadors' to manipulate communities.

It started with a seemingly innocuous comment responding to someone looking for a hosting recommendation.

So what's wrong here? Let's take a look at all those likes.

So the CEO, Head of Acquisition, former Customer Success Manager (and now running a review site promoting Hostinger), Head of Customer Service and Customer Success Specialist from the company all liked this status posted by a Junior Software Engineer at Hostinger. The followup comment by the Head of Acquisition, which links to their good reviews on TrustPilot, is also liked by the CEO and the Junior Software Engineer.

This seems a bit manipulative in a post asking for recommendations to have your employees all commenting/liking yourselves to give a false sense of popularity.

But how did we get here?

So a huge influx of Hostinger employees all showed up to participate in a poll asking which company was the community's favorite (hint: they voted for themselves). So their entire presence in this community was started because they wanted to manipulate a community vote to give themselves a false sense of popularity. Their manipulation got them a nice 4th place out of ~65 companies. Technically there wasn't a rule against voting for yourself and I'm sure other representatives from companies voted for themselves too, but not in such a massive group that the admins were commenting on it. But this adds context to why all these employees joined the community with regards to timing.

So what's the big deal?

Some of their employees are pretending to be customers and offering unsubstantiated (and clearly biased) comparisons against their competitors.


"Hey, checkout our TrustPilot score!" or "Look at this review comparing us to the heavyweights in the industry!"

At least there is a disclosure from this employee that he works there.

Problem is that the review is published by themselves (always a good comparison source). They also like to use TrustPilot again and pick negative reviews about their competitors. They like comparing themselves to SiteGround.

So they pick a negative review for SiteGround (and HostGator) and a positive review for themselves to highlight how the 'real users speak for themselves.' Except when you look at the overall score, SiteGround scores a 9.6/10 on TrustPilot versus Hostinger's 9.3/10. They probably don't want you to know that though. It doesn't fit the narrative when you actually have worse reviews than your competitor on your darling review site.

Hostinger is so focused on TrustPilot and how "real users" and "customer replies cannot lie."

Are you ready for the surprise?

So who is posting these glowing reviews about Hostinger on TrustPilot? It's none other than.... drumroll please.... themselves!

But wait, there's more!


So that glowing Trust Pilot score they are using to advertise their own service? Fake and manipulated. I guess their 'customers' (also known as their staff) can lie.

As a further bonus, as I was working on this article I was contacted by Paulius Zemaitis. The name might look familiar from the top of this article where he was liking their statuses. He used to work for Hostinger as a Customer Success Manager for nearly 4 years. Now he runs a review site called Hosting Review where you will be shocked to know he has ranked Hostinger as the #1 host. He was kind enough to try to buy sponsored content on Review Signal to promote his reviews. And when I called into question his integrity ranking his former employer as the best, he wrote "What kind of reviewer would I be if I placed Hostinger lower when it's cheaper, faster and more reliable than other hosts?"

000webhost is another brand owned/operated by Hostinger.

So I pointed out it's hard to trust anyone who pretends to be a customer of his own company and writes reviews for them while an employee there. I wondered if that posed any problems for him. He never responded.

Conclusion

Instead of behaving like an ethical company, they simply manipulated a community, a review site and a former employee created another review site which promotes them.

Whether they are technically competent is still unknown, but it's hard to think we as a community should be rewarding this type of behavior. It's beyond simply being overly self promotional, it's a operating a campaign to deceive consumers. It's hard to want to ever trust a company that thinks that is ok, especially when the CEO is often one of those people commenting on Facebook.

Of course, they got called out right as I was publishing this and their official response is just priceless.

Instead of simply punishing Hostinger for their bad behavior, I wanted to create something good as a result of this investigation. I reached out to a lot of thought leaders in the community to talk about the proper way for companies to engage with communities. 

A Guide to Community Participation for Web Hosting Companies and Employees.

Update

Their CEO, Arnas Stuopelis thinks this behavior is ok. Would rather Review Signal didn't exist to expose their bad behavior. Classy organization from the top down. By classy I mean fraudsters, obviously.

Black Friday and Cyber Monday Web Hosting Deals (2017)

Missing a deal? Please Contact Us

Company Offer Restrictions Coupon Start End
A2 Hosting 67% off Shared HUGE67 Nov 23 Nov 27
A2 Hosting
50% off Managed / Core VPS
CMVPS Nov 23 Nov 27
A2 Hosting 40% off Reseller RSL40 Nov 23 Nov 27
BlueHost $2.65/month Nov 24 Nov 27
CloudWays $150 Hosting Credit Credit applied at 10% monthly bill until credit expires BF150 Nov 21 Dec 11
FlyWheel 3 Months Free Annual subscription flyday17 Nov 20 Nov 28
GreenGeeks 70% off shared hosting  Nov 24  Nov 27
HostGator 80% off
InMotion Hosting $2.95/month Nov 24
Kickassd  6 months free  annual plan  50FRIDAY  Nov 21  Nov 24
Kinsta  30% off first month  Discount applied with support ticket (put in coupon code)  ReviewsignalBF2017  Nov 24  Nov 27
LiquidWeb
Dedicated Servers 50% off for 3 months
BF17PROMO Nov 30
LiquidWeb
VPS 50% off for 3 months
BF17PROMO Nov 30
MediaTemple
40% off Annual Plans
Nov 24 Nov 28
Nestify $49/year for Shared Personal Plan (Normally $19.99/month)  New customers  REVIEWSIGNAL2017 Nov 23 Nov 30
Nestify $199/year for VPS-Lite Plan (Normally $79/month)  New customers  REVIEWSIGNAL2017 Nov 23 Nov 30
Nexcess
80% off First Month
New Customers Only  BF17 Nov 24 Nov 27
SiteGround 70% off Shared Nov 24 Nov 27
WPEngine
35% off first payment
cyberwpe35 Nov 22 Nov 30
WPX Hosting Double Sites, Bandwidth, Disk Space
Two Year Purchase
Nov 22 Nov 29
WPX Hosting Three months free
Annual Subscription
Nov 22 Nov 29
WPX Hosting $1 First Month
$1 for the first month
Nov 22 Nov 29
Loading...

Interested in seeing which web hosting companies people love (and hate!)? Click here and find out how your web host stacks up.