Tag Archives: pressable

Pressable Review (2018)

Pressable participated for the third time in our WordPress Hosting Performance Benchmarks (2018). This review is based off the results of that test. Pressable participated in the following price brackets: <$25, $51-100, $101-200, $201-500, and Enterprise.

In the previous test, Pressable earned four Top Tier status out of 5. This year Pressable earned 5/5 Top Tier awards.

The Products

Plan Name Plan Monthly Price Plan Visitors Allowed Plan Disk Space Plan Bandwidth
Plan Sites Allowed
5 Sites $25 60,000 pageviews unlimited unlimited 5
20 Sites $90 400,000 pageviews unlimited unlimited 20
Agency 1 $135 600,000 pageviews unlimited unlimited 30
Agency 3 $225 1,000,000 pageviews unlimited unlimited 50
VIP 2 $750.00 5 million pageviews unlimited Unlimited 100

Performance Review

Load Storm

Total Requests Total Errors Peak RPS Average RPS Peak Response Time(ms) Average Response Time (ms) Total Data Transferred (GB) Peak Throughput (MB/s)
Average Throughput (MB/s)
<$25 330,412 487 249.85 183.56 10102 268 21.65 17.38 12.03
$51-100 475,785 1,112 371.22 264.32 10,192 318 31.17 25.48 17.32
$101-200 622,516 1,555 490.82 345.84 15,063 320 40.76 32.76 22.65
$200-$500 766,477 2,603 610.07 425.82 15,273 355 49.98 40.48 27.77
Enterprise 1,480,277 1,901 1,180.13 822.38 10,719 484 102.15 81.81 56.75

Sources: <25, 51-100, 101-200, 201-500, Enterprise

The Load Storm test is designed to simulate real users coming to the site, logging in and browsing the site bursting some of the caching mechanisms typically found on managed WordPress hosts.

The error rates were a bit higher than before on Load Storm but they seemed to almost exclusively be an issue with the Tokyo testing location for Load Storm. There wasn't any other real noticeable impact, but it was a consistent minor issue in all the tests. The average response times were excellent and error rates were still under control given the Tokyo issue.

Load Impact

Requests Errors Data Transferred (GB) Peak Average Load Time (Seconds) Peak Average Bandwidth (Mbps)
Peak Average Requests/Sec
<$25 326903 21 17.73 0.486 482.1 1060
$51-100 656609 3 34.75 0.443 573 1260
$101-200 979942 21 53.2 0.462 685 1900
$200-$500 977315 27 53.06 0.475 831 1820
Enterprise 1389420 0 77.63 0.773 1150 2520

Sources: <25, 51-100, 101-200, 201-500, Enterprise

The Load Impact test makes sure static caching is effective so that if a page gets a lot of traffic the site will keep responding without issue.

Pressable across the board did fantastic. The enterprise level even managed a perfect run without any errors.

Uptime

UptimeRobot StatusCake
<$25/month 99.99 99.99
$51-100/month 99.94 100
$101-200/month 100 99.99
$200-$500/month 99.93 100
Enterprise 99.98 99.99

Overall every plan maintained above 99.9%. I'd like to see it closes to 100 than 99.9 given their past issue was uptime in the previous test, but overall they improved this year keeping every plan above 99.9% which is great.

WebPageTest / WPPerformanceTester

PHP Bench WP Bench
<$25/month 10.87 562.7462015
$51-100/month 10.998 556.7928731
$101-200/month 10.803 471.6981132
$200-$500/month 10.797 540.8328826
Enterprise 10.924 529.1005291

The WPPerformanceTester results were pretty uniform across all the price tiers. Given the infrastructure is shared this makes a lot of sense. You get the same performance from the lowest price to the enterprise tier.


<$25 51-100 101-200 201-500 Enterprise
Dulles 0.468 0.479 0.474 0.495 0.563
Denver 1.366 1.334 1.384 1.315 2.261
LA 1.008 0.879 1.037 0.971 1.304
London 0.862 0.856 0.868 0.856 1.161
Frankfurt 0.947 0.923 0.881 0.863 1.334
Rose Hill, Mauritius 2.347 2.355 2.362 2.36 3.823
Singapore 2.436 2.224 2.223 2.339 3.068
Mumbai 2.59 1.828 2.558 2.555 2.447
Japan 1.698 1.733 1.748 1.579 2.106
Sydney 1.923 1.903 1.932 1.912 2.771
Brazil 1.389 1.375 1.444 1.397 1.897

The WPT tests look relatively normal. The only strange thing I noticed is that the Enterprise tier was slower in almost every case compared to the other plans. I have no idea why, could just be a timing issue when the tests were run.

Conclusion

This year Pressable stepped up their performance game just that extra bit to push all five plans into earning Top Tier status. When you're near the top it's those little gains that make all the difference. A well earned 5/5 Top Tier WordPress Hosting Performance from Review Signal in 2018.

pressable234x60

Pressable WordPress Hosting Review (2016)

Pressable participated for the second time in WordPress Hosting Performance Benchmarks. Their last participation was in the original which was performed in 2013. They've undergone major changes since then and are now owned by Automattic. This year they had the most plans entered of any company at five into the following ranges: $25-50/month, $51-100/month, $101-200/m, $201-500/month and Enterprise ($500+/month).

Products

Company / Price Bracket Plan Monthly Price Visitors Allowed Disk Space Bandwidth Sites Allowed
Pressable 25-50 5 Sites $25 60,000 Unlimited Unlimited 5
Pressable 51-100 20 Sites $90 400,000 Unlimited Unlimited 20
Pressable 101-200 Agency 1 $135 600,000 Unlimited Unlimited 30
Pressable 201-500 Agency 3 $225 1 Million Unlimited Unlimited 50
Pressable Enterprise VIP 1 $750 5 Million Unlimited Unlimited 100

They made it clear to me that the products are identical until the VIP level, each site has equal resources, the only difference in plans is that more sites are allowed.

View Full Product Details

Performance Review

LoadStorm Results

Company / Price Bracket Total Requests Total Errors Peak RPS Average RPS Peak Response Time(ms) Average Response Time(ms) Total Data Transferred (GB) Peak Throughput (MB/s) Average Throughput (MB/s)
Pressable 25-50 394405 26 294.6 219.11 15101 226 16.4 13.32 9.111
Pressable 51-100 569095 0 441.43 316.16 3152 239 24.35 20.19 13.53
Pressable 101-200 724499 1090 562.12 402.5 15024 447 30.91 26.07 17.17
Pressable 201-500 896616 12256 740.88 498.12 6362 450 37.87 33.8 21.04
Pressable Enterprise 1538237 7255 1162.63 854.58 15099 733 29.18 21.95 16.21

LoadStorm test logged in thousands of users to simulate heavy uncached load on the server, scaling up with more users on larger plans after the $25-50/month range. Pressable overall did very well. Earning top tier status in four our of five. The 201-500 price bracket had a bit of difficulty with the increased load which disappears at the Enterprise level.

Blitz Results

Company / Price Bracket Hits Errors Timeouts Average Hits/Second Average Response Time Fastest Response Slowest Response
Pressable 25-50 25914 0 2 432 134 134 136
Pressable 51-100 51781 0 0 863 135 134 136
Pressable 101-200 77652 0 4 1294 134 141 133
Pressable 201-500 77850 11 1 1298 132 131 135
Pressable Enterprise 129866 13 2 2164 132 131 139

The Blitz test is designed to make sure that static assets (which should be served from cache) are being handled properly and can scale to very heavy big spikes in traffic. If the LoadStorm test was a clinic, this was absolute perfection. Pressable had zero issues with the Blitz tests across every plan. Their caching is certainly up to snuff.

Uptime

Company StatusCake UptimeRobot
Pressable 25-50 99.91 99.92
Pressable 51-100 99.93 99.95
Pressable 101-200 99.96 99.94
Pressable 201-500 99.88 99.9

Oddly enough, Uptime was one of the biggest struggles for Pressable. The 201-500 plan didn't earn top tier status because it fell below the 99.9% threshold averaging 99.89 between the two monitors. The rest were closer to the 99.9% mark than the 100% mark which, while above the expected threshold, I'd like to see a bit of improvement in.

Uptime wasn't tracked on most Enterprise level plans because they are just so expensive that it felt wasteful to run them for a long period doing nothing but monitoring uptime if the company had other plans in the testing which could also be measured.

WebPageTest / WPPerformanceTester

I mention these because they are in the full testing but I won't bother putting them here. No company had any significant issue with either and it's not worth writing about. If you're very interested in seeing the geographical response times on WPT or what the raw computing power test of WPPerformanceTester measured, read the full results.

Conclusion

Pressable managed to earn four Top Tier WordPress Hosting Performances out of five plans. Overall, the performance is excellent and they can scale from $25/month to Enterprise size workloads. I'd like to see some minor improvements in uptime, but apart from that small issue, they don't have much else to improve on. It's great to see a strong competitor at virtually every price level in the space.

pressable234x60


$500+/Month Enterprise WordPress Hosting Performance Benchmarks (2016)

LoadStormLogo

Sponsored by LoadStorm. The easy and cost effective load testing tool for web and mobile applications.

The full company list, product list, methodology, and notes can be found here

This post focuses only on the results of the testing in the $500+/month price bracket for WordPress Hosting.

Enterprise WordPress Hosting Introduction

This is super exciting for me to test the ultra high end of the market. The past three years I've focused entirely on entry level plans, but the market has changed tremendously since I started and there is a very real demand for Enterprise WordPress hosting. I think this is the first time that a lot of these companies have been benchmarked, especially at this scale and level. So I hope this adds a new and incredibly valuable door for the minority of sites out there that really need to handle massive amounts of users.

The Enterprise testing this year had some fundamental differences from all the other testing that need to be discussed upfront. These are huge and expensive systems that are normally customized on a per-customer basis by these companies. They all offer a much more hands on experience than hosting plans at the other end of the spectrum and charge accordingly. For that reason, I felt it was only responsible to change how they were tested slightly.

The first change is there is no default setup, which is what I test in every other price tier. The companies were given explicit permission to customize their platform and knew what tests were coming their way. Some even ran their own load tests to make sure they were going to perform as advertised and made changes. This is what I would expect from plans charging hundreds, if not thousands of dollars per month for large sites. So I wanted to let them perform their normal services for this tier.

Uptime monitoring was reduced for many companies in this tier. Since these plans are very expensive and consume huge amounts of resources, I didn't want to keep my test sites eating up lots of money and resources. If they had other plans entered into the system, I created a composite based on what all their other plans averaged for uptime.


$500+/Month Enterprise WordPress Hosting Products

review_signal_table_enterprise

$500+/Month Enterprise WordPress Hosting Performance Benchmarks Results

1. Load Storm

Test 500-10,000 Concurrent Users over 30 Minutes, 10 Minutes at Peak

Company Total Requests Total Errors Peak RPS Average RPS Peak Response Time(ms) Average Response Time(ms) Total Data Transferred (GB) Peak Throughput (MB/s) Average Throughput (MB/s)
Kinsta 1314178 274 1041.28 730.1 15014 340 75.7 60.75 42.06
Pagely 1388436 18 1108.3 775.24 9086 259 76.97 61.75 42.76
Pantheon 1295178 9964 1014.58 719.54 15101 786 30.86 24.18 17.15
Pressable 1538237 7255 1162.63 854.58 15099 733 29.18 21.95 16.21
Pressidium 1349118 3792 1076.52 749.51 11798 324 73.63 60.18 40.91
WordPress.com VIP 4660190 8151 3726.38 2588.99 8186 101 197.82 158.29 109.9
WPEngine 1515128 247976 1211.18 841.74 19797 281 52.1 40.34 28.94

Discussion of Load Storm Test Results

First off, this is the biggest load tests I've run to date. I had limited resources and wanted to test a high enough number to really put some stress on these systems. 10,000 concurrent users seemed like a reasonable choice based on limited resources and high enough to be meaningful for sites that are truly getting a lot of traffic.

Kinsta and Pagely [Reviews] had basically flawless performances. Flat average response times, minimal errors and no spikes.

WordPress.com VIP had a nearly perfect looking run except for some minor issue with wp-login that might be security related but persisted the entire test at a tiny level (0.17%). The average response time was impressively flat and the fastest of any company by a good bit at 101ms. They also maintained the lowest peak response time. WP VIP also loaded a lot of extra scripts that nobody else did, which increased their transfer data to be multiple times higher than anyone else.

Pantheon [Reviews], Pressable and Pressidium each had minor spikes but put on nearly perfect performances otherwise.

WPEngine [Reviews] ran into what looks to be a similar issue to the other tests, wp-login/admin security issues. Which caused a lot of errors and makes the test look not great. However, their average response time was flat, but it's really hard to say with such a high error rate (16.37%).


2. Blitz.io

Test 1-5000 Concurrent Users over 60 seconds

Blitz Test Quick Results Table

Company Hits Errors Timeouts Average Hits/Second Average Response Time Fastest Response Slowest Response
Kinsta 135485 7 0 2258 85 83 87
Pagely 146339 0 0 2439 4 3 14
Pantheon 138607 4 27 2310 62 60 80
Pressable 129866 13 2 2164 132 131 139
Pressidium 143452 0 2 2391 26 24 35
WordPress.com VIP 146200 0 73 2437 6 3 21
WPEngine 108168 12939 1061 1803 158 6 346

Discussion of Blitz Test 1 Results

This test is just testing whether the company is caching the front page and how well whatever caching system they have setup is performing (generally this hits something like Varnish or Nginx).

Who performed without any major issues?

Kinsta, Pagely [Reviews], PantheonPressablePressidium and WordPress.com VIP all handled 5000 concurrent hits to the frontpage without any issue. The largest spread in response times among all of them was a minuscule 20ms. Pagely even managed an impressive perfect no errors or timeouts.

Who had some major issues?

WPEngine [Reviews] struggled with this test. Around 20 seconds into the test, there was a substantial increase in response time which continued to slowly increase for the rest of the test. The errors and timeouts started to kick in 5 seconds later at the 25 second mark and also gradually increased until the test ended.

3. Uptime Monitoring

Both uptime monitoring solutions were third party providers that offer free services. UptimeRobot was paid for and monitoring on a 1 minute interval. All the companies were monitored over approximately two months (May-June 2016).

For Enterprise testing, many of the plans were only setup for a short period of time because of the enormous cost involved with setting these up. Only WordPress.com VIP and WPEngine were monitored directly. The rest are composite scores based on the other plans companies entered in and the company's average uptime as denoted with an asterisk (*).

Uptime Robot & StatusCake

Company StatusCake UptimeRobot
Kinsta* 99.98  100
Pagely*  99.98  99.98
Pantheon*  99.99  99.99
Pressable*  99.92  99.90
Pressidium*  99.97  99.99
WordPress.com VIP 100 100
WPEngine 100 100

* Composite uptime based on all the plans entered in 2016 testing from a company.

Every company in the enterprise tier seems capable of keeping their servers online, thankfully.

4. WebPageTest.org

Every test was run with the settings: Chrome Browser, 9 Runs, native connection (no traffic shaping), first view only.

Company WPT Dulles WPT Denver WPT LA WPT London WPT Frankfurt WPT South Africa
Kinsta 0.718 0.588 0.958 1.256 1.741 5.844
Pagely 0.752 0.758 0.953 1.243 2.029 9.885
Pantheon 0.809 0.563 1.02 1.284 1.826 4.882
Pressable 1.056 0.894 1.207 1.691 2.126 7.244
Pressidium 0.848 0.661 1.165 1.279 1.634 5.819
WordPress.com VIP 1.02 0.786 0.918 1.471 1.755 3.045
WPEngine 0.813 0.592 1.07 1.223 1.743 3.814
Company WPT Singapore WPT Shanghai WPT Japan WPT Sydney WPT Brazil
Kinsta 2.084 22.391 2.055 1.643 1.891
Pagely 2.455 23.148 2.203 2.117 2.153
Pantheon 2.336 22.723 1.95 1.852 2.032
Pressable 2.707 22.521 2.227 2.807 2.205
Pressidium 2.202 22.477 2.265 1.662 1.797
WordPress.com VIP 1.809 24.098 1.83 1.386 1.916
WPEngine 2.255 22.971 2.115 1.722 1.846

It's not surprising that these companies deliver content pretty quick all around the world. What is interesting is WordPress.com VIP was the fastest to Sydney, Japan, Singapore, South Africa, and LA. Kinsta was the fastest in Dulles and Shanghai. Pantheon was fastest in Denver. WPEngine was the fastest to London. Pressidium was the fastest to Brazil. I'm not sure how meaningful it is, but it's interesting to see the most expensive product having the fastest load times in locations all across the world.

5. WPPerformanceTester

Company PHP Bench [Seconds] (lower=faster) WP Bench [Queries Per Second](higher=faster)
Kinsta 11.37 320.82
Pagely 9.136 249.81
Pantheon 11.322 216.31
Pressable 10.834 491.64
Pressidium 10.958 367.24
WordPress.com VIP 2.244 500.25
WPEngine 13.178 533.9

I'm not sure what WordPress.com VIP is running, but it put up the absolute fastest scores in the PHP bench that I've seen by a wide margin. Roughly triple the speed of the next fastest which had a 6.5 second score. Every other company looked to be in the normal range between 9-13 seconds.

Another interesting part of the results here is that nobody was really going much faster than 500 queries per second in the WP Bench. I don't think a single one is running a local database which put up some blazing fast speeds in the lower tiers. If you're looking to host enterprise WordPress sites, you lose that no network latency performance, but certainly gain in reliability and scalibility.

Conclusion

White glove service and hefty price tags makes for some spectacular performance. It's nice to see that if you really have a site getting millions of visitors per day, there are a lot of really solid choices out there who can handle the mega WordPress sites that need Enterprise level hosting.

Top Tier WordPress Hosting Performance

review_signal_2016_trophy_enterprise

Kinsta, Pagely [Reviews], PantheonPressablePressidium and WordPress.com VIP all offer Top Tier Enterprise WordPress Hosting. None of them had any real struggles with keeping their servers up, the 10,000 and 5,000 user load tests. If you can afford them, they all seem worthy and capable.

Individual Host Analysis

Kinsta

Kinsta had essentially perfect LoadStorm and Blitz tests. They also had no flaws in any other tests. I'm at a loss for words to praise their performance.

Pagely [Reviews]

Pagely aced it. The fewest errors on LoadStorm and a no errors on Blitz. I can't find any faults with Pagely's Enterprise offering.

Pantheon [Reviews]

Pantheon really stepped it up for the Enterprise testing. Effortlessly went through the Blitz test. They had a some minor spikes in the LoadStorm test and their average response time started to creep upwards but nothing worth being concerned over. Overall, a top tier performance.

Pressable

Pressable performed nearly identical to Pantheon. Excellent Blitz test, some minor spikes and increase in response times in the LoadStorm test. The uptime was the lowest of everyone with UptimeRobot having an average of 99.90% which has been my border for pass/fail. I gave them top tier, but they were about as close as you can get to the edge.

Pressidium

Pressidium had a nearly perfect Blitz test with 2 timeouts and did excellent on the LoadStorm test which had 2 very minor spikes but maintained a nearly flat average response time otherwise. Easily a top tier performance.

WordPress.com VIP 

WordPress.com VIP was by far the most expensive plan tested and it put on a fantastic performance. It had a near perfect Blitz test. Despite having what appeared to be a security issue on the LoadStorm test it had the fastest average response time at 101ms and moved more data than any other company by a wide margin because of the custom scripts. But that didn't seem to negatively impact their performance at all. I'm also not sure what sort of hardware they are running by they blew my WPPerformanceTester PHP bench out of the water. Despite the highest price tag, they put on an amazing show and easily earned Top Tier Enterprise WordPress Hosting status.

WPEngine [Reviews]

Unfortunately, WPEngine was the only company in this tier not to do well in this tier. They struggled in both load tests. LoadStorm looked like it may have been security related, but Blitz looked like it really had trouble with the load. I believe the plan I tested cost $600/month, but the sales team wasn't willing to give me specific pricing for their enterprise tier.

$201-500/Month WordPress Hosting Performance Benchmarks (2016)

LoadStormLogo

Sponsored by LoadStorm. The easy and cost effective load testing tool for web and mobile applications.

The full company list, product list, methodology, and notes can be found here

This post focuses only on the results of the testing in the $201-500/month price bracket for WordPress Hosting.

$201-500/Month WordPress Hosting Products

review_signal_table_500

$201-500/Month WordPress Hosting Performance Benchmarks Results

1. Load Storm

Test 500-5000 Concurrent Users over 30 Minutes, 10 Minutes at Peak

Company Total Requests Total Errors Peak RPS Average RPS Peak Response Time(ms) Average Response Time(ms) Total Data Transferred (GB) Peak Throughput (MB/s) Average Throughput (MB/s)
Kinsta 671665 47 528.38 373.15 9991 285 38.68 31.73 21.49
MediaTemple 775277 34144 616.05 430.71 15334 761 39.71 33.5 22.06
Pagely 553754 133181 456.03 307.64 16132 3333 19.32 13.94 10.73
Pantheon 629578 49212 510.78 349.77 15091 1353 33.88 28.9 18.82
Pressable 896616 12256 740.88 498.12 6362 450 37.87 33.8 21.04
Pressidium 697020 0 547.88 387.23 4894 266 38.16 31.05 21.2
PressLabs 692581 21180 547.72 384.77 15493 2109 23.02 18.45 12.79
SiteGround 640337 48537 507.98 355.74 15564 1549 30.64 24.25 17.02

Discussion of Load Storm Test Results

Kinsta and Pressidium were clearly the two best performers in this test.

Pressable had some minor issues that looked like they may have been security related to wp-login.

MediaTemple [Reviews] had a spike of errors at the very end and some minor errors throughout the test that might have been security related since they didn't impact response times at all.

PressLabs had some spikes and wp-login related problems but the server started to slow down its response times as the test progressed.

Pantheon [Reviews] had similar issues to PressLabs with slowing down and the largest chunk being wp-login related.

SiteGround [Reviews] started to have trouble around 12 minutes in and saw spikes, also mostly related to wp-login/admin. They also had increased and unstable response times associated with the spikes.

Pagely [Reviews] struggled the most with this test with spikes and increased response times. wp-login again was the worst offender.

What is amazing is none of these companies completely failed with 5000 real users logging in and bursting caches.

2. Blitz.io

Test 1-3000 Concurrent Users over 60 seconds

Blitz Test Quick Results Table

Company Hits Errors Timeouts Average Hits/Second Average Response Time Fastest Response Slowest Response
Kinsta 81386 3 0 1356 84 84 86
MediaTemple 44310 33581 450 739 249 189 676
Pagely 79095 1554 1153 1318 23 2 195
Pantheon 83211 2 0 1387 61 61 68
Pressable 77850 11 1 1298 132 131 135
Pressidium 85439 11 14 1424 31 25 82
PressLabs 87432 0 0 1457 8 3 13
SiteGround 82396 1 0 1373 71 71 72

Discussion of Blitz Test 1 Results

This test is just testing whether the company is caching the front page and how well whatever caching system they have setup is performing (generally this hits something like Varnish or Nginx).

Who performed without any major issues?

Kinsta, Pantheon, Pressable, Pressidium, PressLabs, and SiteGround [Reviews] all had close to no errors (and exactly none in PressLabs's case).

Who had some minor issues?

Pagely [Reviews] had a couple spikes which increased response times and errors.

Who had some major issues?

MediaTemple [Reviews] had an early spike and a big spike later. The big spike later looks like it may have partially been a security measure. But it did eventually increase response times as well.

3. Uptime Monitoring

Both uptime monitoring solutions were third party providers that offer free services. UptimeRobot was paid for and monitoring on a 1 minute interval. All the companies were monitored over approximately two months (May-June 2016).

Uptime Robot & StatusCake

Company StatusCake UptimeRobot
Kinsta 99.98 100
MediaTemple 99.96 99.97
Pagely 99.95 99.95
Pantheon 99.98 99.98
Pressable 99.88 99.9
Pressidium 99.95 99.99
PressLabs 99.99 99.98
SiteGround 100 99.99

I hate having to penalize a company for uptime, but Pressable recorded 99.88 and 99.90 uptime scores which is below the 99.9% I expect from every company.

Every other company did well.

4. WebPageTest.org

Every test was run with the settings: Chrome Browser, 9 Runs, native connection (no traffic shaping), first view only.

Company WPT Dulles WPT Denver WPT LA WPT London WPT Frankfurt WPT South Africa
Kinsta 0.77 0.545 0.947 1.151 1.707 4.466
MediaTemple 1.064 0.608 0.901 1.341 1.925 6.576
Pagely 0.658 0.651 0.947 1.144 1.691 3.868
Pantheon 0.762 0.623 1.054 1.104 1.672 4.493
Pressable 0.973 0.781 1.084 1.514 1.967 7.708
Pressidium 0.687 0.641 1.181 1.17 1.68 4.516
PressLabs 0.762 0.754 1.082 1.148 1.624 5.357
SiteGround 0.801 0.725 1.25 1.214 1.757 4.514
Company WPT Singapore WPT Shanghai WPT Japan WPT Sydney WPT Brazil
Kinsta 2.165 22.777 2.114 1.785 1.848
MediaTemple 2.164 22.061 1.811 2.071 2.118
Pagely 2.215 22.811 1.798 2.193 1.794
Pantheon 2.166 22.427 1.797 1.769 1.872
Pressable 2.426 22.233 2.124 2.945 2.135
Pressidium 2.105 22.355 2.038 1.672 1.745
PressLabs 1.643 22.048 1.581 2.358 2.092
SiteGround 2.496 22.431 2.051 3.27 2.034

Fast. Not much to really say about these results. Nobody had issues, nothing was particularly interesting here other than nobody can get into China at any price level.

5. WPPerformanceTester

Company PHP Bench [Seconds] (lower=faster) WP Bench [Queries Per Second](higher=faster)
Kinsta 11.297 321.34
MediaTemple 12.331 107.49
Pagely 9.841 194.36
Pantheon 13.836 184.81
Pressable 11.016 384.32
Pressidium 11.902 304.79
PressLabs 8.055 841.04
SiteGround 17.082 738

Not sure why SiteGround's PHP bench was so slow. The average WP Bench scores are also lower than every previous tier with PressLabs leading the way at 841. These more expensive solutions are generally trending towards cloud/clustered solutions which have slower database throughput in exchange for scale.

Conclusion

The high end WordPress hosting market is growing and has a lot of good options. No company in this tier completely faltered during the load tests despite a huge strain being put on them  of 3000 concurrent hits to the frontpage and 5000 logged in users browsing the site.

Top Tier WordPress Hosting Performance

review_signal_2016_trophy_500

Kinsta and Pressidium clearly led the pack in terms of performance. They were the only two companies that handled LoadStorm without issue. They also didn't have any other issues across the other tests.

Honorable Mentions

PressLabs earned itself an honorable mention. It had some issues with the LoadStorm test but it managed to stay up and did well on all the other tests.

Individual Host Analysis

Kinsta

Overall, a splendid performance that earned them top tier WordPress hosting in the $201-500/month range. No faults in their performance at any point.

MediaTemple [Reviews]

It's nice to see Media Temple playing with the big boys and doing a respectable job. They had a little bit of trouble with the LoadStorm test and some possibly security related issues during the Blitz test which kept them out. But they weren't out of place in this bracket and were by far the cheapest at $240/month.

Pagely [Reviews]

Pagely had some minor problems with the Blitz test but the LoadStorm test really seemed to be the big problem. The 5000 users seemed to clearly tax the server too much. Pagely reviewed the results and issued a full explanation. Their tl;dr was "Wrong plan/instance size for this test.
We price the value of our human Support and DevOps resources into the plan cost, which puts the ideal Pagely plan for this test outside the $500 cap. If the customer does not utilize the full range of services we provide they are essentially overpaying for AWS instances that in this case were undersized and not tuned for the test. "

Pantheon  [Reviews]

Pantheon did well everywhere but LoadStorm which was a common theme for this bracket. They didn't fail, but they certainly were being taxed with increased load times and error rates.

Pressable

Pressable could have earned an honorable mention if it wasn't for some uptime issues. They found themselves just below my 99.% expectation. They handled Blitz without issue and LoadStorm looked pretty good except wp-login had some what I imagine was security related issues.

Pressidium

I'm running out of positive adjectives to say how well Pressidium has done this year. A perfect LoadStorm test with zero errors, the lowest peak response time and lowest average response time. Followed up by a near perfect Blitz test. Top tier for sure.

PressLabs

PressLabs was the only company to earn an honorable mention. They had a bit of issues in the LoadStorm related to wp-login of course, but other than that put on an excellent performance.

SiteGround [Reviews]

In an odd twist of fate, I accidentally ran the same Blitz test on their lower priced cloud platform and it did better than the dedicated server. The shared infrastructure can often have far more powerful hardware backing it than dedicated machines and that's one of the interesting results. For large bursts, it may work better. Overall, this plan did pretty well, but LoadStorm clearly overloaded the server a bit too much to earn any special recognition.

$101-200/Month WordPress Hosting Performance Benchmarks (2016)

LoadStormLogo

Sponsored by LoadStorm. The easy and cost effective load testing tool for web and mobile applications.

The full company list, product list, methodology, and notes can be found here

This post focuses only on the results of the testing in the $101-200/month price bracket for WordPress Hosting.

$101-200/Month WordPress Hosting Products

review_signal_table_200

$101-200/Month WordPress Hosting Performance Benchmarks Results

1. Load Storm

Test 500-4000 Concurrent Users over 30 Minutes, 10 Minutes at Peak

Company Total Requests Total Errors Peak RPS Average RPS Peak Response Time(ms) Average Response Time(ms) Total Data Transferred (GB) Peak Throughput (MB/s) Average Throughput (MB/s)
A2 363070 163790 264.15 201.71 15443 6857 11.75 13.88 6.528
BlueHost 322139 166336 267.9 178.97 20999 9268 9.42 7.09 5.24
Conetix 341733 145110 243.3 189.85 16202 7347 11.74 13.87 6.52
Kinsta 546252 0 425.67 303.47 9078 286 31.47 24.95 17.48
LiquidWeb 635893 76 490.78 353.27 15097 360 31.3 25.19 17.39
Pressable 724499 1090 562.12 402.5 15024 447 30.91 26.07 17.17
Pressidium 563624 0 435.43 313.12 3561 272 30.82 24.44 17.12
Pressjitsu 434368 41339 339.37 241.32 15605 3173 22.5 18.67 12.5

Discussion of Load Storm Test Results

KinstaLiquidWeb [Reviews], Pressable, and Pressidium had no problems with this test.

A2 Hosting [Reviews], BlueHost [Reviews], Conetix, and Pressjitsu struggled with this test. BlueHost struggled off the bat. A2 and Conetix struggled a couple minutes in. Pressjitsu made it about 12 minutes in before it started erroring, but it had increasing load times starting around 6 minutes in. They all lasted varying amounts of time, but none were ready to handle this sort of load.

2. Blitz.io

Test 1-3000 Concurrent Users over 60 seconds

Blitz Test Quick Results Table

Company Hits Errors Timeouts Average Hits/Second Average Response Time Fastest Response Slowest Response
A2 120 43508 21784 2 518 304 733
BlueHost 28568 11753 7945 476 929 192 1889
Conetix 155 16827 13990 3 1470 872 2184
Kinsta 81397 3 0 1357 84 83 85
LiquidWeb 81393 47 10 1357 80 76 118
Pressable 77652 0 4 1294 134 141 133
Pressidium 85916 6 0 1432 27 25 31
Pressjitsu 67297 5833 0 1122 208 205 236

Discussion of Blitz Test 1 Results

This test is just testing whether the company is caching the front page and how well whatever caching system they have setup is performing (generally this hits something like Varnish or Nginx).

Who performed without any major issues?

KinstaLiquidWeb [Reviews], Pressable, and Pressidium all handled this test without issue, again.

Who had some minor issues?

Pressjitsu kept a flat response time but had a lot of errors start to build as the test scaled up. Might have been a security measure blocking it.

Who had some major issues?

BlueHost [Reviews] managed to last about 22 seconds before it started to be impacted by the load.

A2 Hosting and Conetix were overloaded almost immediately.

3. Uptime Monitoring

Both uptime monitoring solutions were third party providers that offer free services. UptimeRobot was paid for and monitoring on a 1 minute interval. All the companies were monitored over approximately two months (May-June 2016).

Uptime Robot & StatusCake

Company StatusCake UptimeRobot
A2 99.64 100
BlueHost 100 99.99
Conetix 99.52 99.7
Kinsta 99.98 99.99
LiquidWeb 100 100
Pressable 99.96 99.94
Pressidium 99.97 99.99
Pressjitsu 99.99 99.99

Conetix had some uptime issues getting recorded for 99.52% and 99.7% on StatusCake and UptimeRobot respectively.

A2 had a very strange recording with UptimeRobot showing 100% and StatusCake recording 99.64%.

Everyone else maintained above 99.9% on both monitors.

4. WebPageTest.org

Every test was run with the settings: Chrome Browser, 9 Runs, native connection (no traffic shaping), first view only.

Company WPT Dulles WPT Denver WPT LA WPT London WPT Frankfurt WPT South Africa
A2 0.924 0.654 1.199 1.554 1.989 5.118
BlueHost 0.969 0.588 0.988 1.684 2.006 6.23
Conetix 2.703 2.026 2.194 3.372 3.339 6.964
Kinsta 0.817 0.577 0.982 1.15 1.721 5.081
LiquidWeb 0.887 0.578 1.059 1.179 1.748 4.227
Pressable 0.969 0.738 1.135 1.493 1.95 7.669
Pressidium 0.639 0.627 1.174 1.187 1.705 5.303
Pressjitsu 0.915 0.677 0.87 1.302 1.786 6.433
Company WPT Singapore WPT Shanghai WPT Japan WPT Sydney WPT Brazil
A2 2.618 22.224 2.114 2.592 2.162
BlueHost 2.247 22.406 1.937 1.755 2.22
Conetix 3.092 22.465 2.818 1.493 3.448
Kinsta 2.054 22.743 2.064 1.704 2.345
LiquidWeb 2.215 22.378 1.983 1.977 1.823
Pressable 2.476 22.395 2.146 2.879 2.479
Pressidium 2.08 22.461 2.053 1.893 1.803
Pressjitsu 2.172 22.317 1.701 1.871 2.19

Everyone was pretty fast around the world without huge red flags anywhere.

Conetix had slow scores to a lot of locations, but thankfully they were the fastest in Sydney (because they are focused on the Australian market and based there).

5. WPPerformanceTester

Company PHP Bench [Seconds] (lower=faster) WP Bench [Queries Per Second](higher=faster)
A2 9.336 1440.92
BlueHost 12.276 956.94
Conetix 12.019 418.76
Kinsta 11.458 330.58
LiquidWeb 7.122 1102.54
Pressable 10.788 514.13
Pressidium 10.739 281.14
Pressjitsu 12.3 574.38

At this mid-range tier we see pretty much only VPS/Dedicated and cloud/clustered solutions. LiquidWeb's VPS again got one of the fastest PHP Bench scores I've seen recorded. The VPS/Dedicateds also generally put up much faster WP Bench scores with A2 leading the way with their dedicated server. The Cloud/Clustered solutions were around 500 and below (Kinsta, Pressable, Pressidium). The only exception was Conetix which was a VPS.

Conclusion

Top Tier WordPress Hosting Performance

review_signal_2016_trophy_200

KinstaLiquidWeb [Reviews], Pressable, and Pressidium were the top tier in the $101-200/month price range.

Individual Host Analysis

A2 Hosting [Reviews]

The bright spot in this test was the WP Bench test where this dedicated server was way faster than the competition. The raw power of a dedicated machine is nice, but unless it's got all the extra caching software that the top tier hosts were running, it unfortunately fell flat in the load tests.

BlueHost [Reviews]

Another disappointing performance in the load tests. The uptime and other tests were fine.

Conetix

Overall, they didn't perform that well. Uptime wasn't on par and the load test results were disappointing. The only bright spot was they were the fastest in Australia.

(9/19/2019 Update) Conetix have issued their own statement regarding Review Signal's test and why they believe this methodology doesn't accurately represent their performance and why a unique Australian perspective is required when evaluating them. I recommend reading the full details.

Kinsta

Kinsta continues to earn top tier status. I can't find anything to say beyond the fact they performed near perfectly, again.

LiquidWeb [Reviews]

LiquidWeb's lower priced plan performed spectacularly, their higher end product only continued that trend. They had a bracket leading PHP bench, perfect uptime, and aced the load tests. LiquidWeb has easily gone from brand new to top tier WordPress hosting status this year.

Pressable

Pressable continues its trend of excellent load tests, but at this tier they put everything together and earned themselves top tier status.

Pressidium

Another test, another top tier performance. Not much to say beyond, excellent.

Pressjitsu

Pressjitsu did better than the other companies that didn't earn top tier status, but found themselves clearly below the top tier with some struggles in the load tests. It seems like security may have messed up the blitz test but the same can't be said about the LoadStorm which showed real signs of stress. It seems like a good foundation but they need to just get everything running a bit better to earn themselves the top tier recognition; hopefully next year.

$51-100/Month WordPress Hosting Performance Benchmarks (2016)

LoadStormLogo

Sponsored by LoadStorm. The easy and cost effective load testing tool for web and mobile applications.

The full company list, product list, methodology, and notes can be found here

This post focuses only on the results of the testing in the $51-100/month price bracket for WordPress Hosting.

$51-100/Month WordPress Hosting Products

review_signal_table_100_updated


$51-100/Month WordPress Hosting Performance Benchmarks Results

1. Load Storm

Test 500-3000 Concurrent Users over 30 Minutes, 10 Minutes at Peak

Company Total Requests Total Errors Peak RPS Average RPS Peak Response Time(ms) Average Response Time(ms) Total Data Transferred (GB) Peak Throughput (MB/s) Average Throughput (MB/s)
BlueHost 322139 166336 267.9 178.97 20999 9268 9.425 7.086 5.236
CloudWays Amazon 306701 73421 214.07 170.39 15256 4810 13.9 10.05 7.723
CloudWays Google 267495 128912 199.23 148.61 15392 7341 8.35 6.595 4.639
Kinsta 416335 544 324.57 231.3 15059 317 24.01 19.91 13.34
LightningBase 456430 0 356.3 253.57 3909 261 23.65 19.41 13.14
LiquidWeb 520072 2745 408.3 288.93 15322 525 24.04 19.69 13.35
Media Temple 486702 8588 397.55 270.39 16001 582 25.43 23.08 14.13
Pagely 392898 1952 298.8 218.28 15178 1593 21.38 16.85 11.88
Pantheon 409962 57051 325.53 227.76 11682 762 20.74 17.97 11.52
Pressable 569095 0 441.43 316.16 3152 239 24.35 20.19 13.53
Pressidium 429538 0 335.78 238.63 3030 306 16.11 13.26 8.951
SiteGround 449038 742 352.05 249.47 11247 383 22.93 19.26 12.74

Discussion of Load Storm Test Results

KinstaLightningBaseLiquidWeb [Reviews], Pressable, Pressidium and SiteGround [Reviews] all handled this test without any serious issues.

MediaTemple [Reviews] had some minor issues with spikes and increasing average response times.

Pagely [Reviews] had some spikes but more concerning was the increased response times which were averaging around 3000ms during the 10 minute peak of the test. It kept the website up and error rate low enough (0.5%), but it was definitely struggling to keep up.

BlueHost [Reviews], CloudWays [Reviews] (Amazon + Google) and Pantheon [Reviews] all struggled with this load test. BlueHost crashed (85% error rate). CloudWays Google had 48% errors. Amazon fared better with only 24%. Pantheon had the lowest error rate at 14% but all of them were unacceptably high along with increase response times.

2. Blitz.io

Test 1-2000 Concurrent Users over 60 seconds

Blitz Test Quick Results Table

Company Hits Errors Timeouts Average Hits/Second Average Response Time Fastest Response Slowest Response
BlueHost 28901 714 2710 482 654 185 1562
CloudWays Amazon 55678 906 0 928 24 3 106
CloudWays Google 38278 16248 158 638 102 83 226
Kinsta 54273 7 0 905 84 83 86
LightningBase 54946 0 0 916 71 71 73
LiquidWeb 54574 0 4 910 78 77 82
Media Temple 44598 442 85 743 261 195 614
Pagely 57828 1 0 964 13 2 81
Pantheon 55499 0 0 925 61 60 64
Pressable 51781 0 0 863 135 134 136
Pressidium 57348 1 0 956 27 25 30
SiteGround 83437 0 0 1391 58 58 60

Discussion of Blitz Test 1 Results

This test is just testing whether the company is caching the front page and how well whatever caching system they have setup is performing (generally this hits something like Varnish or Nginx).

I also mistakenly ran an extra thousand users against SiteGround (1-3000), but since they performed perfectly, I figured why not just leave it. The chance for random network timeouts is always there, they got a perfect score, I let them keep it. That's why their numbers look higher than everyone else's.

Who performed without any major issues?

KinstaLightningBaseLiquidWeb [Reviews], Pagely [Reviews], PantheonPressable, Pressidium and SiteGround [Reviews] all handled this test without any serious issues.

Who had some minor issues?

MediaTemple [Reviews] had some minor issues with load starting to impact response times and some errors/timeouts at the end of the test.

CloudWays (Amazon) managed to keep the server up but started to lag around 35 seconds in with some errors at the very end.

Who had some major issues?

BlueHost [Reviews] and CloudWays (Google) both failed this test.

3. Uptime Monitoring

Both uptime monitoring solutions were third party providers that offer free services. UptimeRobot was paid for and monitoring on a 1 minute interval. All the companies were monitored over approximately two months (May-June 2016).

Uptime Robot & StatusCake

Company StatusCake UptimeRobot
BlueHost 99.98 99.98
CloudWays Amazon 100 100
CloudWays Google 99.99 99.99
Kinsta 99.99 100
LightningBase 100 100
LiquidWeb 100 100
Media Temple 99.94 99.97
Pagely 100 100
Pantheon 100 100
Pressable 99.93 99.95
Pressidium 100 99.99
SiteGround 100 100

I can happily say every single company kept their servers up.

4. WebPageTest.org

Every test was run with the settings: Chrome Browser, 9 Runs, native connection (no traffic shaping), first view only.

Company WPT Dulles WPT Denver WPT LA WPT London WPT Frankfurt WPT South Africa
BlueHost 0.94 0.813 0.995 1.525 1.861 5.923
CloudWays Amazon 0.774 0.975 1.066 0.988 1.625 3.597
CloudWays Google 0.706 0.644 0.929 1.107 1.706 3.37
Kinsta 0.834 0.62 0.958 1.12 1.688 3.637
LightningBase 0.542 0.465 0.955 1.013 1.569 4.541
LiquidWeb 0.616 0.55 1.003 1.076 1.624 5.634
Media Temple 0.904 0.537 0.855 1.318 1.932 2.809
Pagely 0.808 0.542 1.04 1.137 1.675 5.583
Pantheon 0.856 0.508 0.955 1.051 1.704 5.628
Pressable 1.032 0.757 1.08 1.449 1.948 5.793
Pressidium 0.738 0.727 1.171 1.292 1.67 5.747
SiteGround 0.867 0.678 1.114 1.176 1.671 4.56
Company WPT Singapore WPT Shanghai WPT Japan WPT Sydney WPT Brazil
BlueHost 2.652 22.102 1.863 1.937 2.255
CloudWays Amazon 2.236 23.404 1.781 1.75 1.752
CloudWays Google 2.031 22.418 2.026 1.609 1.793
Kinsta 2.235 24.017 2.109 1.602 1.851
LightningBase 2.227 22.437 1.683 1.968 1.612
LiquidWeb 2.335 23.238 1.885 1.96 1.635
Media Temple 2.19 22.265 1.814 2.101 2.091
Pagely 2.415 23.124 1.914 2.103 1.943
Pantheon 2.093 25.209 1.781 1.975 1.804
Pressable 2.382 23.897 2.234 2.821 2.132
Pressidium 2.245 23.303 2.061 1.785 1.747
SiteGround 2.309 22.746 2.017 2.935 1.907

LightningBase put up the fastest individual score of any bracket this year in this test with a blazingly fast 0.465ms average response in Denver. Other than that, nothing special here other than all these companies seemed capable of delivering content fast pretty much everywhere in the world except Shanghai.

5. WPPerformanceTester

Company PHP Bench [Seconds] (lower=faster) WP Bench [Queries Per Second](higher=faster)
BlueHost 11.655 713.78
CloudWays Amazon 10.993 324.99
CloudWays Google 11.192 327.33
Kinsta 11.333 318.47
LightningBase 10.537 1067.24
LiquidWeb 7.177 1084.6
Media Temple 13.9 98.85
Pagely 10.102 165.86
Pantheon 11.687 202.92
Pressable 10.952 492.61
Pressidium 10.749 240.67
SiteGround 11.522 1030.93

LiquidWeb put up one of the fastest scores on the PHP Bench at 7.177. Everyone else fell into the 10-14 range we generally see.

The WP Bench saw some slow scores from MediaTemple and Pagely and handful breaking the 1000 barrier in LightningBase, LiquidWeb, and SiteGround. Interestingly, the trend seems to be slower as you go up in price as you get more non-local databases.

Conclusion

This is the last really crowded bracket as we go up in price. It's sitting right at the border of entry level plans and the more serious stuff. This is the first tier that tested plans more heavily than any plan last year as well. The results were also very encouraging.

Top Tier WordPress Hosting Performance

review_signal_2016_trophy_100

KinstaLightningBaseLiquidWeb [Reviews], Pressable, Pressidium and SiteGround [Reviews] all earned top tier WordPress Hosting for the $51-100/month tier.

Honorable Mentions

MediaTemple [Reviews] and Pagely [Reviews] earn honorable mentions. They had some minor issues in the LoadStorm test and MediaTemple had some minor issues in the Blitz test.

Individual Host Analysis

BlueHost [Reviews]

BlueHost fell short again in the load tests.

CloudWays [Reviews] (Amazon + Google)

CloudWays is always interesting because you can compare head to head performance on different cloud platforms. I would pretty confidently say that Amazon outperformed Google in this instance with similar specs (although Amazon charges more).

Kinsta

Kinsta's entry level plan put on a fantastic performance. The higher end providers are starting to show up in this price tier and really showing why they charge their premium prices. Kinsta easily earned top tier status.

LightningBase

LightningBase's most expensive plan that we tested this year (although they offer higher ones), and for the third consecutive price tier (and year), they handled the tests flawlessly. A literaly perfect score for LightningBase: 100% uptime on both monitors and 0 errors on all load tests. Simply perfection. Undoubtedly a top tier WordPress Host.

LiquidWeb [Reviews]

LiquidWeb is a newcomer to this testing and this is their entry level plan. Boy did they make a positive splash. 100% uptime across the board and excellent load testing scores. They also had the fastest PHP Bench in this bracket (and third fastest of any company this year). They have a fantastic reputation here at Review Signal on our reviews section, I can confidently say they also have a top tier WordPress Hosting product to boot.

MediaTemple [Reviews]

Media Temple earned an honorable mention which is a step in the right direction. They had some minor problems with the load tests. No major concerns, just need to figure out security issues and minor performance stuff to make them top tier again.

Pagely [Reviews]

Pagely was a bit of a disappointment. They've been in the top tier the past years but fell to an honorable mention this year. The increased LoadStorm test seemed to put some strain on the server and caused spikes and increased load times. Everything else looked very good like previous years.

Pantheon [Reviews]

Pantheon, like Pagely, struggled with the LoadStorm test, but to a larger degree this year. It knocked them out of the top tier and didn't even earn an honorable mention in this price bracket. Everything else looked very good.

Pressable

Pressable showed up in a big way. No problems in any of the tests. Zero errors on both load tests. Easily in the top tier for this price bracket.

Pressidium

One error, nearly perfect uptime. Hard to really expect a better performance. Pressidium's entry level plan remains in the top tier for another year.

SiteGround [Reviews]

I screwed up with the Blitz load test and they got a perfect score with an extra thousand users which is impressive. They had a small spike at the start of the LoadStorm test but otherwise put on a flawless performance with 100% uptime on both monitors as well. SiteGround is in the top tier.

$25-50/Month WordPress Hosting Performance Benchmarks (2016)

LoadStormLogo

Sponsored by LoadStorm. The easy and cost effective load testing tool for web and mobile applications.

The full company list, product list, methodology, and notes can be found here

This post focuses only on the results of the testing in the $25-50/month price bracket for WordPress Hosting.

$25-50/Month WordPress Hosting Products

review_signal_table_50

$25-50/Month WordPress Hosting Performance Benchmarks Results

1. Load Storm

Test 500-2000 Concurrent Users over 30 Minutes, 10 Minutes at Peak

Company Total Requests Total Errors Peak RPS Average RPS Peak Response Time(ms) Average Response Time(ms) Total Data Transferred (GB) Peak Throughput (MB/s) Average Throughput (MB/s)
A2 193764 68658 148.28 107.65 17563 6541 7.647 11.37 4.248
CloudWays DO 196963 54589 148.48 109.42 15809 5841 8.474 7.384 4.708
CloudWays Vultr 207994 50049 144.13 115.55 16187 5339 9.439 8.398 5.244
Conetix 169625 116960 134.43 94.24 18510 8578 2.635 3.898 1.464
LightningBase 315348 1 238.4 175.19 3567 272 16.34 13.47 9.077
Pantheon 268164 866 205.5 148.98 14422 315 6466 4927 3592
Pressable 394405 26 294.6 219.11 15101 226 16.4 13.32 9.111
Pressjitsu 300931 3913 228.47 167.18 11121 502 16.86 14.29 9.365
SiteGround 300999 0 232.75 167.22 10926 462 15.83 14.35 8.972
WP Land 294459 14976 235.63 163.59 15422 864 15.15 14.04 8.417
WPEngine 348796 26572 270.23 193.78 15091 311 14.95 11.38 8.307
WPOven 288369 0 217.85 160.21 5815 283 16.64 13.63 9.245


Discussion of Load Storm Test Results

Many companies handled this test without any sort of struggle: LightningBasePantheon [Reviews], PressableSiteGround [Reviews], and WPOven.com. In fact, SiteGround and WPOven managed to have zero errors, while LightningBase had 1. Truly impressive performances put on by these companies.

Pressjitsu struggled a little bit. There were some errors and increased response times at the start of the test. It managed to stabilize for the last 22 minutes as load increased though.

WPEngine [Reviews] and WP.land struggled a bit more than Pressjitsu, but didn't completely fall apart. Both seemed to be having issues with the wp-login page, possibly security related.

A2 Hosting [Reviews], CloudWays [Reviews] (Digital Ocean & Vultr), and Conetix did not do well during this test. High error rates and slow response times show they were not equipped to handle this type of load.


2. Blitz.io

Test 1-1000 Concurrent Users over 60 seconds

Blitz Test Quick Results Table

Company Hits Errors Timeouts Average Hits/Second Average Response Time Fastest Response Slowest Response
A2 51 14265 7339 1 800 411 1047
CloudWays DO 28328 13 16 472 32 25 91
CloudWays Vultr 28763 3 0 479 24 24 25
Conetix 2359 1097 6070 39 1412 763 2410
LightningBase 27460 0 0 458 72 71 72
Pantheon 27755 0 0 463 61 60 67
Pressable 25914 0 2 432 134 134 136
Pressjitsu 23902 481 0 398 205 205 206
SiteGround 26623 1 26 444 86 71 255
WP Land 28352 0 1 473 39 38 40
WPEngine 26281 69 0 438 117 114 127
WPOven 26687 0 0 445 103 101 104

Discussion of Blitz Test 1 Results

This test is just testing whether the company is caching the front page and how well whatever caching system they have setup is performing (generally this hits something like Varnish or Nginx).

Who performed without any major issues?

CloudWays (Digital Ocean & Vultr), LightningBasePantheonPressableSiteGround [Reviews], WPEngine [Reviews], WP.land, and WPOven.com all handled the blitz test without any significant issues.

Who had some minor issues?

Pressjitsu again had what seems to be security related issues. A perfect flat response time but some timeouts at the end of the test.

Who had some major issues?

A2 Hosting and Conetix both failed the Blitz test.

3. Uptime Monitoring

Both uptime monitoring solutions were third party providers that offer free services. UptimeRobot was paid for and monitoring on a 1 minute interval. All the companies were monitored over approximately two months (May-June 2016).

Uptime Robot & StatusCake

Company StatusCake UptimeRobot
A2 97.91 99.35
CloudWays DO 100 100
CloudWays Vultr 99.95 99.87
Conetix 99.92 99.93
LightningBase 100 100
Pantheon 100 100
Pressable 99.91 99.92
Pressjitsu 99.78 99.65
SiteGround 99.99 100
WP Land 99.92 100
WPEngine 100 99.99
WPOven 100 100

A2 had significant downtime issues with StatusCake recording 97.91% and UptimeRobot recording 99.35% uptime. The CloudWays Vultr server had some issues with UptimeRobot recording 99.87%. Pressjitsu also had some uptime problems with StatusCake recording 99.78% and UptimeRobot 99.65%.

Everyone else was above 99.9% on both monitors including CloudWays Digital Ocean, LightningBase, Pantheon, WPOven all recording perfect 100%/100% scores.

4. WebPageTest.org

Every test was run with the settings: Chrome Browser, 9 Runs, native connection (no traffic shaping), first view only.

Company WPT Dulles WPT Denver WPT LA WPT London WPT Frankfurt WPT South Africa
A2 0.879 0.747 1.237 1.61 2.029 5.657
CloudWays DO 0.836 0.58 1.031 1.221 1.668 7.08
CloudWays Vultr 0.713 0.676 1.087 1.109 1.636 7.643
Conetix 2.328 2.078 2.242 3.845 3.497 8.69
LightningBase 0.567 0.563 1.054 1.067 1.511 4.199
Pantheon 0.86 0.583 1.024 1.259 1.649 7.625
Pressable 0.945 0.715 1.162 1.533 2.013 9.377
Pressjitsu 0.94 0.549 0.93 1.33 1.912 6.288
SiteGround 0.838 0.655 1.043 1.063 1.693 6.927
WP Land 0.816 0.622 1.002 1.189 1.693 3.307
WPEngine 0.872 0.523 0.939 1.199 1.796 4.434
WPOven 0.85 0.534 1.093 1.452 1.79 4.844
Company WPT Singapore WPT Shanghai WPT Japan WPT Sydney WPT Brazil
A2 2.956 22.788 2.231 2.609 2.342
CloudWays DO 2.123 22.42 1.898 1.713 1.755
CloudWays Vultr 2.223 22.573 1.832 1.7 1.797
Conetix 2.027 23.425 2.63 1.308 3.56
LightningBase 2.041 23.977 1.717 1.848 1.667
Pantheon 2.194 22.605 1.769 1.661 1.784
Pressable 2.451 22.258 2.194 3.079 2.049
Pressjitsu 2.046 22.352 1.73 1.416 2.055
SiteGround 2.245 23.087 1.806 2.27 1.855
WP Land 2.157 22.428 1.872 1.658 1.784
WPEngine 2.121 24.584 1.87 2.051 1.863
WPOven 2.089 2.82 1.796 1.712 1.859

What I learned was getting traffic into China is terrible. Nobody really did well on the Shanghai location except WPOven which somehow didn't get the delay that every other company experienced. South Africa is also really slow. Most servers were US based but were delivering content to most corners of the world in about 2 seconds or less which is impressive.

Conetix is an Australian focused company and they delivered to Sydney faster than anyone which is a relief that the geographic advantage is real. Beyond the Australian market the connectivity seemed slower to just about every other location. Australia has notoriously bad connectivity though, so I can see the advantage of having a company specializing in the local market.

I wish I could compare averages against last year except they removed one of the testing locations (Miami) and I did a global test instead because that was something people wanted to see.

The US connectivity is very fast though, with everyone delivering to Dulles(VA) and Denver (CO) in under a second (minus the Australian server) with LA at about one second exactly for everyone.

5. WPPerformanceTester

Company PHP Bench [Seconds] (lower=faster) WP Bench [Queries Per Second](higher=faster)
A2 18.456 592.77
CloudWays DO 15.028 353.98
CloudWays Vultr 13.145 392.62
Conetix 12.833 410.51
LightningBase 10.795 1353.18
Pantheon 12.292 189.54
Pressable 11.062 525.21
Pressjitsu 12.771 648.09
SiteGround 11.414 1109.88
WP Land 13.491 1094.09
WPEngine 13.494 406.17
WPOven 9.412 690.61

In this tier, there was a lot more normalized spread on the PHP Bench with most people being within the 10-14 second range we saw last year. WPOven lead the pack at 9.4. A2 was the slowest at 18.456.

The WP Bench scores varied a lot, again. LightningBase had another blazingly fast score of 1353.18. Siteground and WPLand also broke the 1000 barrier, whereas last year's fastest was 889. At the bottom of the pack was Pantheon with 189.54, which I am sure they would say infrastructure plays a large role in. Anyone with a distributed/non-local SQL database will be slower by a lot. They would probably argue that's one of the trade-offs of scalability and based on their load testing performance, it would be hard to argue against.

Conclusion

A very crowded bracket with lots of competition. This range is still pretty entry level, not the cheapest stuff like the <$25/month plans I compared. But with increased price came better performances. Although two of the top tier companies in this bracket make up two of the three top tier performers in the cheapest bracket. But it is nice to see some loose price to performance correlation in the market. Many of these plans are the entry level for their respective companies.

One of the interesting things to watch was the VPSs in this range (A2, CloudWays, Pressjitsu). They were outperformed by the Shared/Cloud providers who can presumably burst more shared resources for any given site. So for spikey sites that expect to get a Reddit/Slashdot effect, there may be some advantage in being in that sort of environment (if you cant easily scale the VPS, which some providers make quite easy). But since these are dummy sites not really tested heavily over the two months, there is the potential for bad neighbors negatively impacting you too during such a spike, and then you might want your own isolated VPS. I can see arguments for for both sides.

Without further ado, I will tell you who had the best performance, who deserved an honorable mention and then analyze each host individually. I still don't believe in ranking in any particular order, only grouping companies by how well they performed.

Top Tier WordPress Hosting Performance

review_signal_2016_trophy_50

LightningBasePantheonPressableSiteGround [Reviews] and WPOven.com.

Honorable Mentions

Unfortunately, no company deserves honorable mention status which I give to companies that came close but weren't quite perfect or they looked like they were good but something external (generally security measures) interfered with the tests but from all other indications they seemed to be doing well.

The closest in this bracket would have been Pressjitsu, except they had uptime issues which I give no leeway for being under 99.9%.

Individual Host Analysis

A2 Hosting [Reviews]

I try to find bright spots in a company's performance, but A2 really didn't have one in this test. If you buy a VPS there is also no default way to install WordPress beyond the old fashioned DIY. You have to pay extra for Softaculous installer from the admin panel.

CloudWays [Reviews] Digital Ocean / Vultr

The most interesting part of CloudWays is being able to see the same stack tested on multiple providers. It's a small sample, but it looks like Vultr marginally outperforms Digital Ocean in performance. Although, Digital Ocean was more stable (again, small sample size to compare head to head). It was nice to see CloudWays do well with the Blitz tests and keep very good uptime, especially the Digital Ocean machine which was perfect.

Conetix

Conetix had good uptime and connection to Australia, their target market. They strongly using W3TC but it didn't come fully installed and I don't test anything beyond the default configuration because it gets into too much minutia and conflict with hosts about what could be done to improve scores. I also believe most people just stick with the default based on all the user testing I've seen across various fields. So the unfortunate results were the load test performances didn't look very good for them.

(9/19/2019 Update) Conetix have issued their own statement regarding Review Signal's test and why they believe this methodology doesn't accurately represent their performance and why a unique Australian perspective is required when evaluating them. I recommend reading the full details.

LightningBase

LightningBase put on basically a perfect performance. 100% uptime on both monitors. 0 errors on blitz, 1 error on loadstorm. Unequivocally, a top tier performance.

Pantheon [Reviews]

Pantheon showed up again, in a good way. They earned themselves a top tier performance accolade. They had a few errors at the start of the LoadStorm test, but beyond that aced everything.

Pressable

Pressable is back for the first time since my first testing in 2013, with new ownership (WordPress.com). They had had some good tech back then but it wasn't perfect and had some minor issues. I can happily say that has changed as they delivered a top tier performance this year with no issues in any test.

Pressjitsu

Pressjitsu felt like 2013 Pressable, the foundations of a really good company but just didn't get it all put together. The biggest problem was the sub 99.9% uptime. They had what appeared to be security measures mar the blitz test and had some errors at the start of the LoadStorm test but managed to stabilize for the duration and put on a good showing.

SiteGround [Reviews]

SiteGround got even better this year. They jumped up from honorable mention to top tier status. Their Blitz and LoadStorm tests both improved while everything else remained at a high level. An all around fantastic performance which deserved top tier status.

WPEngine [Reviews]

WPEngine fell slightly this year, it could have been a security issue with wp-login during the LoadStorm test, but there were too many errors to give it honorable mention status for this plan which it earned last year. Everything else looked good though.

WP.land

WP Land like WPEngine had too many problems during the LoadStorm test that it didn't earn honorable mention status. Everything else looked very good for them and it's great to see a strong new entrant.

WPOven.com

The knock on WPOven last year was their LoadStorm test. Everything else was perfect. I'm glad they maintained everything else, but this time they managed a perfect LoadStorm test to boot. A huge improvement and a very well deserved entry in the top tier of WordPress Hosts in the $25-50 range.

WordPress Hosting Performance Benchmarks (2016)

LoadStormLogo

Sponsored by LoadStorm. The easy and cost effective load testing tool for web and mobile applications.

2018 WordPress Hosting Performance Benchmarks is now live.

This is the fourth round of managed WordPress web hosting performance testing. You can see the original, 2014 version , and 2015 version.

Companies Tested

A2 Hosting [Reviews]
BlueHost [Reviews]
CloudWays [Reviews]
Conetix
DreamHost [Reviews]
FlyWheel [Reviews]
GoDaddy [Reviews]
Incendia Web Works
Kinsta
LightningBase
LiquidWeb [Reviews]
MediaTemple [Reviews]
Pagely [Reviews]
Pantheon [Reviews]
Pressable (Formerly ZippyKid)
Pressed.net
Pressidium
Pressjitsu
PressLabs
Hosting Agency (German)
SiteGround [Reviews]
Traffic Planet Hosting
WordPress.com VIP
WPEngine [Reviews]
WP.land
WPOven.com

Companies that didn't participate this round but did on previous rounds: WebHostingBuzzWPProntoNexcessA Small Orange [Reviews] and  WebSynthesis [Reviews].

Every plan was donated by the company for testing purposes with the strict stipulation that it would be the same as if any normal user signed up. There is a notes section at the bottom that details the minutiae of changes made to plans at the end of this post. Nearly every single company had security issues that I had to get around, so they worked to make sure my testing went through properly. Load testing often looks like an attack and it's the only way I can do these tests.

The Products

This year is a bit different than years past where every company and plan competed against one another. When I started the price gap was from $5/month to $29/month. Last year the gap was $5.95 to $299. I was only testing entry level plans but the market has dramatically changed since I first got started. Today, there is demand at many different price points and lots of companies have gone upscale with WordPress.com VIP at the top of the price bracket starting at $5,000/month. The only logical way to break things up was by price brackets. So below you will see the brackets and which companies participated. Specific details will be included on each bracket's write up.


<$25/m $25-50/m $51-100/m $101-200/m $201-500/m $500+/m
A2 Hosting A2 Hosting LiquidWeb A2 Hosting Kinsta Kinsta
Bluehost Conetix Bluehost Bluehost Media Temple Pagely
DreamHost LLC Lightning Base Cloudways (AWS ) Conetix Pagley Pantheon
Flywheel Pantheon Cloudways (Google) Kinsta Pantheon Pressable
GoDaddy Pressable Kinsta Liquid Web Pressable Pressidium
Incendia Web Works Pressjitsu Lightning Base Pressable Pressidium WordPress.com VIP
Lightning Base SiteGround Media Temple Pressidium Presslabs WP Engine
Media Temple WP Engine Pagely Pressjitsu SiteGround
Pressed WP.land Pantheon
Hosting Agency.de Cloudways (DigitalOcean) Pressable
SiteGround Cloudways (Vultr) Pressidium
Traffic Planet Hosting WPOven SiteGround
WP.land


Methodology

The question I tried to answer is how well do these WordPress hosting services perform? I tested each company on two distinct measures of performance: peak performance and consistency. I've also included a compute and database benchmark based on a WordPress plugin.

All tests were performed on an identical WordPress dummy website with the same plugins except in cases where hosts added extra plugins. Each site was monitored for approximately two months for consistency.

1. LoadStorm

LoadStorm was kind enough to give me resources to perform load testing on their platform and multiple staff members were involved in designing and testing these WordPress hosts. I created identical scripts for each host to load a site, login to the site and browse the site. Logged in users were designed to break some of the caching and better simulate real user load. The amount of users varies by cost.

2. Blitz.io

I used Blitz again to compare against previous results. This tests the static caching of the homepage. I increased the number of users based on monthly cost this time.

3. Uptime (UptimeRobot and StatusCake)

Consistency matters. I wanted to see how well these companies performed over a longer period of time. I used two separate uptime monitoring services over the course of a month to test consistency.

4. WebPageTest.org

WebPageTest with 9 runs, first view only, native connection. I tested from Dulles, Denver, Los Angeles, London, Frankfurt, South Africa, Singapore, Shanghai, Japan, Sydney, Brazil.

5. WPPerformanceTester (free plugin on WordPress.org)

I created a WordPress plugin to benchmark CPU, MySql and WordPress DB performance. The CPU/MySql benchmarks are testing the compute power. The WordPress component tests actually calling $wpdb and executing insert, select, update and delete queries.


Notes - Changes made to Hosting Plans

A2 - VPS Servers can't install WordPress out of the box without extra payment for Softaculous. Disabled recaptcha.

Conetix - disabled WordFence and Stream plugins.

SiteGround - fully enable SuperCacher plugin

GoDaddy - 24 database connection limit increased if you notify them of heavy load

CloudWays - disabled WordFence

WordPress.org Updates Hosting Recommendations, Nobody Knows Selection Criteria

I've railed about Drupal and WordPress Have Sold Us Out in terms of hosting recommendations before. We've been waiting a long time (around a year now?) for WordPress.org to do it's revamp of its hosting recommendation page.

The Winners

BlueHost, DreamHost, FlyWheel, SiteGround

I'm not shocked at all to see BlueHost somehow still manages to be at the very top (albeit the list is alphabetical). They've continuously survived being listed, I guess that's what a million dollars will do.

Where is the transparency?

They requested hosts submit a ridiculous amount of personal information. You can see the full survey below:

2016 WordPress Hosting Survey - WordPressorg

It asks some deeply private questions like number of employees, how many 30 day active paying customers you have, and how many net paying customers are you gaining or losing each month?

Mind you, as far as anyone can tell, Matt has complete control over who shows up, and Automattic bought the majority stake in a company competing in the WordPress hosting space, Pressable. They also run WordPress.com VIP. They are also an investor in WPEngine. So some of the most secretive numbers a company competing in this space might have are being disclosed potentially to multiple of their biggest competitors through a process with no transparency or even a person named to be responsible for it.

That alone is worrisome for the process, it should definitely be run independent of Matt.

Everything else needs to be explained too. Who is responsible for this revamp? What were the selection criteria? How often will it be updated? Will existing companies be continuously re-evaluated?

wordpress_org_listing

It's not clear who 'we' is. They say listing is arbitrary but then add criteria. I'm not sure they understanding what arbitrary means. Or maybe they simply ignore the criteria they mention. Maybe it's just a terrible joke? Just like the process (or lack thereof) that seems to be in place.

A lot of it is pretty subjective. design, tone, ease of WP auto-install, historical perception? BlueHost is still listed, which is has consistently been pretty poorly reviewed (along with just about all EIG brands) and continues a downward trend.

BlueHost_review_signal_rating_apr_2016

Furthermore, it's the same criteria that's been written since at least 2010.

So maybe saying it's arbitrary gives them as escape to list whomever they want, especially considering the financial considerations involved.

Newly Listed Companies

I tried to find some explanation for how the three new companies were selected, but there really isn't much to go on. DreamHost is a Silver Community Sponsor for WordCamp, but so is GoDaddy who did not make the cut.

FlyWheel only does WordPress, but DreamHost and SiteGround do a lot more.

DreamHost has a ton of forum threads on WordPress.org, SiteGround has only a few over 10 years. FlyWheel has one total.

I talked to someone at one of the newly listed hosted companies and they confirmed that the form was filled out and that was it. Also, there was no financial consideration involved with the listing.

Which is very nice to hear, but doesn't really inspire confidence in the recommendations.

I've aired my concern with BlueHost multiple times.

But what about the new companies and their ratings?

DreamHost has a 59% rating on Review Signal, which is ok, given the upper end of the shared hosting spectrum is SiteGround at 71%. FlyWheel, the specialized hosting company has the highest rating of any company at a whopping 85%.

So the new companies are all far better than BlueHost (41%). But there are other very highly rated companies that didn't make the cut. For example, WP Engine (72%) is probably the biggest  name not listed based on size, brand in the WP community and rating at Review Signal.

Conclusion

I'm glad there are some much better companies than Blue Host listed and at least one of them got there without paying for the privilege. There is still language about some donating a portion of the fee back, which makes you think it's still at least BlueHost.

I'm still unhappy with the lack of transparency of the entire process. The most influential place for people entering the WordPress community is recommending one very mediocre hosting company who has historically paid large sums to be listed and has a deep financial relationship with the person ultimately responsible for the recommendations. The revamp didn't change that.

I am disappointed and I don't expect to hear anything from WordPress.org/Matt clarifying the hosting page, again.


UPDATES

(5/13/2016)

There was a little discussion in the WordPress slack. macmanx is James Huff, an Automattic employee. Seems they wanted only 1 managed WordPress host. Other details include around 100 applications. And even in the WordPress slack, the first comment doubts that these are really the best (well, one which almost everyone assumes to be BlueHost).

james_huff_3_outta_4 James_Huff_hosting_recommendations

Managed WordPress Hosting Showdown – Performance Benchmarks Comparison

UPDATE: Round 2 of Testing (November 2014) is now available.

WordPress as a platform has become the most popular CMS around, claiming to power almost 19% of the web. As a result, Managed WordPress hosting has become a very popular niche. Many companies in the managed WordPress space are charging a very high premium over the traditional shared web hosting providers. So beyond the marketing speak, what are you really getting? Most promise to make your life easier with features like automatic updates, backups, and security. They also claim to have great performance. It's hard to test objectively the ease-of-use features. But we can measure performance. There weren't many performance benchmarks that I could find, and the ones I could were not very thorough. So I began by designing my own set of testing.

Companies Tested

A Small Orange* [Reviews]
Digital Ocean [Reviews]
GoDaddy* [Reviews]
Pagely
Pressable*
SiteGround*† [Reviews]
WebSynthesis* [Reviews]
WPEngine [Reviews]

*Company donated an account to test on. I checked to make sure I was on what appeared to be a normal server. GoDaddy had over 3000 domains on the same IP. SiteGround had 887 domains. A Small Orange was a VPS, so it should be isolated. Pressable and WebSynthesis didn't have any accounts on the same IP. I am not sure how isolated they are in their environments.

†Tests were performed with SiteGround's proprietary SuperCacher module turned on fully unless otherwise specified.

The Products

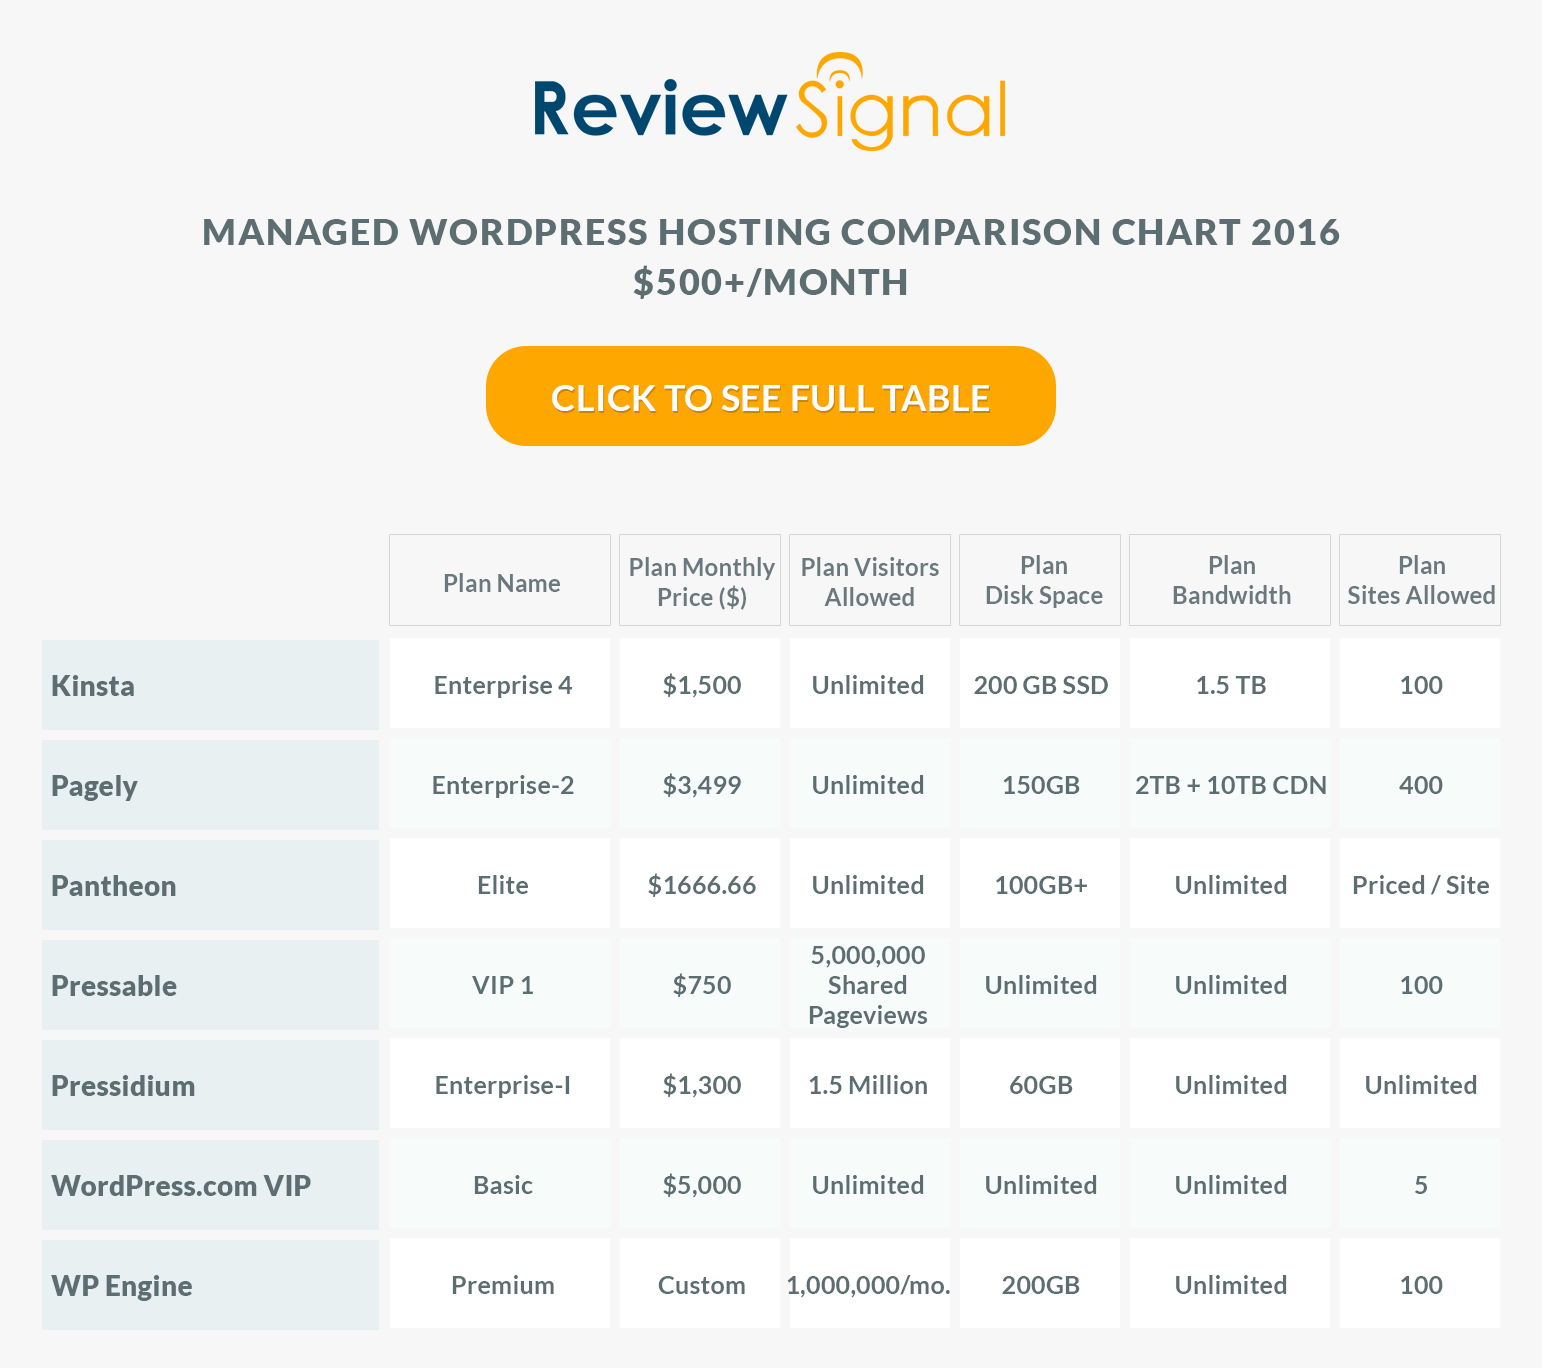
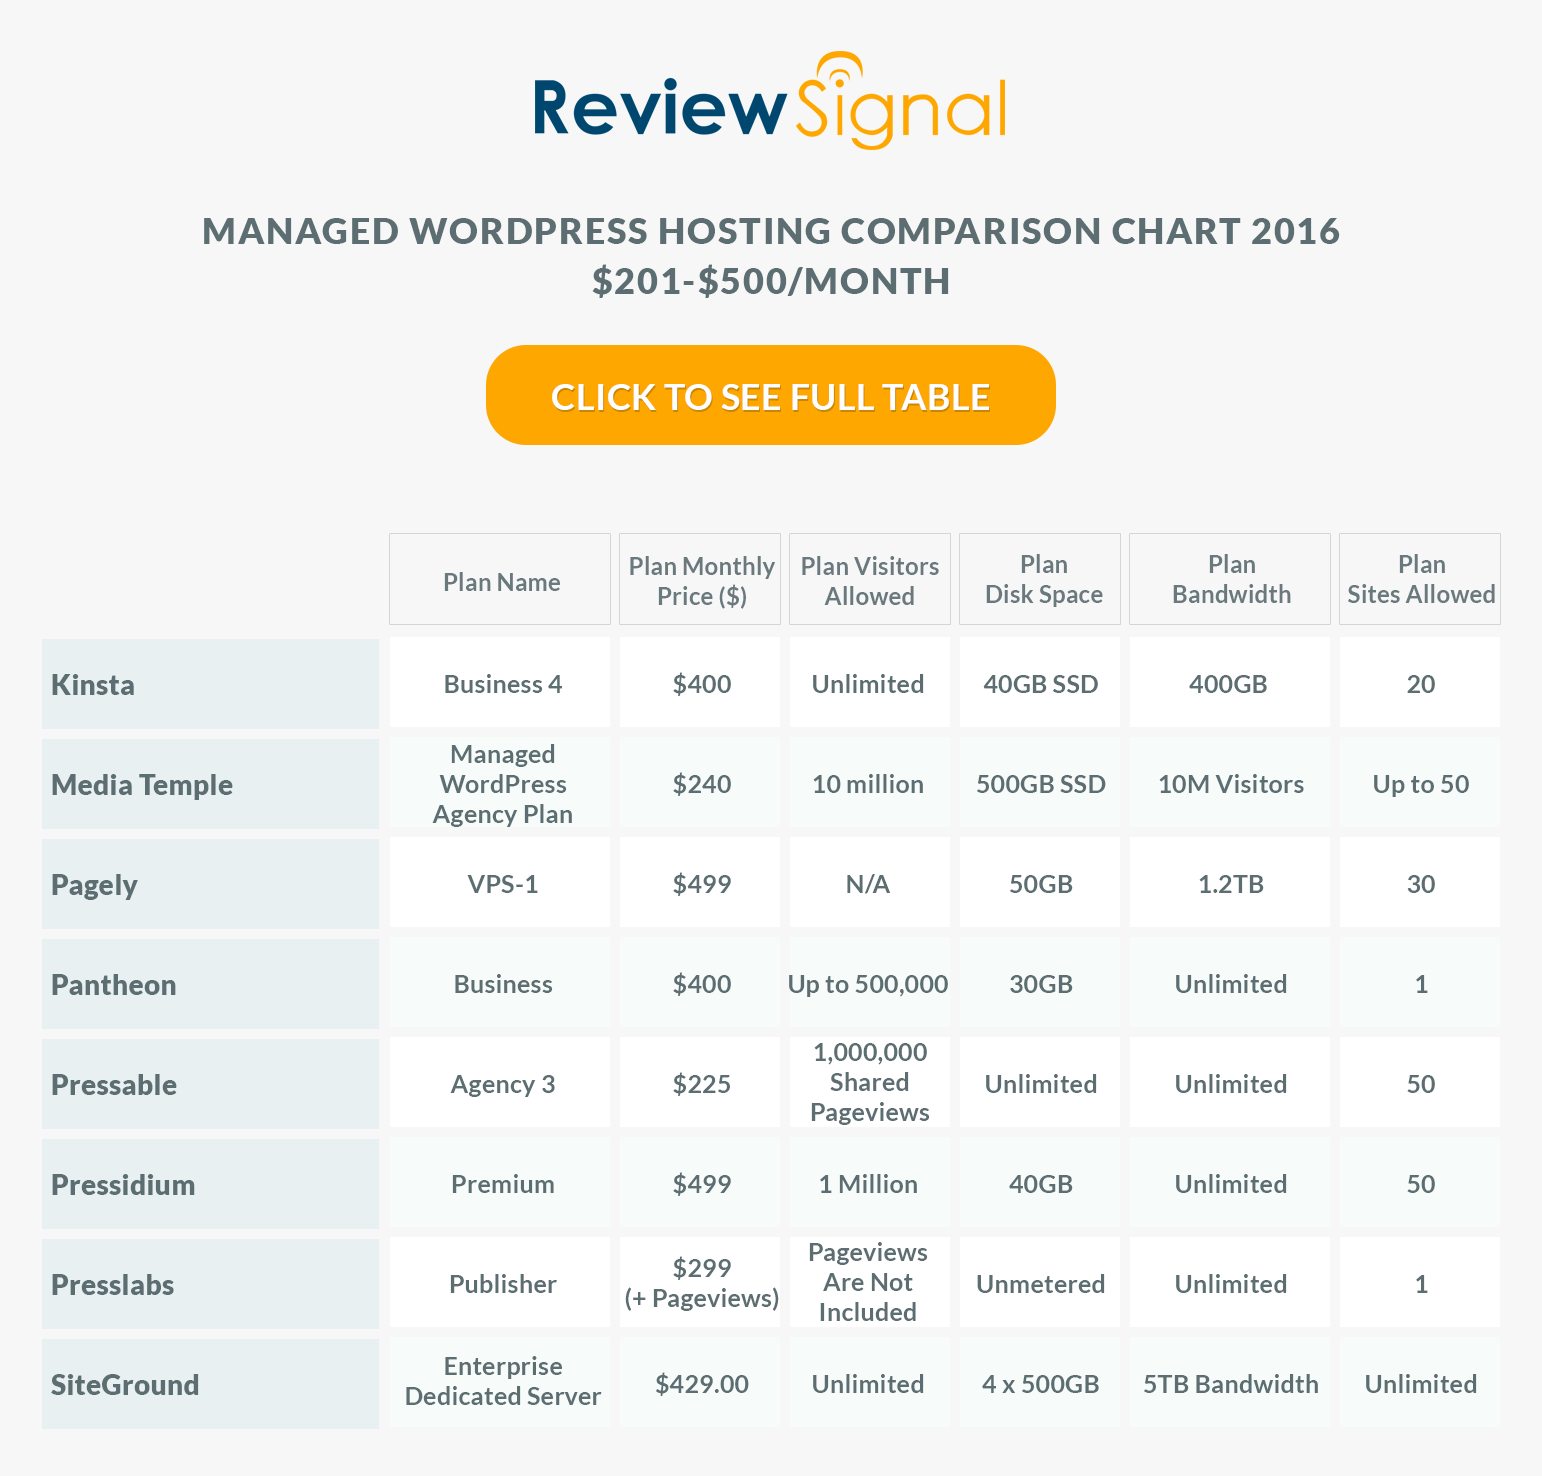
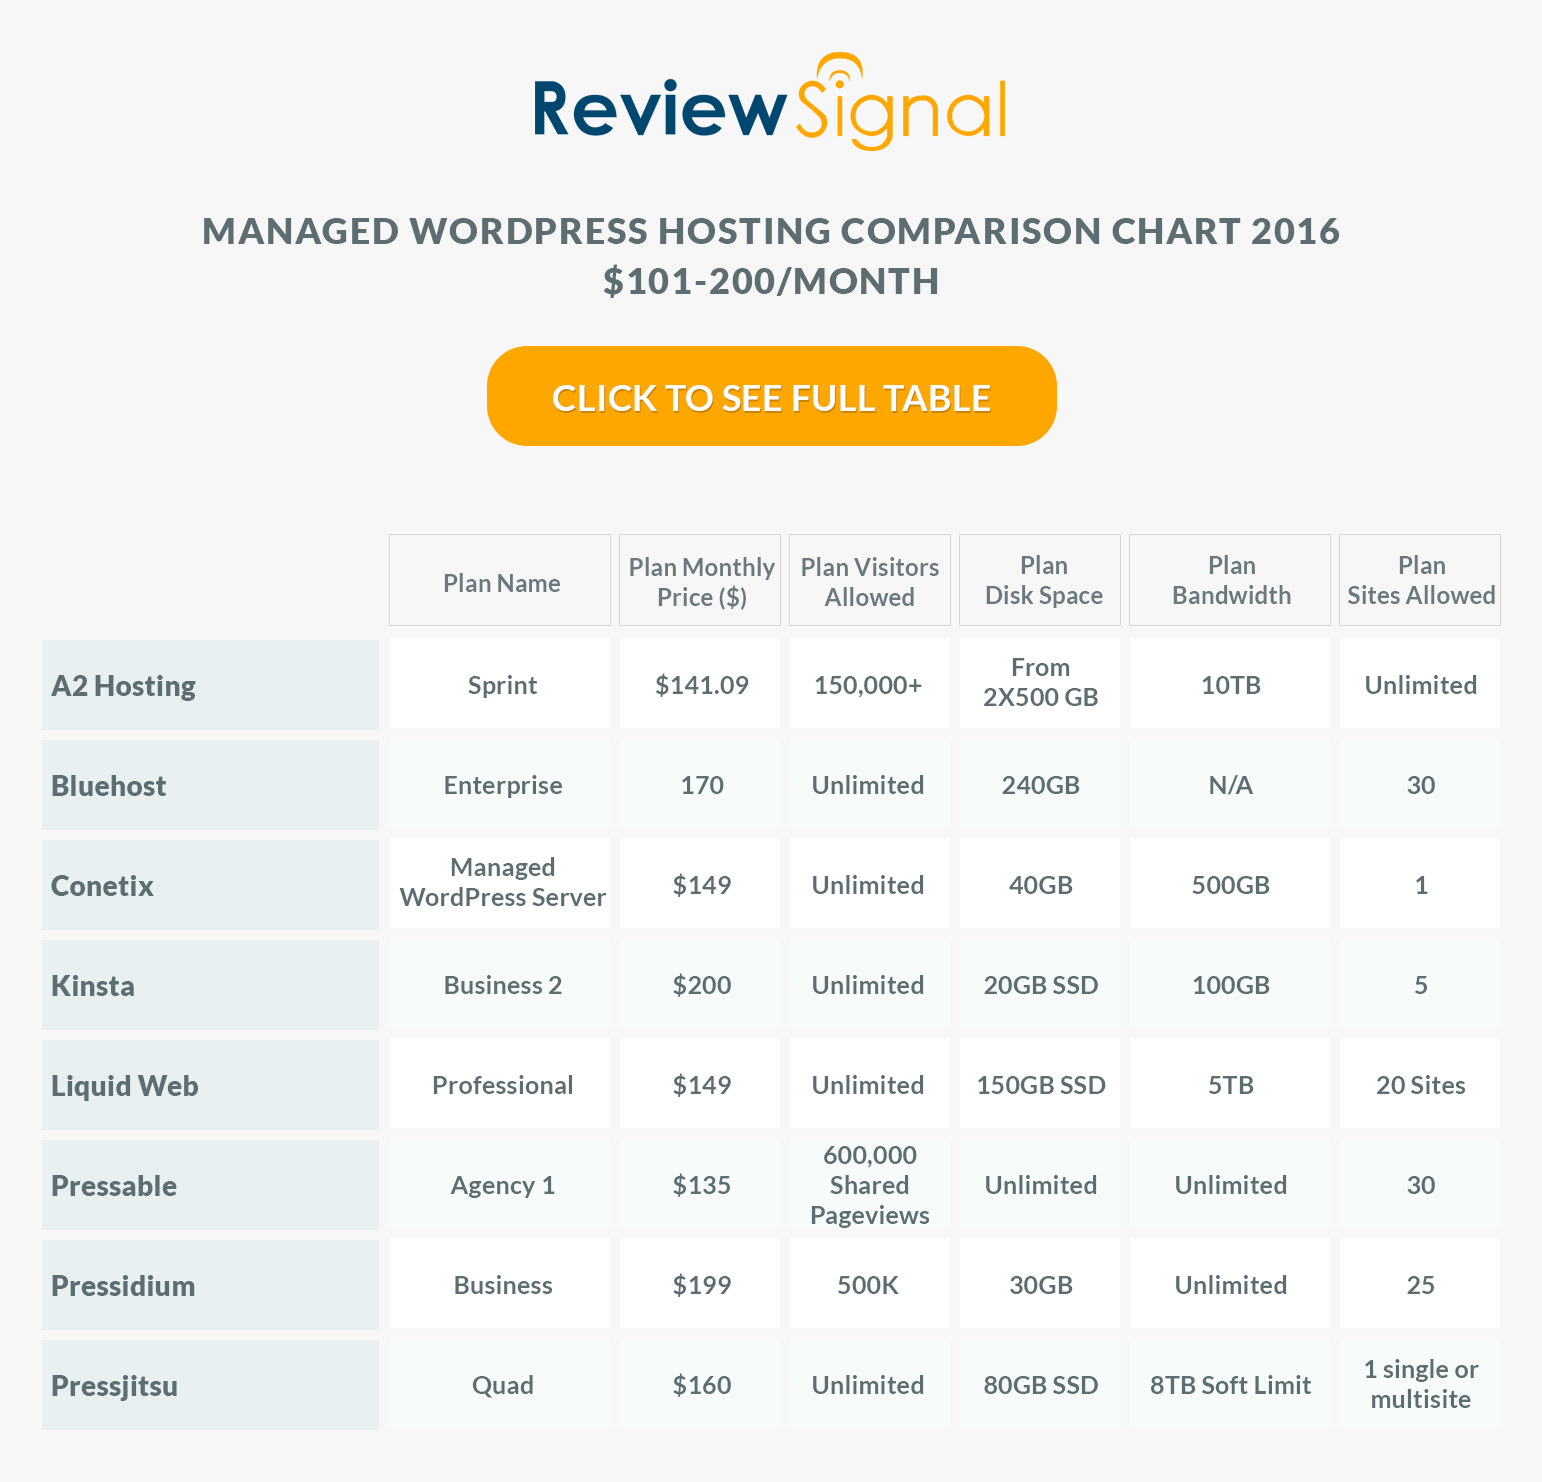
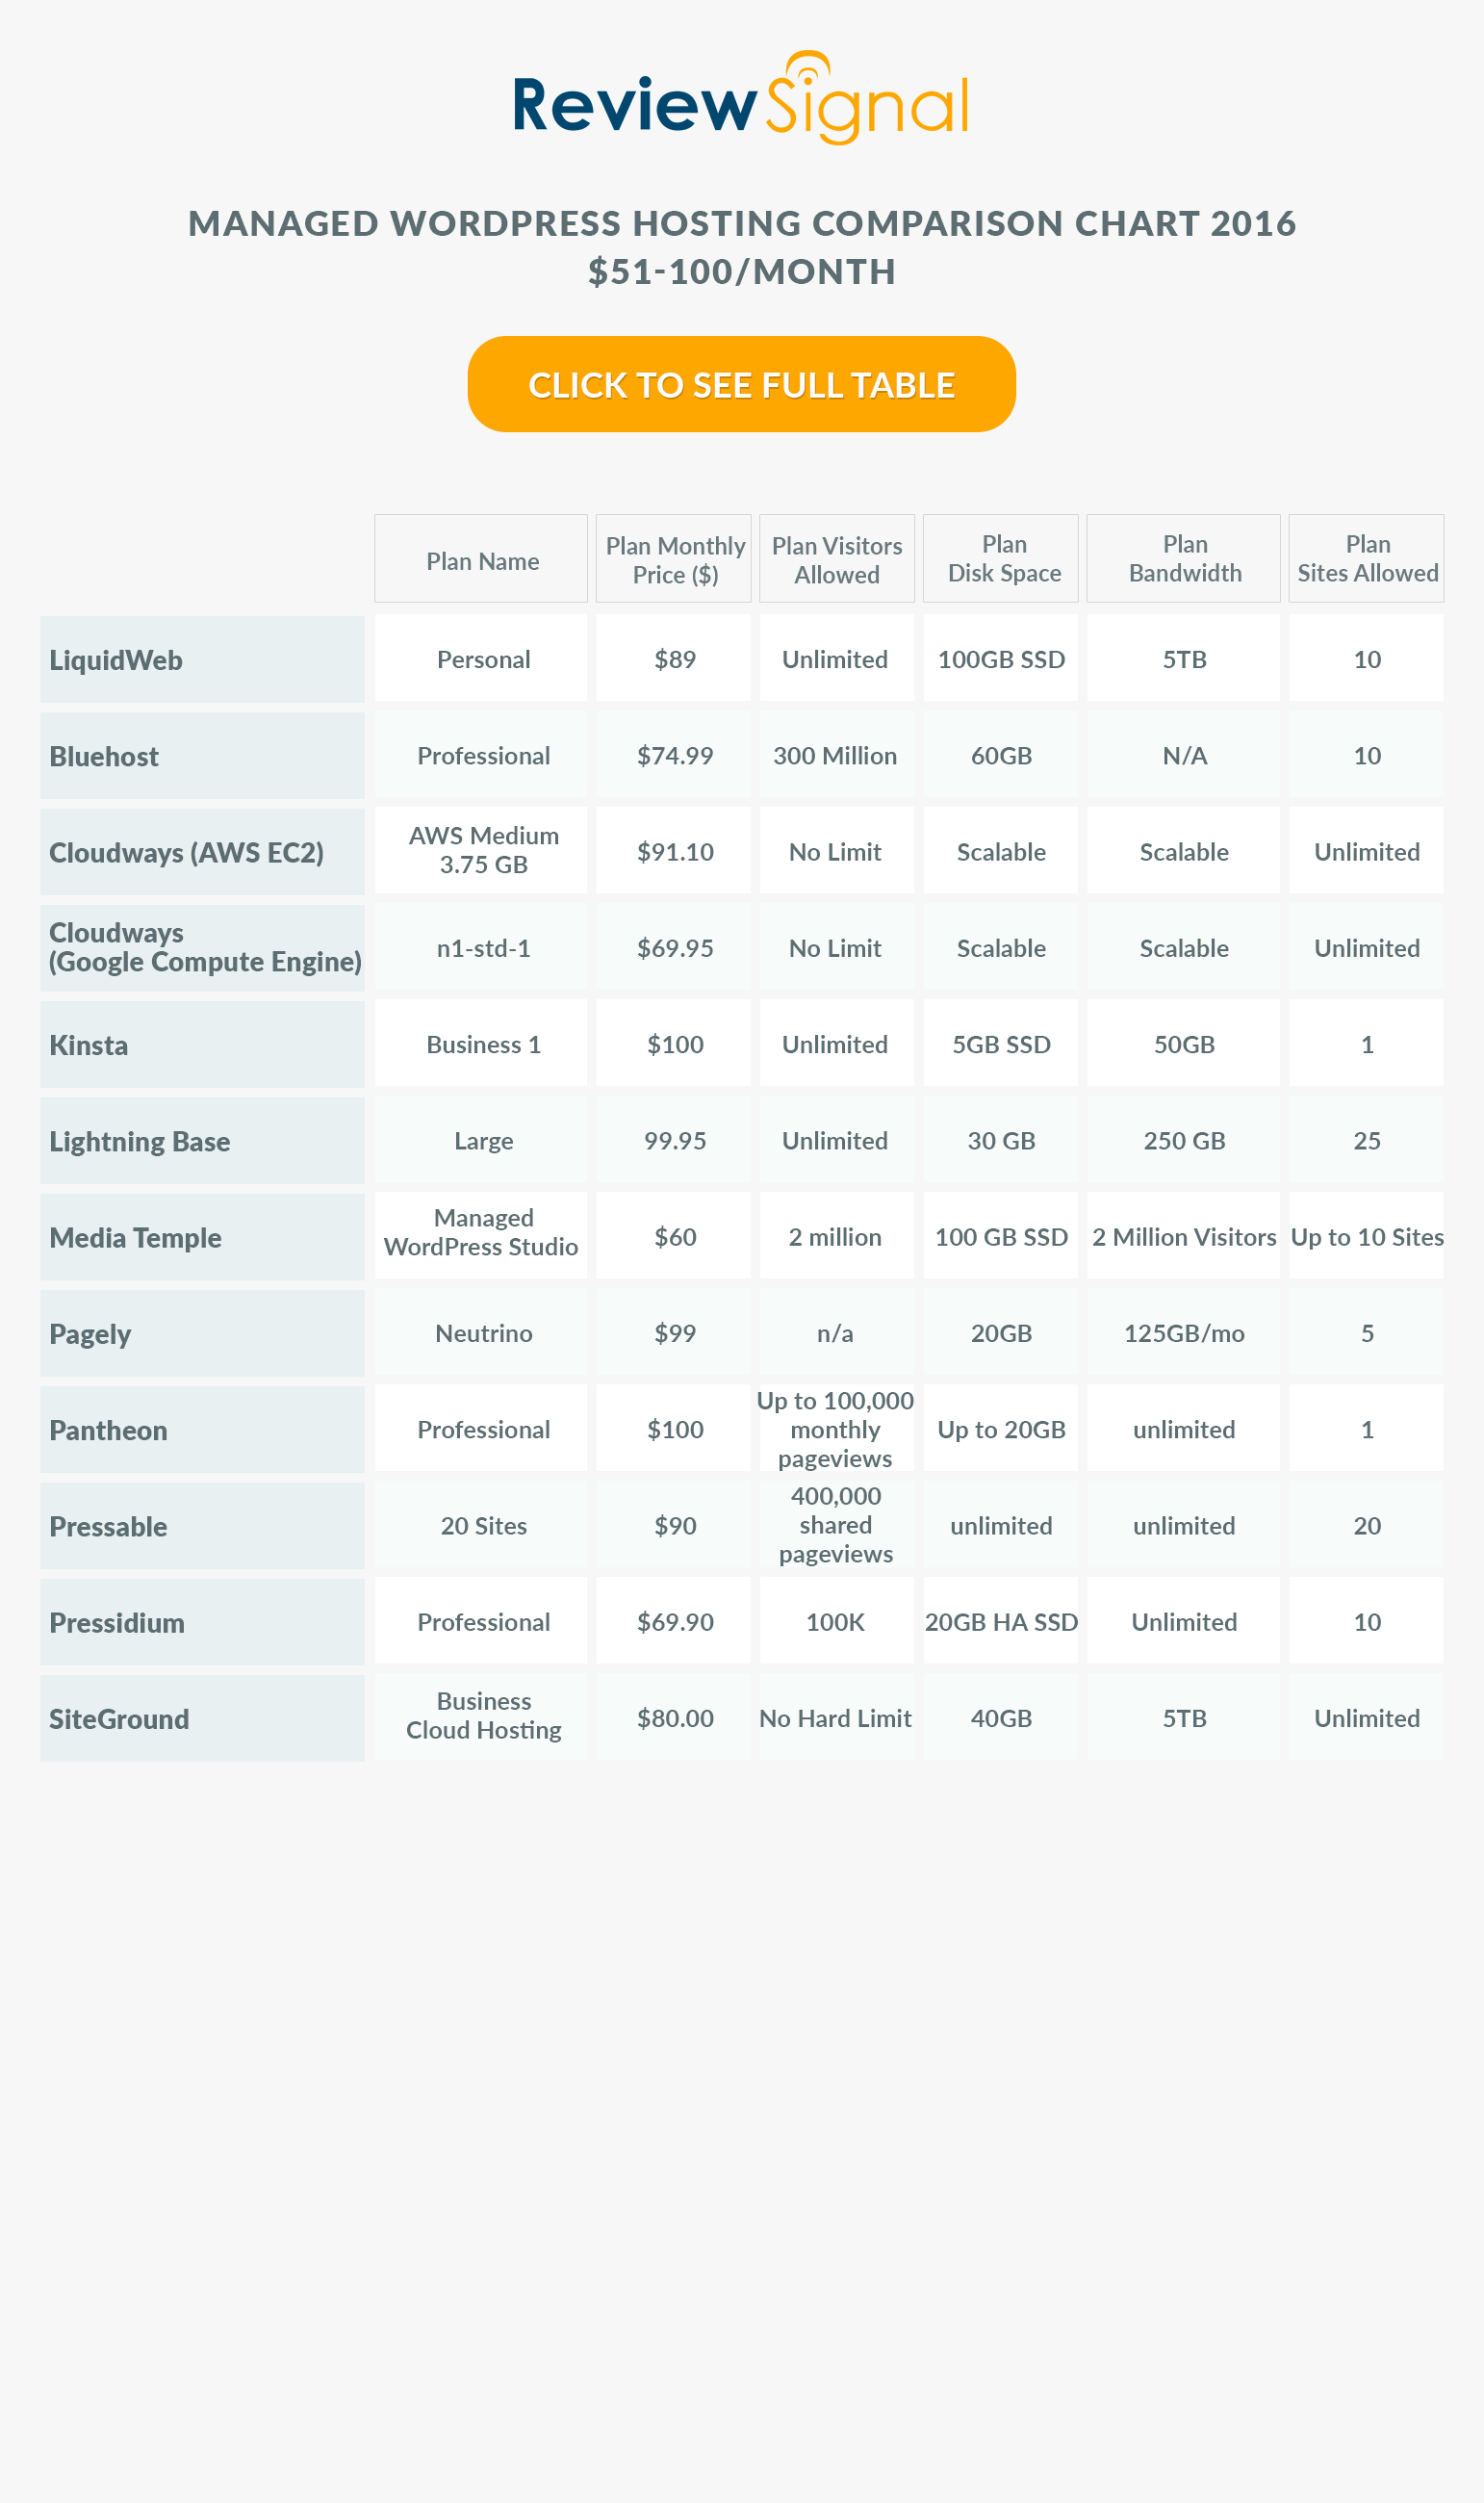
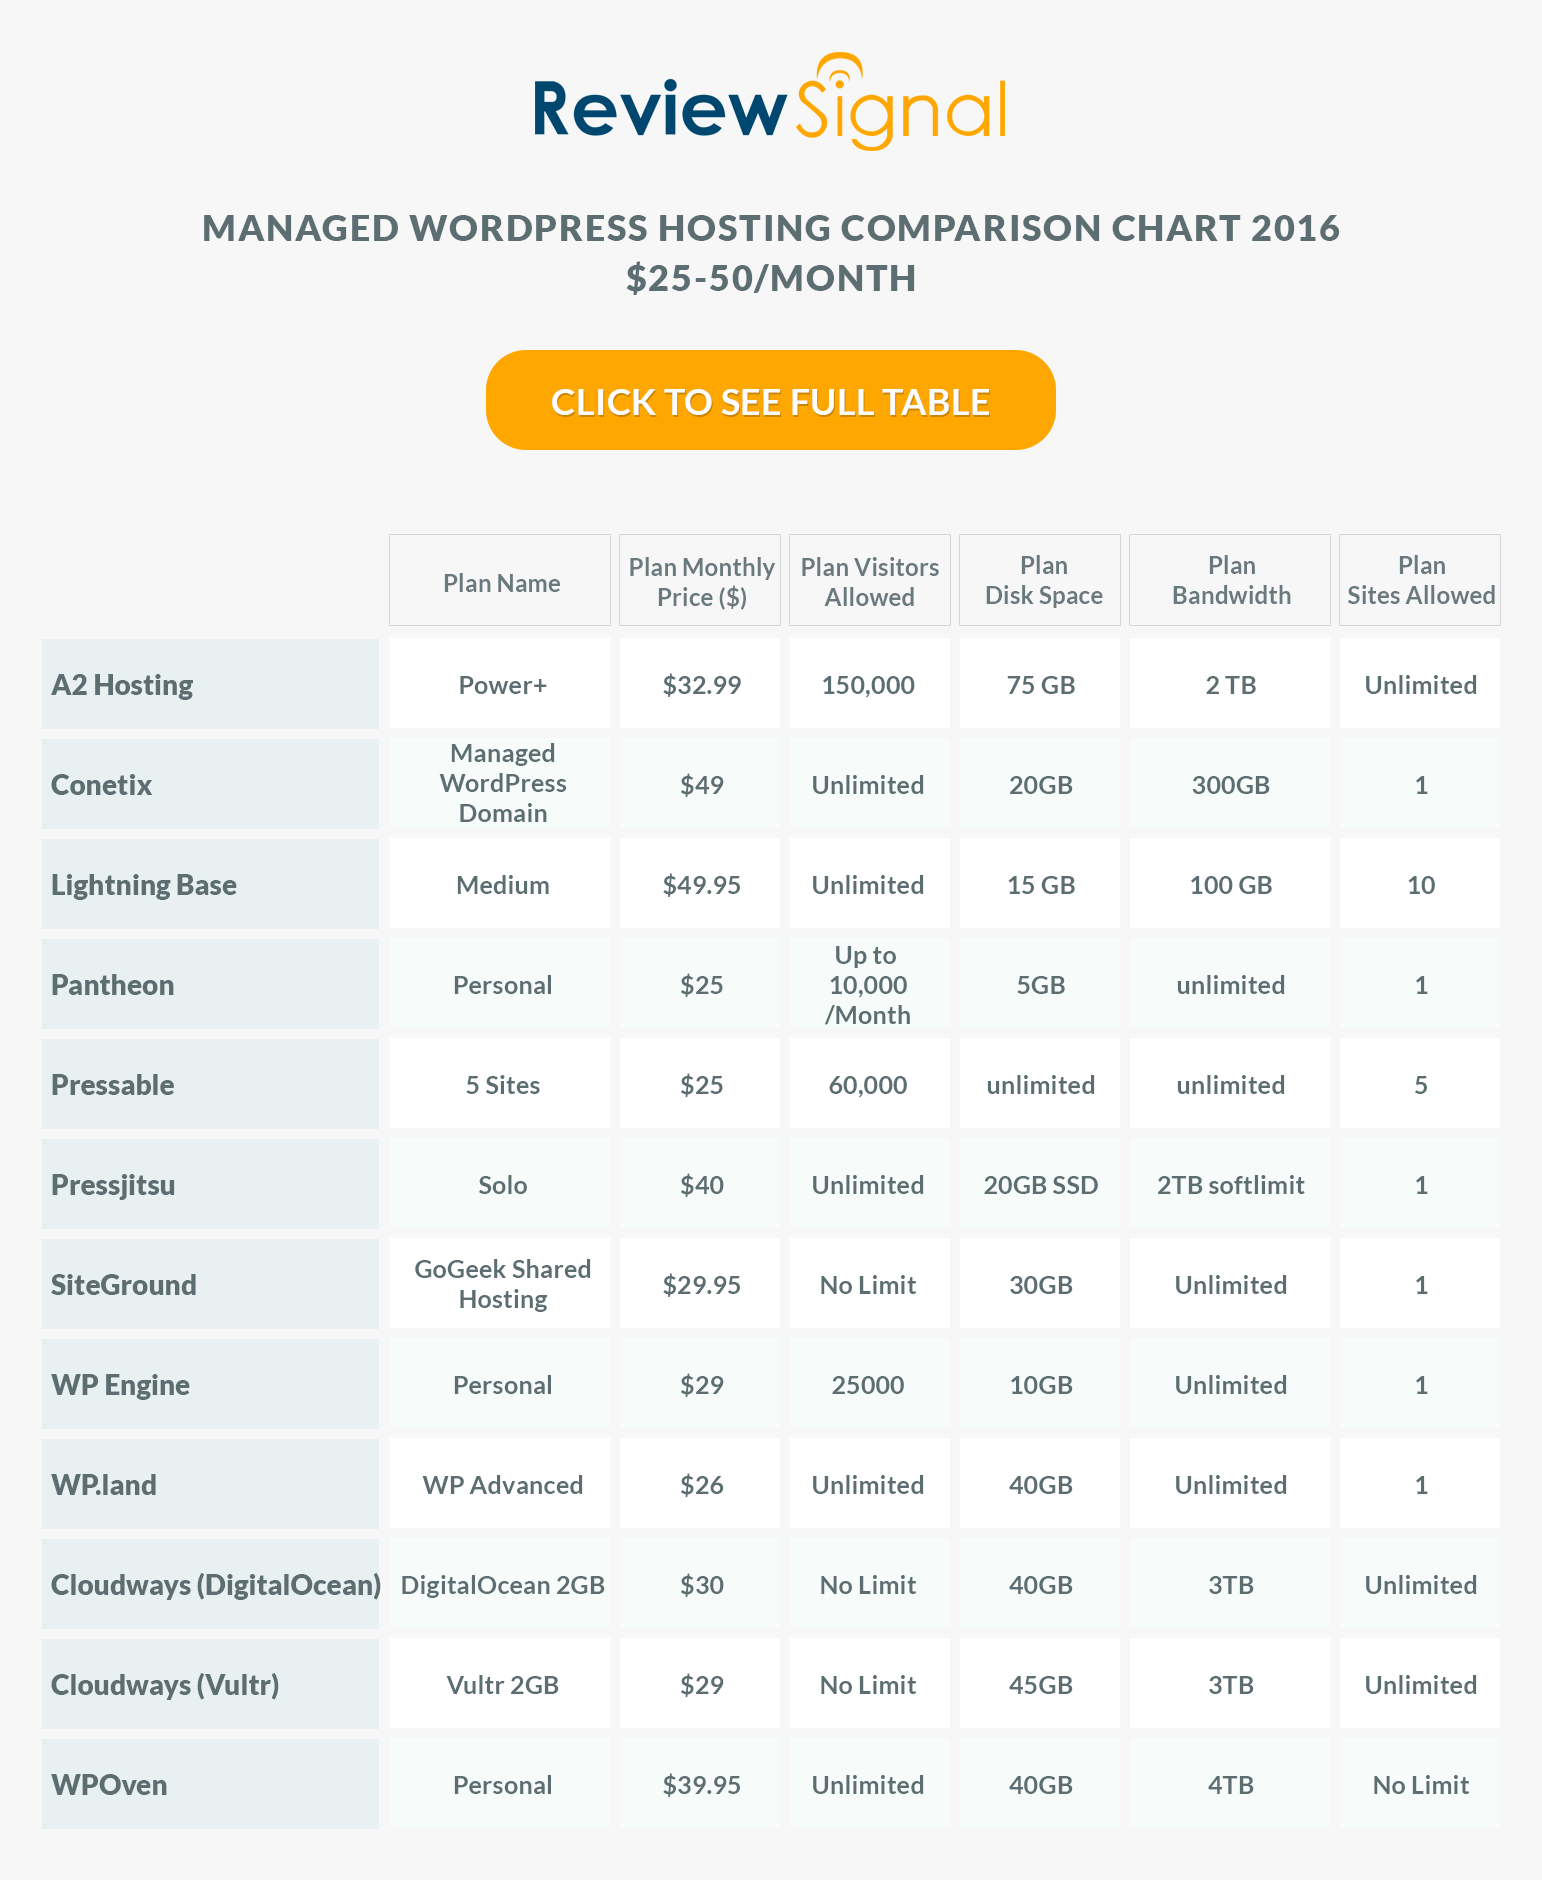
I created a comparison chart of all the companies and the product used in this test. It was mostly the basic/cheapest offer with the exception of SiteGround, because their cheapest hosting plan didn't have full WordPress caching built in, but it was still very much within the price range of other offers.

(Click to see full table)

comparison_chart_web

Methodology

The question I tried to answer is how well do these WordPress hosting services perform? I tested each company on two distinct measures of performance: peak performance and consistency.

1. Blitz.io

Load testing from the most well known load testing service. First test was 60 seconds, from 8 locations each scaling from 1-125 concurrent users (total 1000 users). For this test each one was tested with identical theme (twenty fourteen) and the out of the box configuration. The second test was 60 seconds, from 2 locations (Virginia/California) scaling from 1-1000 (total 2000 users). The configuration of each site was identical with Customizr theme and plugins.

2. Uptime (UptimeRobot and Uptime - a node.js/mongo project)

Consistency matters. I wanted to see how well these companies performed over a longer period of time. I used two separate uptime monitoring services: one existing third party service and one open source project.

3. WebPageTest.org

"WebPagetest is an open source project that is primarily being developed and supported by Google as part of our efforts to make the web faster." WebPageTest grades performance and allows you to run tests from multiple locations simulating real users. I tested from Dulles, VA, Miami, FL, Denver, CO, and Los Angeles, CA.

4. Unnamed Load Testing Service*

This service asked to remain nameless in this article. They do natural load testing and are in beta. I tested each WordPress host with the same theme (twenty fourteen) and the out of the box configuration for this test. I ran into some issues with this service which I will discuss later.

Background Information

Before I go over the results I wanted to explain and discuss a few things. Every provider I tested had the latest version of WordPress installed. Every plugin that came with it was also up to date with the exception of GoDaddy which had an older version of JetPack included (17 days out of date when I first setup).

I had some trouble getting set up on A Small Orange, the signup email was stuck in gmail's spam filter. I also found a potentially minor security issue in their customer system which they promptly responded to and fixed. I also had to specifically ask for the customized WordPress LEMP stack to be installed on my VPS.

GoDaddy stores SFTP and other critical details on a separate area away from your main GoDaddy account and WordPress admin (gateway.godaddy.com for anyone stuck looking).

I ran into issues with Pressable's CNAME redirect. It seemed to cache a coming soon page and didn't resolve itself by clearing any cache I could find. It resolved itself over a day or so, but being stuck with a coming soon page wasn't a pleasant first experience.

SiteGround includes CloudFlare but I never got it working, it failed to configure on www. So I couldn't conduct the test with it enabled.

Pagely charges you extra for SFTP access (which I didn't pay for and made my own life a living hell while trying to do this test).

WebSynthesis came pre-installed with two themes that were out of date.

Results

Blitz.io

 Test 1. 1-125 Concurrent Users from 8 Locations over 60 seconds (Gallery)

 Discussion of Blitz Test 1 Results

The first thing I must note here is that two companies got absolutely destroyed by this test: Digital Ocean and A Small Orange.

My Digital Ocean VPS just died repeatedly. MySql died and needed to be manually restarted. I thought it was a bad instance, so I spun up another and got the same result. I even tried installing a caching plugin to see if I could get any performance out of their WordPress stack. I had absolutely no luck. Given this result, I eliminated Digital Ocean from the rest of my testing. You can run high performance WordPress sites on Digital Ocean (Review Signal's blog is running on one currently), but it requires knowing what you're doing and isn't recommended for people looking for managed WordPress hosting. Digital Ocean is a self-managed VPS provider; it's not for beginners or those who need managed support of their WordPress site. I included Digital Ocean to see how their offer would fare against specialized companies. The short answer is, it doesn't compare, at all.

Another out-of-the-box install with A Small Orange got crushed by this test too. After dconsulting with A Small Orange support, it became apparent I wasn't on their customized WordPress setup. I asked for it to be installed and all further tests were on this much more performant setup. You will see two sets of results for ASO, the normal and the LEMP stack, which is their high performance setup. One thing to note is that ASO offers less management on their customized WordPress setup because it no longer uses cPanel.

The lesson here is that WordPress, out-of-the-box with a LAMP stack, performs pretty badly. For a personal blog with low traffic, it probably won't matter, but for a site with any substantial amount of traffic, it will most likely crumble.

Who performed without any major issues?

A Small Orange (from now on, anytime I talk about ASO, it's about the specialized WordPress setup), Pagely, and SiteGround. Each of these companies had stable response times and few to no errors.

Who had some issues?

GoDaddy had an issue with errors in the middle of the test around 400 users but seemed to gracefully scale upwards without any difficulty and maintained steady load times and stopped erroring. Pressable's response times were a bit varied. Pressable didn't seem to have much trouble with the traffic because it had zero errors and minimal timeouts. WPEngine seemed to have a weird connection timeout issue around 600 users that resolved itself fairly quickly. WebSynthesis seemed to cap out at around 400 users/second with a few bursts. The response time remained steady and it was erroring (connection reset) instead of timing out. WebSynthesis support told me "We analyzed the logs on the server and some of your requests are not being cached as your tests are throwing over 14K symbols in a single URL. This is not realistic for normal use cases of WordPress." Nevertheless, they made a tweak to the nginx (webserver) config, and I tested it again in test 2.

Test 1. Quick Results Table

Success Errors Timeouts Avg Hits/second Avg Response (ms)
ASO 23788 18 2 396 241
GoDaddy 23962 165 0 399 227
Pagely 20132 1 0 336 459
Pressable 21033 0 19 351 412
SiteGround 19672 0 0 328 495
WebSynthesis 19995 4224 5 333 246
WPEngine 20512 192 196 342 395

GoDaddy, despite their small hiccups, managed to have the best average response time to 8 servers distributed across 5 continents (Virginia, Oregon, California, Singapore, Japan, Brazil, Australia, Ireland). Furthermore, they also managed to serve the most hits.

SiteGround had the slowest average response and lowest hits/second but also didn't have a single error or timeout and the response was consistent throughout the test.

A Small Orange's performance was stunningly consistent. The fastest response was 238ms and the slowest was 244ms, a difference of 6ms over nearly 24,000 requests. They were just barely behind GoDaddy in hits and average response.

Overall, other than WebSynthesis, no host seemed to have serious difficulty with this test.


 Test 2. 1-1000 Concurrent Users from 2 Locations over 60 seconds (Gallery)

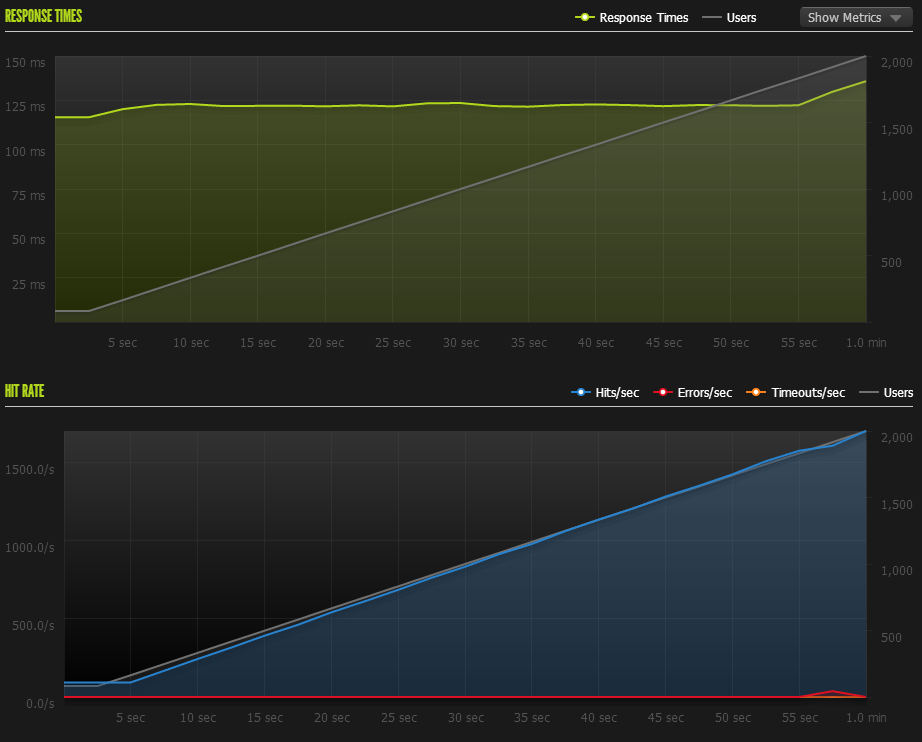
Discussion of Blitz Test 2 Results

This test was designed to see just how much traffic these web hosts can handle. Blitz increased their pricing for multiple server locations while I was running this test. I had to reduce server locations from 8 down to 2 locations with higher user counts instead. The response times may be less meaningful, but I picked Virginia and California so that the test locations were on opposite sides of the US. I believe every server tested was in the US, so hopefully that was somewhat balanced, but the average response time may mean less than the stability of the response time.

Who performed without any major issues?

Pagely.

Who had some issues?

A Small Orange's setup definitely couldn't scale all the way up. Response times started increasing with increased users as did errors/timeouts. GoDaddy had some bizarre spikes that look similar to the one I saw in test 1, except three of them this time. Despite this, they pushed the most successful hits again and had the best ping of hosts that didn't completely error out. Pressable had some spikey performance similar to GoDaddy. Pressable pushed a lot of successful requests and did recover from the spikes. SiteGround hit a major spike but then seemed to kick into high gear and performed even better and finished out the test exceptionally strong and stable. WebSynthesis seemed to cap out at around 400 users/second with a few bursts again. The response time remained fairly steady and it was erroring (connection reset) instead of timing out again. WPEngine's response times got worse as the load increased and timeouts started to increase as well.

I included a screenshot from my uptime monitoring system. It's checking each host every 5 seconds, and I highlighted the hour in which all the tests took place. You can see some large spikes for companies that seemed to have latency struggles.


Test 2. Quick Results Table

Success Errors Timeouts Hits/second Avg Response (ms) Max Hit Rate (per second)
ASO 27057 777 518 451 739 597
GoDaddy 49711 685 1 829 148 1750
Pagely 48228 0 1 804 216 1580
Pressable 43815 503 9 730 271 1466
SiteGround 48735 12 19 812 263 1708
WebSynthesis 20855 35773 0 348 120 763
WPEngine 39784 25 1008 663 304 1149

GoDaddy seemed to have the best peak performance again. SiteGround and Pagely seemed to handle the load fantastically and didn't show any signs of performance issues (again). With the exception of A Small Orange, every host saw an improvement in average response time. As I wrote earlier, this may be because they were tested only from US locations. That caveat aside, the response times are a lot closer together and look pretty good for US based visitors. Still, this test also started to raise questions about many web hosts' ability to handle a heavy traffic load.

WebSynthesis Response to ECONNRESET Errors

WebSynthesis ran into the same issue in both tests, a strange ECONNRESET error. Suspecting something may be blocking the test requests' as a security measure, I asked them to investigate. They made a change to their nginx config after the initial set of testing and wrote back "we made adjustments to handle the types of URLs you were hitting us with.  We did review our logs and do not see these in production thus will not put these kinds of changes in production as we feel they are unrealistic." Here are the results:

WebSynthesis2-blitz WebSynthesis2 (Download Full Report WebSynthesis2.pdf)

The new WebSynthesis results were pretty impressive. Average ping of 123ms (3ms slower than initial test), 871 hits/second average, 1704 hits/second and with only 94 errors (ECONNRESET again). The original tests did not suggest that either the hardware or software was starting to buckle. But the configuration change does indicate that they were probably blocking some of the requests. Load testing tools can't fully emulate users (they generally come from only a couple of machines) and it's conceivable that some security measures are triggered by their unusual behavior. Since I am testing these companies out of the box, I am leaving this result separate where support got involved and changed configuration settings.

Uptime

What is often more important than peak performance is how well a service does on average. To test this, I used two services: UptimeRobot and a NodeJS project called Uptime.

UptimeRobot Results

Monitored HTTP and Ping every 5 minutes. This was over a 10 day span.

HTTP Ping
ASO 1 1
GoDaddy 0.9979 -
Pagely 0.9862 -
Pressable 0.9995 1
SiteGround 0.9993 1
WebSynthesis 1 1
WPEngine 1 1

A Small Orange, WebSynthesis and WPEngine showed no downtime. Every server responded to pings 100% of the time with the exception of GoDaddy and Pagely which seemed to be blocking pings to the server (at least from UptimeRobot).

Pagely's downtime was mostly my own doing (3 hours), when I was editing a template  to use some of these testing services. Only 5 minutes of the downtime was unrelated to that incident.

GoDaddy had 28 minutes of downtime. SiteGround had 9 minutes. Pressable had 5 minutes.

When you account for my screwup, only GoDaddy shows up under the 99.9% uptime threshold.

Uptime (nodejs) Results

Uptime was configured to perform an HTTP check every 5 seconds on each host with a 1500ms slow threshold. This was executed from a Digital Ocean VPS in NYC.

Responsiveness is defined as the percentage of pings above slow threshold over the period. Availability is the uptime percentage.

Availability (%) Downtime (m) Response Time (ms) Responsiveness (%)
ASO 99.998 1 204 99.97
GoDaddy 99.963 17 309 99.679
Pagely 99.998 1 237 99.974
Pressable 99.914 39 727 90.87
SiteGround 99.997 1 206 99.616
WebSynthesis 99.994 3 97 99.727
WPEngine 99.965 16 209 99.819

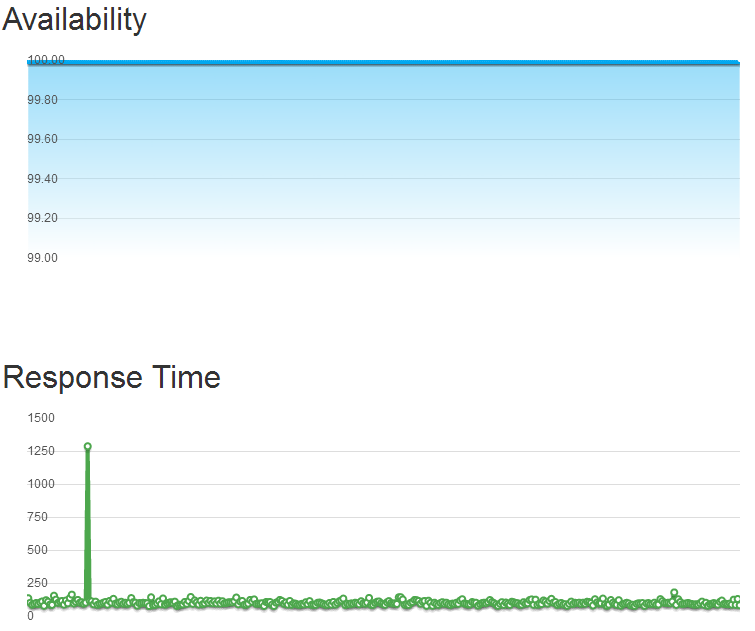
Nobody had a perfect record although four companies (A Small Orange, Pagely, SiteGround and WebSynthesis) were above the 99.99% uptime marker. The rest were still all above 99.9%. The most worrisome result was Pressable because they had the most downtime and a very high average response time. This might be caused by the monitoring server being far away from their server. Below is a detailed graph of the response times:

pressable_response_time

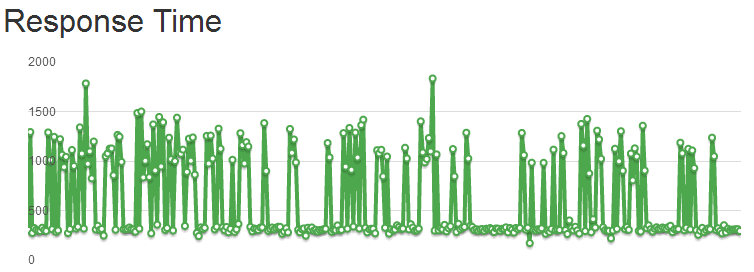
The lowest ping I saw was around 172ms and the relatively consistent bottom line of pings at around 300ms is reasonable. However, inconsistent performance with high spikes results in a very high average. Every other company had a fairly smooth graph in comparison. They show an occasional spike and/or some small variance (<100ms) between response at the base line, but nobody came close to a graph like Pressable's. The next most interesting is A Small Orange's graph:

aso_response_time

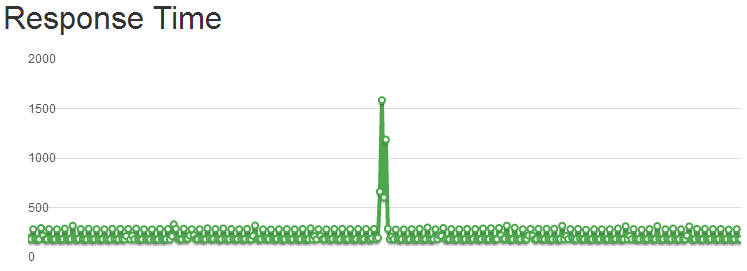
Though within reasonable response times, it has a spike and a weird pattern bouncing between around 170ms and 270ms.

Giving Pressable the benefit of the doubt, I signed up for Pingdom and monitored what their service saw. This was done with 1 minute resolution.pressable_pingdom_uptime

pressable_pingdom


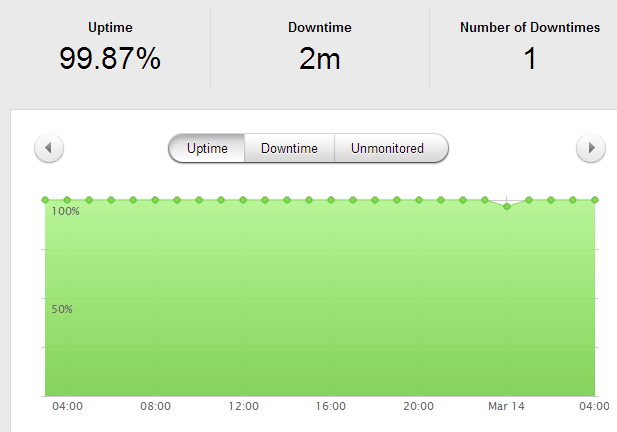
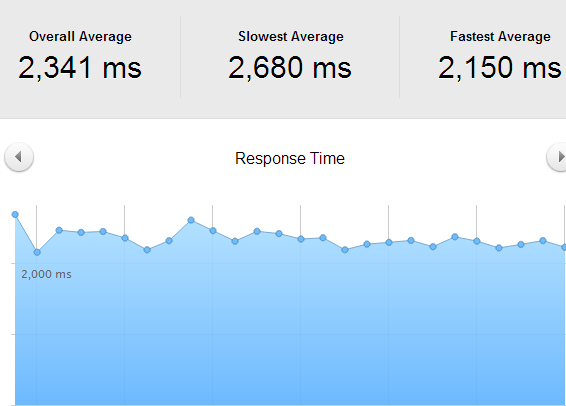
The pings varied pretty wildly, the highest being 2680ms and lowest 2150, a 530ms difference. And that was based on hourly averages; the variance within each hour may have been much greater. It would seem to corroborate the results from the Uptime script I was running, i.e. performance fluctuates a lot.


WebPageTest.org

Every test was run with the settings: Chrome Browser, 9 Runs, native connection (no traffic shaping), first view only. This was tested against the default install from every company. I also tested SiteGround's multiple levels of their SuperCache technology from one location to see how much it improved performance. SuperCache was left on for all the other tests performed. You will also notice the original A Small Orange and the WordPress optimized LEMP stack. Digital Ocean hadn't completely failed out at this point yet either.

Company Dulles,VA (s) Miami, FL (s) Denver, CO (s) Los Angeles, CA (s) Average Load (s)
A Small Orange 1.894 2.035 2.381 1.648 1.9895
ASO Lemp 0.85 0.961 1.056 0.665 0.883
Digital Ocean 1.245 0.95 1.419 0.924 1.1345
GoDaddy 0.94 1.208 1.229 0.671 1.012
Pressable 0.642 1.174 1.721 0.981 1.1295
SiteGround 1.073 1.327 1.682 1.353 1.35875
SiteGround (Varnish Dynamic Cache) 0.732
SiteGround (Varnish Dynamic Cache, Memcached) 0.725
SiteGround (PageSpeed, Memcached) 1.216
WPEngine 0.812 1.235 1.06 1.08 1.04675
Pagely 0.924 1.083 1.46 0.748 1.05375
WebSynthesis 0.616 1.021 1.516 1.116 1.06725

You can see a huge performance difference in A Small Orange's default cPanel install and their optimized LEMP stack. Load times were reduced by more than half from every location. That should convince you that optimizing WordPress can dramatically improve performance. To a lesser degree, you can see it happen when SiteGround's various SuperCache options are turned on.

A Small Orange's LEMP stack leads the pack here. However, it's amazing how close the performance of most of these companies was on this test.


Conclusion

Every service seems to have their issues somewhere. I try to avoid injecting my personal opinion and bias as much as possible. So I won't be ranking or outright saying any single company is the best. Some providers did exceptionally well and tended to clump together performance-wise, I will call those the top tier providers. This top tier designation is related to performance only and from the results of these tests. What each of these companies is offering is different and may best suit different audiences depending on a variety of factors beyond performance, such as features, price, support, and scale (I only tested entry level plans). But I will provide a short summary and discussion of the results for each provider.

A Small Orange

Once I moved away from the stock WordPress install on a normal VPS to their specialized LEMP WordPress VPS, it was a much better experience. Their uptime was near perfect on both services (1 minute of downtime total measured between them). The first load test it performed incredibly well and was 2nd by only a few requests per second. However, ASO did buckle under the heavier load test but it didn't fail out and managed to respond to most requests (including uptime monitoring) during the whole event. While their performance didn't scale as well as most of the competitors, I did receive a lot of support from them and it was quite responsive, in-line with what I would expect from a company that has one of the highest support ratings.

Digital Ocean

They are not in the same business as the rest of these companies. I added them because I wanted to see how well a stock install of WordPress would compete with pretty good hardware that's low cost (SSD backed VPS). The results here aren't a knock on their service at all. As I said earlier, this blog is running on a Digital Ocean VPS. The difference is I have spent many hours configuring it myself to be somewhat high performance. Digital Ocean is designed for people who can administrate their own servers. If you need managed WordPress hosting, stick to companies that are managing WordPress for you. If you're comfortable and want to do it yourself, these guys have one of the highest rated companies that we track.

GoDaddy

This whole test started from a statement made by Jeff King, a senior vice president at GoDaddy and GM of their hosting division. He wrote to me, "The new products are top of the market (really, you can’t get faster WordPress anywhere now) and we’re just beginning."  Challenge accepted.

GoDaddy surprised me, and in a good way. They have a pretty bad reputation in the web community and it shows on this site where their overall score is below 50%. Yet, their WordPress hosting kept up or led the pack in some of the performance tests. In both Blitz.io load tests, out-of-the-box, GoDaddy had the highest number of successful requests, the highest number of concurrent users, and either 1st or 2nd in average response time.  (WebSynthesis's performance did beat them when their support investigated connection resets) There were some weird performance bumps during the load tests, but nothing major. The biggest blot in terms of performance was on their uptime. They had the most downtime (28 minutes) of any of the companies tracked in UptimeRobot's monitoring (which ran longer than my second Uptime monitoring setup). But it was still 99.8% uptime, not a huge knock.

Overall, I would say GoDaddy delivered on their claim, performance wise. They appear to be in the top tier of specialized WordPress hosting companies. Given their price, I think they have the potential to push down pricing on most of their competitors who charge 3-4 times what GoDaddy charges. If we take a more holistic view, beyond performance, they still don't have all the tools to cater to the different niches that the specialized companies are competing for (although there were some hints dropped that things like Git, Staging Environments and more were coming soon). And then there is a branding problem they are trying to overcome. But GoDaddy is definitely doing some things very right and should make the managed WordPress hosting space very interesting.

Pagely

Pagely's performance didn't ever seem to get affected by any tests. They had a mere 5 minutes of downtime. The load testing services never seemed to cause any stress on their system. It was an impressively consistent performance. They didn't have the highest peak performance on the load tests, but they had a flat response time and only a single error or timeout in each blitz load test. One thing that irritated me about their offer was charging extra for SFTP access. Every other company included this for free and it's generally a given with a web hosting service. Still, a very impressive performance by Pagely, they are definitely in the top tier.

Pressable

Pressable had some issues during this test. I am not sure why but there was a very strange issue where performance seemed to repeatedly spike throughout my entire testing session. When it was good, it was performing at a level consistent with the top tier providers. The problem was, it wasn't always good. On the large Blitz load test there was consistent performance except for two spikes, which put it behind the front of the pack. It caused low responsiveness scores and potentially some downtime calculations as well. The foundation of a top tier provider is there, and generously open sourced on GitHub. They just need to sort out this weird performance spikiness issue.

SiteGround

Another very pleasant surprise in SiteGround. Not only are you getting cPanel hosting, you're getting top tier WordPress performance once you fully enable their SuperCacher plugin. They are one of the most well liked companies we track and have some of the best rated support. I honestly didn't know they were offering such high performance WordPress hosting. They didn't have the absolute fastest responses or push the highest concurrent users but they kept pace. They had one of the stranger graphs on the heavy load test, for some reason the performance got even better after a big spike. They had excellent uptime at above 99.9% measured by both services. Like GoDaddy, SiteGround looks like they could make this space interesting with a $7.95 plan performing on par with plans 3-4x its cost. While I didn't get to try some of the more developer-centric features like a staging environment and Git, they are available on a plan that's as little as 50% of the cost of the competitors at $14.95. Definitely in the top tier of managed WordPress providers.

WebSynthesis

These guys are harder to evaluate. Their uptime was excellent: either perfect or upwards of 99.9% as measured by the two services. The load testing ran into a weird ECONNRESET error. Their support was very helpful and made some configuration changes that seemed to allow the load testing service through. Once they did that, they outperformed every provider on almost every metric, highest average hits/second, fastest response and most successful hits with relatively flat response times. As I wrote in my discussion about them, load testing tools aren't a perfect emulation of real users. But it looked like it was running into a security rule rather than actual strain on the service. If that assumption is correct, these guys are truly a top tier provider.

WPEngine

WPEngine had some issues. Uptime was not one of them, they were perfect or upwards of 99.9% in that department. However, their performance shortcomings became apparent during the load tests. They had the most errors and timeouts, besides WebSynthesis, in the first test and seemed to buckle under the load in the second test with rising errors and timeouts and slower response times. When WPEngine was first listed here on Review Signal, they had the highest rating of any company. They've fallen a bit since then but WPEngine still remains near the front of the pack. They have a strong brand and seem to be doing some things right. They have some features that few other providers have, but this test was mostly about performance. In that department, they didn't quite match the level of performance that some of their competitors reached.


 Product Comparison Chart with Coupon Codes


Notes:

*Unnamed Load Testing Service

AVG Response Failures AVG Response Heavy
ASO 2031 No
GoDaddy 2120 No 5904
Pagely 2398 No
Pressable 1360 No 15570
SiteGround 22659 Yes 25712
WebSynthesis 1929 No 3740
WPEngine 1835 No

I didn't get to conduct a full test with this service because I may have caused the entire service to crash during testing. This table is showing 2 tests, on average response and whether failures occurred (any type of failures). The second test is what caused the service to crash and is incomplete. The first test was 500 users/second from 1 machine and the second was 8000 users/second from 40 machines. The response times were pretty slow all around, and SiteGround seemed to have some major issues with this test. I am unsure as to why, I re-ran the first test again later and it seemed to handle it without any failures (errors) on the second run. The testing system is in beta and it's really hard to know what happened. SiteGround seemed to handle Blitz's heavier test without issue and the second test here went fine. Hard to know if there was really an issue on SiteGround's end or the testing service. The heavy test was interesting, WebSynthesis ended up being the fastest which is a similar result to the Blitz.io test once they fixed the nginx config. Perhaps this load test wasn't triggering any of their security measures? I could not complete the testing because the system went down prematurely.

I am not sure if there are useful inferences to be drawn from these tests. I was asked not to name the service because of the issues encountered but I wanted to include the partial results here in case someone did find some value in looking at the numbers.

I actually tried a third load testing service that was also in beta and it never was able to fully run the tests either. I am starting to feel like load testing kryptonite.

Thank You

First off, I want to thank the companies that agreed to participate voluntarily. I had nothing but pleasant experiences dealing with the people at each company. A few even took it a step beyond and offered a lot of help and insight about how this test might be conducted. There was a surprising amount of consistency of views about what and how to measure performance offered. A few of the individuals who stood out the most:

David Koopman at GoDaddy for his insights on performance and testing.

Vid Luther at Pressable was incredibly helpful and knowledgeable about performance. He's even written a great article here about performance. He also helped get at least one other company on board for testing and for that, I am thankful as well.

Tina Kesova at Siteground has always been helpful and this test was no exception. She had SiteGround on board almost instantly when I just mentioned the seed of the idea back in November 2013.

A few friends of mine also helped in figuring out how to perform these tests and dealing with some of the technical challenges in benchmarking. Dave Lo, Eric Silverberg and Samuel Reed all offered their advice and helped me make the design of the tests as fair as possible.

A special thanks goes to people who read drafts of this article and provided feedback including Andrey Tarantsov, JR Harrel and my dad.

Anyone else I missed, I am sorry, and thank you too.