Tag Archives: performance

GoDaddy WordPress Hosting Review

GoDaddyLogo

This post is based off WordPress Hosting Performance Benchmarks, where you can read the full details of how GoDaddy performed against the competition.

Overview

GoDaddy [Reviews] is the company that sparked this series of WordPress performance testing. They said their WordPress hosting was as good as anyone else on the markets WordPress hosting. I wanted to see if it was true in our first round of WordPress testing and it certainly was. The second round of testing did not disappoint either. GoDaddy maintained their position in the top tier of managed WordPress providers. This article summarizes GoDaddy's performance under multiple testing scenarios.

The Plan

All testing was done on GoDaddy's shared WordPress Hosting service which cost $6.99/month.The plan allows for 1 site, 100GB of space and 25,000 visitors per month. It also had the usual features of automated backups, 24/7 support via phone or ticket and free migrations.

Performance

LoadStorm

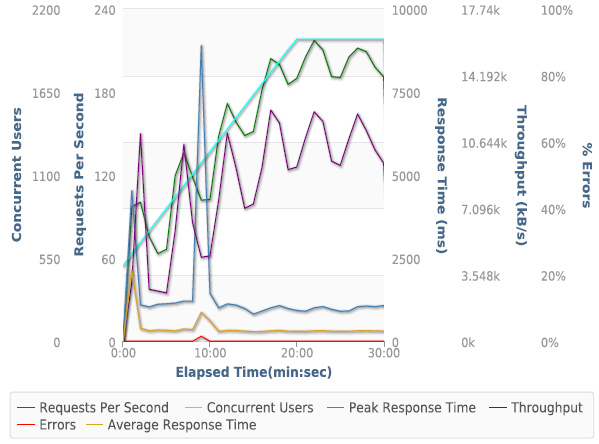
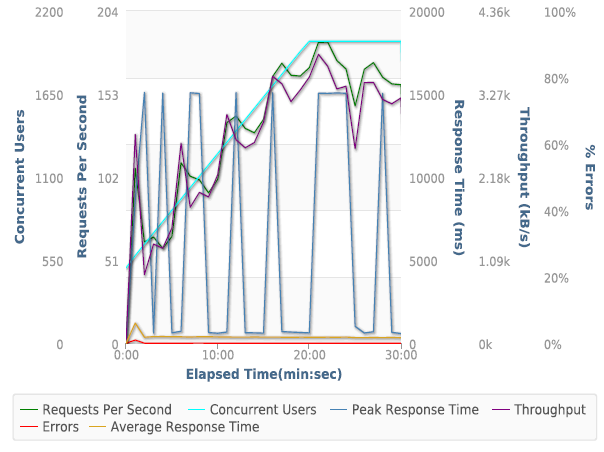
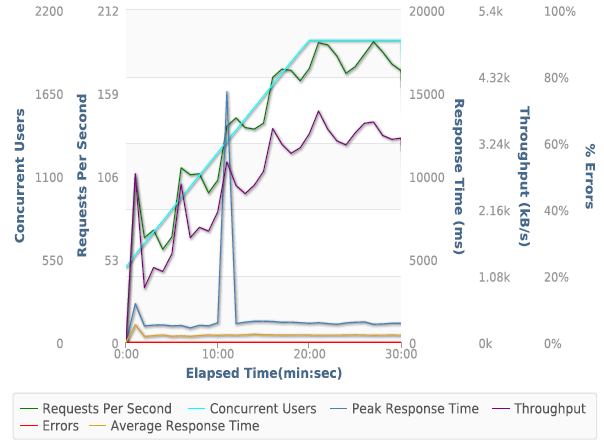
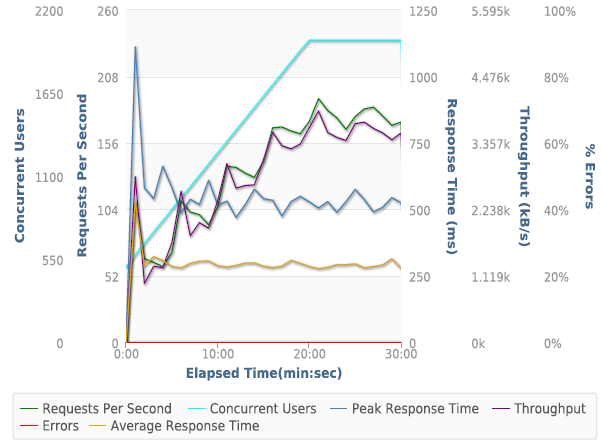
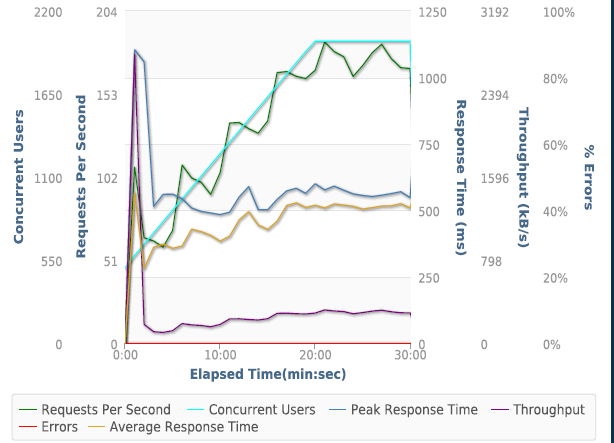
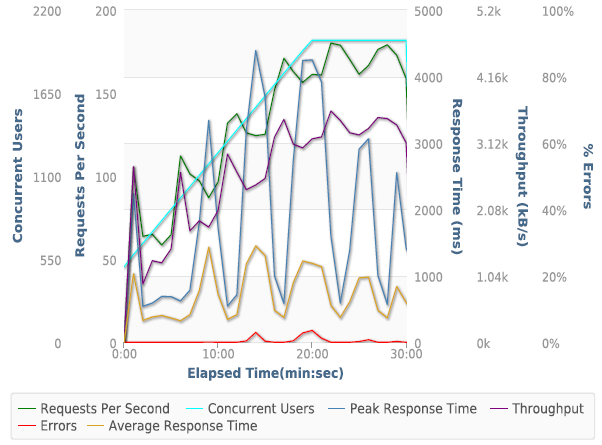
The first performance test was done with LoadStorm. GoDaddy made it to the final round of testing where 2000 concurrent users were logging into WordPress and browsing the test site. The test was designed to test non-cached performance by logging users into WordPress. It caused many hosting setups to crumble. You can see GoDaddy's result in this graph (click on it to play with the interactive results):

Load-Storm-GoDaddy-2000


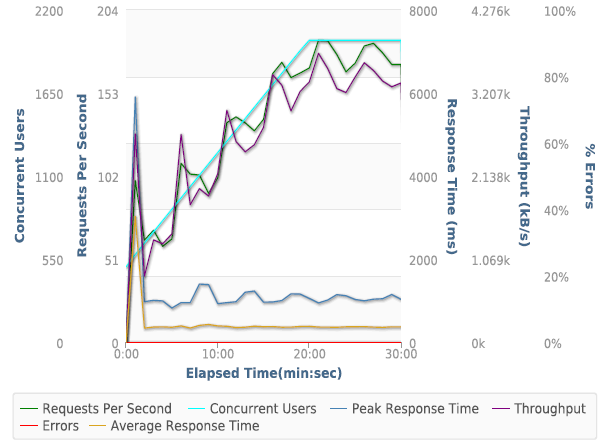
GoDaddy actually pushed through triple the amount of data compared to every other web hosting company. Amazingly, it didn't struggle with this at all. The error rate was an infinitesimal, only 92 errors in over 285,000 requests. Other than a little spike, it handled the entire test without missing a beat.

Blitz

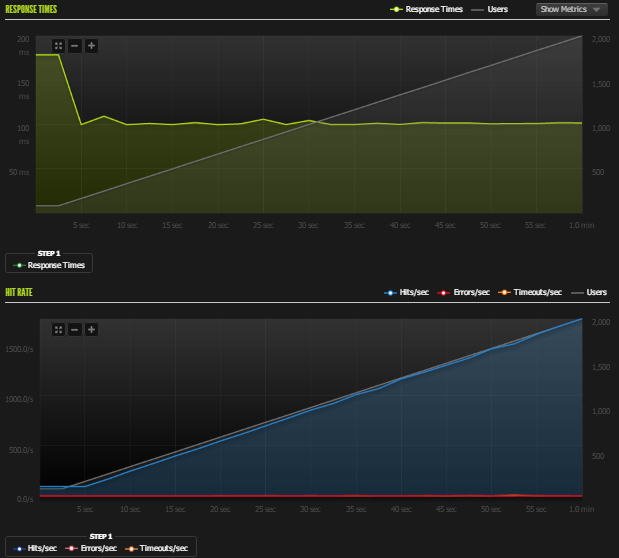
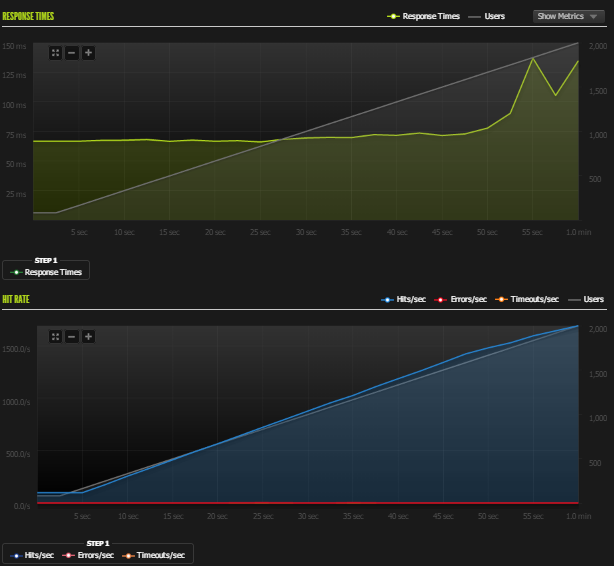
The second load test that was run on GoDaddy was Blitz.io. Blitz was used to test cached performance. It simply requested the home page of our test site from 1-2000 times per second.

Blitz-GoDaddy-2000


GoDaddy's Blitz results look exactly like what you hope for. A small spike at the very beginning and then perfectly stable performance afterwards. There are no complaints against its cached performance. Full Blitz Results (PDF)

Uptime

Two third-party uptime monitoring services (UptimeRobot and StatusCake) tracked the test site for a month. The results for GoDaddy was 99.9% and 100% uptime respectively. That is the uptime level you would expect of any good service.

WebPageTest

“WebPagetest is an open source project that is primarily being developed and supported by Google as part of our efforts to make the web faster.” WebPageTest grades performance and allows you to run tests from multiple locations simulating real users. GoDaddy was tested from Dulles, VA, Miami, FL, Denver, CO, and Los Angeles, CA.

Company Dulles,VA Miami, FL Denver, CO Los Angeles, CA Average
GoDaddy 1.607 1.355 0.934 0.855 1.18775

There was absolutely no issues with their WebPageTest results, it loaded very quickly at an average speed of under 1.2 seconds to completely load.

Conclusion

GoDaddy [Reviews] is one of the top tier WordPress hosting providers when looking at performance. GoDaddy continues to surprise me. They flew through all the tests, including a weird issue where they transferred 3X the data during the LoadStorm test and didn’t show any signs of stress. The only comparison I have to last time is the Blitz testing, where they eked out another 3000+ hits and raised their hits/second from 829 to 888. GoDaddy also raised their max hit rate marginally from 1750 to 1763. What’s more impressive is they reduced their errors+timeouts from 686 to 93. More hits with less errors. From a performance perspective, they did excellent in absolute terms and relative to their last benchmarks.

Get 25% off with Coupon Code: cjcwp1

GoDaddyLogo


WordPress Hosting Performance Benchmarks (November 2014)

LoadStormLogo

Sponsored by LoadStorm. The easy and cost effective load testing tool for web and mobile applications.

This is the second round of managed WordPress web hosting performance testing. You can see the original here. The latest (2015 Edition) can be found here.

Companies Tested

A Small Orange* [Reviews]
BlueHost [Reviews]
CloudWays* [Reviews]
DreamHost [Reviews]
FlyWheel* [Reviews]
GoDaddy* [Reviews]
Kinsta*
LightningBase*
MediaTemple* [Reviews]
Nexcess*
Pagely* [Reviews]
Pantheon* [Reviews]
PressLabs*
SiteGround*† [Reviews]
WebSynthesis* [Reviews]
WPEngine* [Reviews]

Note: Digital Ocean and Pressable were removed from testing.

*Company donated an account to test on. I checked to make sure I was on what appeared to be a normal server.

†Tests were performed with SiteGround's proprietary SuperCacher module turned on fully.

The Products (Click for Interactive Table)


wordpress hosting product chart screenshot

Methodology

The question I tried to answer is how well do these WordPress hosting services perform? I tested each company on two distinct measures of performance: peak performance and consistency.

All tests were performed on an identical WordPress dummy website with the same plugins except in cases where hosts added extra plugins. Each site was monitored for one month (July 2014) for consistency.

1. LoadStorm

LoadStorm was kind enough to give me unlimited resources to perform load testing on their platform and multiple staff members were involved in designing and testing these WordPress hosts. I created identical scripts for each host to load a site, login to the site and browse the site. Then I increased the user load until a web host started to fail. I stopped at 2000 concurrent users for the web hosts that were left unscathed by load testing. Logged in users were designed to break some of the caching and better simulate real user load which a lot of people (both readers and hosting companies) requested after the first round of testing.

2. Blitz.io

I used Blitz again to compare against previous results. First test was 60 seconds, scaling from 1-1000 users. The second test was 60 seconds, scaling from 1-2000.

3. Uptime (UptimeRobot and StatusCake)

Consistency matters. I wanted to see how well these companies performed over a longer period of time. I used two separate uptime monitoring services over the course of a month to test consistency.

4. WebPageTest.org

"WebPagetest is an open source project that is primarily being developed and supported by Google as part of our efforts to make the web faster." WebPageTest grades performance and allows you to run tests from multiple locations simulating real users. I tested from Dulles, VA, Miami, FL, Denver, CO, and Los Angeles, CA.

Background Information

Before I go over the results I wanted to explain and discuss a few things. Every provider I tested had the latest version of WordPress installed. I had to ask a lot of companies to disable some security features to perform accurate load tests. Those companies were: GoDaddy, LightningBase, MediaTemple, SiteGround and WebSynthesis. I also asked DreamHost and WPEngine, but they refused my request.

Some companies were more cooperative than others. SiteGround spent hours with me customizing their security features to let the load testing tools bypass their security measures. PressLabs ran into an issue we were never able to resolve to get Load Storm to work properly on their servers. We spent hours trying to fix it, but couldn't find a solution. That's why they are missing some test data.

CloudWays is an interesting platform that let's you deploy your WordPress stack to either Digital Ocean or Amazon's EC2 servers. I was given a server on each platform of near comparable specs (EC2 Small 1.7GB vs Digital Ocean 2GB). So CloudWays is listed as CloudWays AWS and CloudWays DO to indicate which provider the stack was running on.

Pantheon was tested on their free development environment which I was told is identical to their production environment.

Results

Load Storm

I ran multiple Load Storm tests to get a sense of where to start testing. The first was 1-100 users, which not a single company struggled with. The second was 50-500 users, which again nobody struggled with. So the first meaningful test was 100-1000 users. For the companies that didn't struggle there, I did a 500-2000 user test. I ran these tests with an immense amount of help from Scott Price at LoadStorm. He spent hours with me, teaching me how to use LoadStorm, build tests and offering guidance/feedback on the tests themselves.

 Test 1. 100-1000 Concurrent Users over 30 minutes


Request Count Average RPS Peak Response Time (ms) Average Response Time (ms) Average Throughput (kB/s) Errors
A Small Orange 116127 64.52 2752 356 1318.55 41
BlueHost 107427 59.68 16727 1306 1159.55 13351
Cloudways DO 103359 55.57 16983 1807 1169.28 2255
Cloudways AWS 87447 47.01 16286 5436 821.75 18530
DreamHost 115634 62.17 15514 441 1244.31 4327
FlyWheel 116027 62.38 775 368 1287.86 0
GoDaddy 133133 71.58 1905 434 3883.42 0
Kinsta 116661 62.72 552 309 1294.77 0
LightningBase 117062 62.94 1319 256 1324.89 12
MediaTemple 116120 62.43 793 403 1304.27 0
Nexcess 116634 62.71 15085 294 1299.85 8
Pagely 119768 64.39 1548 461 1227.06 0
Pantheon 117333 63.08 528 264 1316.41 0
SiteGround 117961 63.42 939 165 180.09 0
WebSynthesis 116327 62.54 1101 332 1285.83 0
WPEngine 123901 68.83 10111 416 1302.44 2956

Discussion of Load Storm Test 1 Results

There was a pretty clear division of good and bad performance in this test. Most companies didn't struggle at all. A few collapsed: BlueHost, CloudWays AWS, CloudWays DO, and DreamHost. BlueHost started spewing 500 errors almost as soon as we started. CloudWays AWS started timing out immediately. CloudWays DO started having issues around 800 users and then started timing out. DreamHost started giving 503 Service Unavailable almost right away. It looks like our script triggered a security mechanism but they refused to work with me to test any further.

SiteGround ran into a security measure we weren't able to get around in time for publishing this article. The server seemed to just throttle the connection again.

PressLabs isn't listed because we couldn't get LoadStorm to work on their system. I am not sure what was different about their backend, but I tried to work with PressLabs and LoadStorm to get it working to no avail.


  • Load-Storm-A-Small-Orange-2000
  • Load-Storm-Fly-Wheel-2000
  • Load-Storm-GoDaddy-2000
  • Load-Storm-Kinsta-2000
  • Load-Storm-Lightning-Base-2000
  • Load-Storm-Nexcess-2000
  • Load-Storm-Pagely-2000
  • Load-Storm-Pantheon-2000
  • Load-Storm-SiteGround-2000
  • Load-Storm-WebSynthesis-2000

Test 2. 500 - 2000 Concurrent Users over 30 Minutes

I removed the hosts that failed and doubled the concurrent users for the second test.

Request Count Average RPS Peak Response Time (ms) Average Response Time (ms) Average Throughput (kB/s) Errors
A Small Orange 248249 133.47 5905 436 2639.68 0
FlyWheel 236474 127.14 3811 983 2499.11 16841
GoDaddy 285071 153.26 8896 371 8255.24 92
Kinsta 248765 133.74 942 316 2714.82 0
LightningBase 248679 133.7 3887 343 2763.92 23
MediaTemple 249125 133.94 1499 313 2748.32 9
Nexcess 243115 130.71 15097 388 2644.72 80
Pagely 256163 137.72 15078 446 2621.04 1
Pantheon 250063 134.44 1111 297 2754.67 0
WebSynthesis 240305 129.2 4389 743 2598.83 1173

Discussion of Load Storm Test 2 Results 

FlyWheel started to fail around 1500 users causing 502 errors and remained constant at that level of failure. I'm not sure what the bottleneck was, but it didn't overload the server, but I suspect the I/O of something bottle-necked causing a certain amount of requests to fail. WebSynthesis had a few errors as well, they were 5 separate spikes somewhat evenly spaced out. The server didn't show signs of failure, it looks like it might have been an issue with caches being refreshed and some requests failing in the meantime. WebSynthesis' error rate was still under 0.5%, so I don't have any real issue with those errors. The slower average response time can also be attributed to the spikes in performance.

Remarkably, some companies didn't even struggle. Kinsta kept sub one second response times for 30 minutes and nearly a quarter million requests. Most companies had a spike or two causing a higher peak response time, but Kinsta and Pantheon didn't (and Media Temple had a tiny one at 1.5 seconds). Simply amazing performance.

Another interesting note, GoDaddy pushed triple the amount of data through because their admin screen had a lot more resources being loaded. That's why the average throughput is so high. Despite that fact, it didn't seem to impact their performance at all, which is astounding.

Full Interactive Test Results

A Small Orange
FlyWheel
GoDaddy
Kinsta
LightningBase
MediaTemple
Nexcess
Pagely
Pantheon
SiteGround
WebSynthesis

Blitz.io

 Test 1. 1-1000 Concurrent Users over 60 seconds

Blitz Test 1. Quick Results Table

Success Errors Timeouts Avg Hits/Second Avg Response (ms)
A Small Orange 27595 14 0 460 67 ms
BlueHost 23794 1134 189 397 160 ms
CloudWays AWS 24070 162 148 401 138 ms
CloudWays DO 27132 118 127 452 49 ms
DreamHost 13073 45 7885 218 21 ms
FlyWheel 28669 20 10 478 27 ms
GoDaddy 26623 8 5 444 104 ms
Kinsta 27544 0 0 459 69 ms
LightningBase 27893 0 1 465 56 ms
MediaTemple 26691 8 9 445 102 ms
Nexcess 18890 2288 641 337 517 ms
Pagely 25358 9 0 423 156 ms
Pantheon 27676 21 0 461 64 ms
PressLabs 25903 143 0 432 89 ms
SiteGround 24939 0 0 416 152 ms
WebSynthesis 28913 0 0 482 19 ms
WPEngine 23074 121 4 385 247 ms

Discussion of Blitz Test 1 Results

I learned from the last round of testing that any hosting that isn't optimized at all for WordPress (default install) will get destroyed by these tests. So I didn't include any of them this time. There wasn't any as catastrophic failures this time.

Who performed without any major issues?

A Small Orange, FlyWheel, GoDaddy, Kinsta, LightningBase, MediaTemple, Pagely, Pantheon, SiteGround, WebSynthesis all performed near perfect. There's nothing more to say for these companies other than they did excellent. All of their error/time rates were below 0.5%.

Who had some minor issues?

CloudWays AWS, CloudWays DO, PressLabs and WPEngine. All four of these providers had over 100 errors/timeouts and had an error/timeout rates between 0.5%-2%. Not a huge deal, but definitely not perfect.

Who had some major issues?

BlueHost, DreamHost, and Nexcess. BlueHost started show stress around 40 seconds in and started to buckle around 47 seconds. DreamHost had a couple spikes in response time and errors. However, it looks like the load testing tool may have hit some type of security limit because requests started timing out but it gave very fast responses and maintained roughly 250 hits/second constantly. It doesn't look like the server was failing. I couldn't get them to disable the security to really test it, so it's hard to say much more. Nexcess started to show stress around 20 seconds and buckle around 30 seconds.

 Test 2. 1-2000 Concurrent Users over 60 seconds

  • Blitz-A-Small-Orange-2000
  • Blitz-Blue-Host-2000
  • Blitz-CloudWays-AWS-2000
  • Blitz-CloudWays-DO-2000
  • Blitz-Dream-Host-2000
  • Blitz-Fly-Wheel-2000
  • Blitz-GoDaddy-2000
  • Blitz-Kinsta-2000
  • Blitz-LightningBase-2000
  • Blitz-Media-Temple-2000
  • Blitz-Nexcess-2000
  • Blitz-Pagely-2000
  • Blitz-Pantheon-2000
  • Blitz-PressLabs-2000
  • Blitz-SiteGround-2000
  • Blitz-WebSynthesis-2000
  • Blitz-WPEngine-2000

Blitz Test 2. Quick Results Table

Success Errors Timeouts Avg Hits/Second Avg Response (ms)
A Small Orange 54152 26 1 903 77 ms
BlueHost 29394 14368 3408 490 234 ms
CloudWays AWS 25498 4780 8865 425 338 ms
CloudWays DO 53034 1477 49 884 58 ms
DreamHost 10237 5201 20396 171 201 ms
FlyWheel 56940 121 68 949 29 ms
GoDaddy 53262 29 64 888 105 ms
Kinsta 55011 32 0 917 69 ms
LightningBase 55648 0 0 927 58 ms
MediaTemple 53363 16 28 889 100 ms
Nexcess 25556 15509 4666 426 279 ms
Pagely 51235 41 2 854 147 ms
Pantheon 55187 91 0 920 65 ms
PressLabs 35547 4105 1569 592 326 ms
SiteGround 42645 490 220 711 276 ms
WebSynthesis 57776 1 0 963 20 ms
WPEngine 39890 304 333 665 364 ms

Discussion of Blitz Test 2 Results

Who performed without any major issues?

A Small Orange, FlyWheel, GoDaddy, Kinsta, LightningBase, MediaTemple, Pagely, Pantheon, WebSynthesis all performed near perfect. All of their error/time rates were around 0.5% or lower.

Who had some minor issues?

SiteGround and WPEngine. All four of these providers had over 100 errors/timeouts and had an error/timeout rates between 0.5%-2%. SiteGround started to show some stress around 30 seconds and didn't started to have real issues after 50 seconds (errors). WPEngine started to show stress around 20 seconds and performed slightly erratically until the end of the test.

Who had some major issues?

BlueHost, CloudWays AWS, CloudWays DO, DreamHost, Nexcess, and PressLabs. The four that had major issues from last around completely failed with error/timeout rates exceeding 50%. DreamHost who looked like it was fine behind the security measures buckled around 35 seconds into this test and started returning errors, increased response times and the hits/second dropped. CloudWays DO definitely started to stress and show signs of buckling around 50 seconds. But its error rate was still under 3%. I don't think it would have lasted much longer had the tests gone further, but it was the least worst failure. PressLabs was a surprise, it started to show stress around 25 seconds and started to buckle around 35 seconds into the test.

 Full Blitz Results (PDFs)

A Small OrangeBlueHost, CloudWays AWS, CloudWays DO, DreamHost, FlyWheel, GoDaddy, Kinsta, LightningBase, MediaTemple, Nexcess, Pagely, Pantheon, PressLabs, SiteGroundWebSynthesis, WPEngine.

Uptime Monitoring

Both uptime monitoring solutions were third party providers that offer free services. All the companies were monitored over an entire month (July 2014).

Uptime Robot

Uptime (%)
A Small Orange 100
BlueHost 99.71
CloudWays AWS 100
CloudWays DO 99.93
DreamHost 99.92
FlyWheel 99.97
GoDaddy 99.9
Kinsta 100
LightningBase 100
MediaTemple 99.81
Nexcess 100
Pagely 99.95
Pantheon 100
PressLabs 100
SiteGround 100
WebSynthesis 100
WPEngine 100

According to UptimeRobot not a single company was below 99.5% uptime. In fact, with the exception of Media Temple and BlueHost, they were all above 99.9% uptime. For reference 99.5% uptime is 3.5 hours of downtime per month. 99.9% is <45 minutes of downtime per month. Overall, nothing to really complain about according to Uptime Robot.

StatusCake

Availability (%) Response Time (ms)
A Small Orange 1 0.23s
BlueHost 0.9969 2.45s
CloudWays AWS 0.998 0.75s
CloudWays DO 1 2.41s
DreamHost 1 2.22s
FlyWheel 0.999 1.99s
GoDaddy 1 2.41s
Kinsta 1 2.13s
LightningBase 1 1.6s
MediaTemple 1 1.18s
Nexcess 1 2.33s
Pagely 1 2.49s
Pantheon 1 2.04s
PressLabs 1 1.49s
SiteGround 0.9993 1.64s
WebSynthesis 1 1.77s
WPEngine 1 2.76s

According to StatusCake, the results look even better. I used multiple services to monitor because there can be networking issues unrelated to a web host's performance. StatusCake only detected issues with four companies, which is fewer than UptimeRobot detected. It's hard to say which is better or right. But they both say that uptime didn't really seem to be an issue for any company.

StatusCake also provides an average response time metric. According to them, it's using a browser instance and fully rendering the page. They also have many different geographical locations that they are testing from. I don't have any further insight into these tools beyond what I can read on their documentation. If they are to be believed, A Small Orange has astonishingly fast performance. WPEngine is the slowest average load time at 2.76 seconds which isn't that bad.


WebPageTest.org

Every test was run with the settings: Chrome Browser, 9 Runs, native connection (no traffic shaping), first view only. This was tested against the default install from every company.

Company Dulles,VA Miami, FL Denver, CO Los Angeles, CA Average
A Small Orange 1.443 0.801 0.836 0.64 0.93
BlueHost 1.925 1.321 1.012 0.785 1.26075
CloudWays AWS 0.655 0.867 0.967 0.746 0.80875
CloudWays DO 0.493 0.851 1.036 0.811 0.79775
DreamHost 1.177 0.863 1.067 1.147 1.0635
FlyWheel 0.497 0.864 1.066 1.109 0.884
GoDaddy 1.607 1.355 0.934 0.855 1.18775
Kinsta 0.759 0.752 0.947 0.592 0.7625
LightningBase 0.584 0.787 0.936 0.675 0.7455
MediaTemple 1.516 0.983 0.955 0.555 1.00225
Nexcess 1.433 1.139 1.196 0.859 1.15675
Pagely 6.831 0.86 0.913 0.709 2.32825
Pantheon 0.654 0.828 0.923 0.954 0.83975
PressLabs 0.715 1.018 1.213 0.723 0.91725
SiteGround 1.392 1.239 1.01 1.212 1.21325
WebSynthesis 0.407 0.835 0.982 1.024 0.812
WPEngine 0.821 1.086 0.839 0.685 0.85775

There isn't much surprising here. The pack is really tight with less than a half second difference average between the top and bottom hosts. If we exclude Pagely. I'm not sure what happened with their Dulles, VA test, but it seems like there was something terribly wrong with the network when I tested it. The average response times from every other location were incredibly fast (<1 second). I'm going to chalk it up to a bad node somewhere causing that particular test to perform so poorly, almost certainly not a reflection of their hosting.

What is interesting, compared to last time is that these companies are getting faster. There was only one company with a sub 1 second average last time. Now there are 10 companies (11 if you count Pagely). Three of them were above one second last time, so they are showing signs of improvement (Pagely, WebSynthesis, WPEngine). It also means there is a lot of new competition that is not behind the entrenched players in terms of performance.

Conclusion

Every service seems to have their issues somewhere if you look hard enough. I try to avoid injecting my personal opinion and bias as much as possible. So I won't be ranking or outright saying any single company is the best. Some providers did exceptionally well and tended to clump together performance-wise, I will call those the top tier providers. This top tier designation is related to performance only and is claimed only from the results of these tests. What each of these companies is offering is different and may best suit different audiences depending on a variety of factors beyond performance, such as features, price, support, and scale (I tested mostly entry level plans). But I will provide a short summary and discussion of the results for each provider.

Top Tier WordPress Hosting Performance

A Small Orange, GoDaddy, Kinsta, LightningBase, MediaTemple, Pagely, Pantheon, WebSynthesis

Each of these companies were below the 0.5% error rate on all load testing all the way up to 2000 concurrent users on both LoadStorm and Blitz.

Honorable Mention

FlyWheel gets an honorable mention. They performed really well on many of the tests. FlyWheel fell apart on the final LoadStorm test to 2000 logged in users. I'll explain more in their individual section as to why this is deserving of an honorable mention.

Amazon Web Services (AWS) vs Digital Ocean

One of the most interesting comparisons to me was CloudWays. They provide you with the ability to choose which VPS provider and type you want. It then sets up their WordPress configuration (in an identical manner from my understanding) on the VPS. I was granted access to one Amazon and one Digital Ocean VPS from them. The Amazon was a small (1.7GB ram) and the Digital Ocean was a 2GB ram instance.

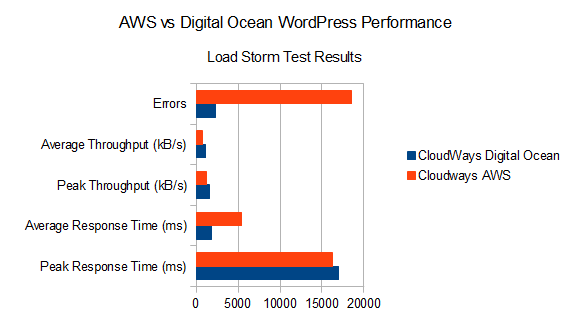
aws_vs_digital_ocean_loadstorm

The head-to-head results from LoadStorm (1000 user test) results above pretty clearly show Digital ocean performing better in every category (with the exception of Peak Response Time which is a timeout). Digital Ocean sent more data, had less errors and it did it faster.

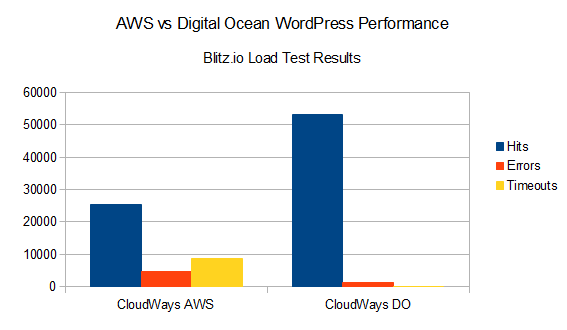
aws_vs_digital_ocean_blitz

The Blitz.io results show pretty clearly that Digital Ocean is outperforming AWS by a wide margin as well. It delivered twice as many hits with less errors and time outs.

It's pretty easy to conclude based on the tests that on the low-end VPSs, that Digital Ocean's hardware outperforms Amazon's hardware.

Individual Host Analysis

A Small Orange

They've improved their LEMP stack since the last time I tested. They never buckled in any test and were definitely one of the best. Their staff was incredibly friendly (special thank you to Ryan MacDonald) and they've stepped up their performance game. The one thing that isn't quite there yet is the documentation/user experience, there are a lot of improvements they could make to make their LEMP stack more accessible to the less tech savvy. All in all, the experience was in-line with what I would expect from a company that has one of the highest support ratings on our site.

BlueHost

Their WordPress offering is brand new. It struggled in every load test. Their price is on the middle-high end but the performance was not. Ultimately, they fell short of where I would expect based on pricing and the competition.

CloudWays

CloudWays was certainly an interesting company to test given that they had two entries, one running on Amazon Web Services (EC2) and another on Digital Ocean. The Digital Ocean VPS outperformed AWS in every category which was interesting. The AWS instance's performance was near the bottom of the pack performance wise, but the Digital Ocean one was in the middle. It is a very interesting platform they have built which allows deployment and management across providers. However, their performance isn't quite there yet. Other companies are running on the same hardware and getting better results. CloudWays doesn't do just WordPress, so it's easy to understand why their performance might not quite be as good as some of their competitors who solely focus on WordPress.

DreamHost

DreamPress was another disappointment. The security features hid some of the performance weakness on the first Blitz test, but it completely failed on the second. The way DreamPress is designed it says it has automatic RAM scaling and each site is run by two VPS instances. It's very unclear what resources you are really getting for your money. They are charging $50/month for a 1GB ram VPS, so I get the feeling a lot of resources are shared and it may not be a true VPS.

FlyWheel

FlyWheel were excellent on every test except the final 2000 logged in user test from LoadStorm. They are built on top of Digital Ocean and I was using the smallest VPS. Yet their performance beat VPSs on Digital Ocean that had four times the resources (CloudWays DO). For cached content on the Blitz test, they had the second highest hits/second and response time. I suspect the testing hit a hardware maximum. FlyWheel had the best performance with the lowest dedicated resources (512MB ram). The companies that outperformed it had more resources dedicated to them or shared resources which presumably would allow access to far greater than 512MB ram. It was an impressive performance given what they are selling and combined with them having the best reviews of any company Review Signal has ever tracked. FlyWheel certainly merit serious consideration.

GoDaddy

GoDaddy continues to surprise me. They flew through all the tests, including a weird issue where they transferred 3X the data during the LoadStorm test and didn't show any signs of stress. The only comparison I have to last time is the Blitz testing, where they eked out another 3000+ hits and raised their hits/second from 829 to 888. GoDaddy also raised their max hit rate marginally from 1750 to 1763. What's more impressive is they reduced their errors+timeouts from 686 to 93. More hits with less errors. From a performance perspective, they did excellent in absolute terms and relative to their last benchmarks.

Kinsta

A new-comer that jumped straight to the top of the performance tiers. Kinsta's performance was amazing in the Load Storm 2000 logged in user test. They had the lowest peak response time and zero errors over a 30 minute test. They didn't struggle with any tests whatsoever and showed zero downtime. Kinsta's performance was top tier.

LightningBase

Another new-comer that jumped straight to the top. One of the cheapest too starting at under $10. LightningBase aced the Blitz testing and did excellent on Load Storm. There was no downtime monitored. LightningBase belongs in the top tier and is delivering amazing value.

Media Temple

Media Temple is interesting because I was told it was running the same technology as GoDaddy (GoDaddy bought Media Temple a year ago). They have a few more premium features like Git and a staging environment. Media Temple's performance was superb. It actually beat GoDaddy's performance in just about every measure by a marginal amount on both Load Storm and Blitz's load testing. If GoDaddy has top tier performance, Media Temple certainly does as well.

Nexcess

Nexcess's performance was excellent in the Load Storm testing. However, it completely collapsed during the Blitz load testing. I'm really not sure what to make of those results. Perhaps the underlying shared hardware is very good but the static caching setup isn't quite up to snuff? It's probably not worth speculating, suffice to say, Nexcess ended up looking like a middle of the pack web host instead of a top tier one because of the Blitz test.

Pagely

Pagely put on another spectacular performance. They handled the Load Storm test with 1 error. Blitz results stayed similar to the last run. They handled more hits, but had a few more errors+timeouts (1 last time, 43 this time). Really not much to add here other than they continue to be in the top tier.

Pantheon

Pantheon specialized in Drupal hosting, so I was wondering how well it would translate to WordPress. The short answer is, it converted over really well. They had a flawless run on the LoadStorm test - 0 errors and not even any spikes in response time over 30 minutes. They are one of the most expensive (only second to PressLabs) options on this list, but definitely make a case for it. Perfect uptime and near flawless load testing sent them easily into the top tier.

PressLabs

It's hard to write much about PressLabs because we couldn't get LoadStorm to work properly to test out their hosting. However, their Blitz results were lackluster. For the most expensive plan we tested, it was a bit of a disappointment to see it not do stunningly well.

SiteGround

SiteGround sadly didn't do as well as they did last time. Their Blitz load testing score went down slightly. We couldn't bypass their security measures to properly test Load Storm. They obviously have some good protection measures to prevent malicious users from trying to access too many things, but it also meant I couldn't get a deeper look this time around. That was a change from the last round of testing. Slightly disappointing to see the performance dip, but I hope it was due to the extra security measures they put in place that made testing them difficult.

WebSynthesis

WebSynthesis was teetering on the Load Storm test of having too many errors (0.5%), but they were under it and handled the test quite well. They also had no weird security issues this time around, and WebSynthesis led the pack on Blitz testing. They went from 871 hits/second to 963 hits/second; leading every provider on the Blitz tests with a whopping 1 error to boot. Sprinkle in some perfect up time numbers and it's clear WebSynthesis is still a top tier provider and is continuing to get better.

WPEngine

I feel like I could copy+paste my last conclusion about WPEngine. "WPEngine had some issues. Uptime was not one of them, they were perfect or upwards of 99.9% in that department. However, their performance shortcomings became apparent during the load tests." They didn't even make it to the final round of Load Storm testing. They were also middle of the pack on the Blitz testing. Compared to the last round of Blitz testing, the results were nearly identical, with slightly fewer errors+timeouts. I'm not sure if I should be disappointed to not see improvement or relieved to see them maintain the exact same performance and consistency. Their vaunted rankings on Review Signal's reviews have slipped relative to a few of the other providers on here (FlyWheel and WebSynthesis). While they were once leading the pack in technology, the rest of the pack is starting to catch up.


Thank Yous

A special thanks goes out to the sponsor of this post and an individual employee, Scott Price of Load Storm, who worked countless hours with me in order to perform these tests.

I want to thank all the companies that participated in these tests. I tested the support staff a fair bit at some of them and I thank them for their time and patience.

A special thanks goes to Chris Piepho from LightningBase also provided a lot of feedback based on the original article and helped improve the methodology for this round.

A huge thanks goes out to Mark Gavalda at Kinsta for his feedback and performance testing discussions. He's tested some further out stuff than I have like HHVM and php-ng performance. Also to their designer, Peter Sziraki, who designed the the header image for this article.


40 Million hits a day on WordPress using a $10 VPS

I recently tested many of the biggest names in managed WordPress hosting in my article Managed WordPress Hosting Performance Benchmarks. (Update: 2016 WordPress Hosting Performance Benchmarks) I am preparing to do a second round of testing with double the number of companies on board. Some of us like to setup servers ourselves (or are cheap).

Given a reasonable VPS, what sort of performance can we get out of it?

10 million hits as measured by Blitz.io was the benchmark to beat based on a previous iteration of this question.

I decided to test this from the ground up, let's start with the most basic configuration and gradually try to improve it.

All tests were performed on a $10/Month 1GB Ram Digital Ocean VPS running Ubuntu 14.04x64. All code and documentation are also available on GitHub.

LAMP Stack

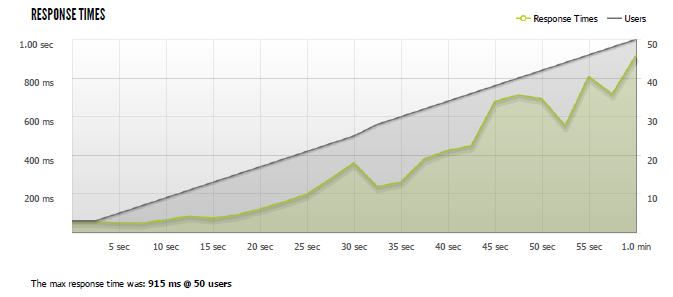
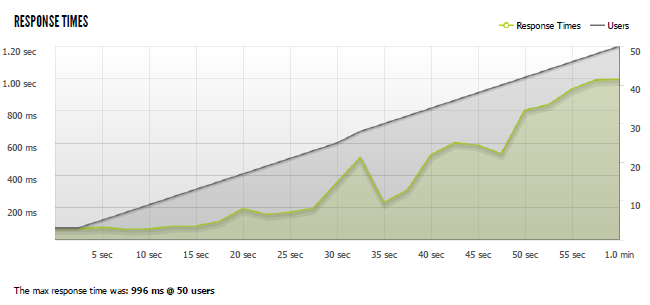
Based on my previous experience benchmarking WordPress, I didn't have high hopes for this test. Last time I crashed MySql almost instantly. This time I ran Blitz a lot slower, from 1-50 users. The performance wasn't impressive, it started slowing down almost immediately and continued to get worse. No surprises.

default-lamp

The LAMP stack setup script is available on GitHub. Download full Blitz results from LAMP Stack (PDF).

LAMP + PHP5-FPM

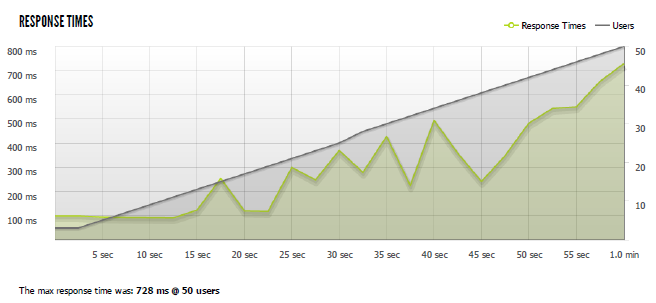
The next thing I tried was PHP-FPM(FastCGI Process Manager). It got slightly better performance with just under 200ms faster response times at 50 users. But the graph looks pretty similar, we're seeing quickly increasing response times as the number of users goes up. Not a great improvement.

lamp-php-fpm

The LAMP+ PHP5-FPM setup script is available on GitHub. Download full Blitz results from LAMP+PHP5-FPM (PDF).

Nginx + PHP-FPM (aka LEMP Stack)

Maybe the problem is Apache? I tried Nginx next. What happened? I got a worse performance than the default LAMP stack (wtf?). Everyone said Nginx was faster. Turns out, it's not magically faster than Apache (and appears worse out of the box).

lemp-php-fpm

The LEMP + PHP-FPM setup script is available on GitHub. Download full Blitz results from LEMP+PHP-FPM (PDF).

Microcaching

I've written about creating a reverse proxy and cache in nginx before. But I've already setup Nginx as my web server, I don't need to reverse proxy this time. Nginx has fastcgi_cache which allows us to cache results from fastcgi processes (PHP). So I applied the same technique here and the results were staggering. The response time dropped to 20ms (+/- 2ms) and it scaled from 1 to 1000 concurrent users.

"This rush generated 28,924 successful hits in 60 seconds and we transferred 218.86 MB of data in and out of your app. The average hit rate of 482/second translates to about 41,650,560 hits/day."

All that with only 2 errors (connection timeouts).

lemp-microcache

The LEMP + PHP-FPM + microcaching setup script is available on GitHub. Download full Blitz results from LEMP+PHP-FPM + microcaching (PDF).

Mircocaching Config Walkthrough

We do the standard

apt-get update
apt-get -y install nginx
sudo apt-get -y install mysql-server mysql-client
apt-get install -y php5-mysql php5-fpm php5-gd php5-cli

This gets us Nginx, MySql and PHP-FPM.

Next we need to tweak some PHP-FPM settings. I am using some one liners to edit /etc/php5/fpm/php.ini and /etc/php5/fpm/pool.d/www.conf to uncomment and change some settings [turning cgi.fix_pathinfo=0 and uncommenting the listen.(owner|group|mode) settings].

sed -i "s/^;cgi.fix_pathinfo=1/cgi.fix_pathinfo=0/" /etc/php5/fpm/php.ini
sed -i "s/^;listen.owner = www-data/listen.owner = www-data/" /etc/php5/fpm/pool.d/www.conf
sed -i "s/^;listen.group = www-data/listen.group = www-data/" /etc/php5/fpm/pool.d/www.conf
sed -i "s/^;listen.mode = 0660/listen.mode = 0660/" /etc/php5/fpm/pool.d/www.conf

Now make sure we create a folder for our cache

mkdir /usr/share/nginx/cache

Which will we need in our Nginx configs. In our /etc/nginx/sites-available/default config we add this into our server {} settings. We also make sure to add index.php to our index command and set our server_name to a domain or IP.

location ~ \.php$ {
		try_files $uri =404;
		fastcgi_split_path_info ^(.+\.php)(/.+)$;
		fastcgi_cache  microcache;
		fastcgi_cache_key $scheme$host$request_uri$request_method;
		fastcgi_cache_valid 200 301 302 30s;
		fastcgi_cache_use_stale updating error timeout invalid_header http_500;
		fastcgi_pass_header Set-Cookie;
		fastcgi_pass_header Cookie;
		fastcgi_ignore_headers Cache-Control Expires Set-Cookie;
		fastcgi_pass unix:/var/run/php5-fpm.sock;
		fastcgi_index index.php;
		include fastcgi_params;
}

Then we move on to our /etc/nginx/nginx.conf and make a few changes. Like increasing our worker_connections. We also add this line in our http{} before including our other configs:

fastcgi_cache_path /usr/share/nginx/cache/fcgi levels=1:2 keys_zone=microcache:10m max_size=1024m inactive=1h;

This creates our fastcgi_cache.

All of these are done in somewhat ugly one-liners in the script (if someone has a cleaner way of doing this, please share!), I've cleaned them up and provided the full files for comparison.

Go Big or Go Home

Since Nginx didn't seem to blink when I hit it with 1000 users, I wondered how high it would really go. So I tried from 1-3000 users and guess what?

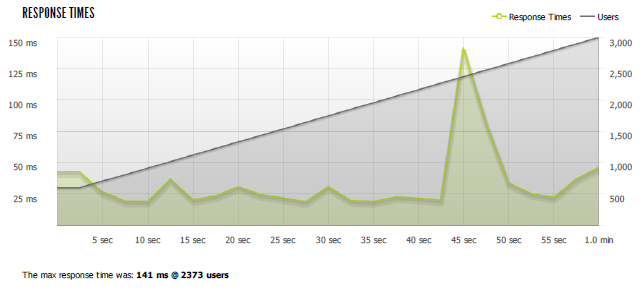
"This rush generated 95,116 successful hits in 60 seconds and we transferred 808.68 MB of data in and out of your app. The average hit rate of 1,585/second translates to about 136,967,040 hits/day."

The problem was I started getting errors: "4.74% of the users during this rush experienced timeouts or errors!" But it amazingly peaked at an astonishing 2,642 users per second. I watched my processes while the test was running and saw all 4 nginx workers fully maxing out the CPU (25% each) while the test was running. I think I hit the limit a 1GB, 1 Core VPS can handle. This setup was a champ though, I'm not sure what caused the big spike (perhaps a cache refresh), but if you wanted to roll your own WordPress VPS and serve a lot of static content, this template should be a pretty good starting point.
lemp-microcache-3000

Download full results of 3000 users blitz test (PDF)

Conclusion

There are definitely a lot of improvements that can be made on this config. It doesn't optimize anything that doesn't hit the cache (which will be any dynamic content, most often logged in users). It doesn't talk about security at all. It doesn't do a lot of things. If you aren't comfortable editing php, nginx and other linux configs/settings and are running an important website, you probably should go with a managed wordpress company. If you really need performance and can't manage it yourself, you need to look at our Managed WordPress Hosting Performance Benchmarks. If you just want a good web hosting company, take a look at our web hosting reviews and comparison table.

All code and documentation is available on GitHub

Thanks and Credits:

The title was inspired by Ewan Leith's post 10 Million hits a day on WordPress using a $15 server. Ewan built a server that handled 250 users/second without issue using Varnish, Nginx, PHP-APC, and W3 Total Cache.

A special thanks goes to A Small Orange who have let me test up multiple iterations of their LEMP stack and especially Ryan MacDonald at ASO who spent a lot of time talking WordPress performance with me.

Managed WordPress Hosting Showdown – Performance Benchmarks Comparison

UPDATE: Round 2 of Testing (November 2014) is now available.

WordPress as a platform has become the most popular CMS around, claiming to power almost 19% of the web. As a result, Managed WordPress hosting has become a very popular niche. Many companies in the managed WordPress space are charging a very high premium over the traditional shared web hosting providers. So beyond the marketing speak, what are you really getting? Most promise to make your life easier with features like automatic updates, backups, and security. They also claim to have great performance. It's hard to test objectively the ease-of-use features. But we can measure performance. There weren't many performance benchmarks that I could find, and the ones I could were not very thorough. So I began by designing my own set of testing.

Companies Tested

A Small Orange* [Reviews]
Digital Ocean [Reviews]
GoDaddy* [Reviews]
Pagely
Pressable*
SiteGround*† [Reviews]
WebSynthesis* [Reviews]
WPEngine [Reviews]

*Company donated an account to test on. I checked to make sure I was on what appeared to be a normal server. GoDaddy had over 3000 domains on the same IP. SiteGround had 887 domains. A Small Orange was a VPS, so it should be isolated. Pressable and WebSynthesis didn't have any accounts on the same IP. I am not sure how isolated they are in their environments.

†Tests were performed with SiteGround's proprietary SuperCacher module turned on fully unless otherwise specified.

The Products

I created a comparison chart of all the companies and the product used in this test. It was mostly the basic/cheapest offer with the exception of SiteGround, because their cheapest hosting plan didn't have full WordPress caching built in, but it was still very much within the price range of other offers.

(Click to see full table)

comparison_chart_web

Methodology

The question I tried to answer is how well do these WordPress hosting services perform? I tested each company on two distinct measures of performance: peak performance and consistency.

1. Blitz.io

Load testing from the most well known load testing service. First test was 60 seconds, from 8 locations each scaling from 1-125 concurrent users (total 1000 users). For this test each one was tested with identical theme (twenty fourteen) and the out of the box configuration. The second test was 60 seconds, from 2 locations (Virginia/California) scaling from 1-1000 (total 2000 users). The configuration of each site was identical with Customizr theme and plugins.

2. Uptime (UptimeRobot and Uptime - a node.js/mongo project)

Consistency matters. I wanted to see how well these companies performed over a longer period of time. I used two separate uptime monitoring services: one existing third party service and one open source project.

3. WebPageTest.org

"WebPagetest is an open source project that is primarily being developed and supported by Google as part of our efforts to make the web faster." WebPageTest grades performance and allows you to run tests from multiple locations simulating real users. I tested from Dulles, VA, Miami, FL, Denver, CO, and Los Angeles, CA.

4. Unnamed Load Testing Service*

This service asked to remain nameless in this article. They do natural load testing and are in beta. I tested each WordPress host with the same theme (twenty fourteen) and the out of the box configuration for this test. I ran into some issues with this service which I will discuss later.

Background Information

Before I go over the results I wanted to explain and discuss a few things. Every provider I tested had the latest version of WordPress installed. Every plugin that came with it was also up to date with the exception of GoDaddy which had an older version of JetPack included (17 days out of date when I first setup).

I had some trouble getting set up on A Small Orange, the signup email was stuck in gmail's spam filter. I also found a potentially minor security issue in their customer system which they promptly responded to and fixed. I also had to specifically ask for the customized WordPress LEMP stack to be installed on my VPS.

GoDaddy stores SFTP and other critical details on a separate area away from your main GoDaddy account and WordPress admin (gateway.godaddy.com for anyone stuck looking).

I ran into issues with Pressable's CNAME redirect. It seemed to cache a coming soon page and didn't resolve itself by clearing any cache I could find. It resolved itself over a day or so, but being stuck with a coming soon page wasn't a pleasant first experience.

SiteGround includes CloudFlare but I never got it working, it failed to configure on www. So I couldn't conduct the test with it enabled.

Pagely charges you extra for SFTP access (which I didn't pay for and made my own life a living hell while trying to do this test).

WebSynthesis came pre-installed with two themes that were out of date.

Results

Blitz.io

 Test 1. 1-125 Concurrent Users from 8 Locations over 60 seconds (Gallery)

 Discussion of Blitz Test 1 Results

The first thing I must note here is that two companies got absolutely destroyed by this test: Digital Ocean and A Small Orange.

My Digital Ocean VPS just died repeatedly. MySql died and needed to be manually restarted. I thought it was a bad instance, so I spun up another and got the same result. I even tried installing a caching plugin to see if I could get any performance out of their WordPress stack. I had absolutely no luck. Given this result, I eliminated Digital Ocean from the rest of my testing. You can run high performance WordPress sites on Digital Ocean (Review Signal's blog is running on one currently), but it requires knowing what you're doing and isn't recommended for people looking for managed WordPress hosting. Digital Ocean is a self-managed VPS provider; it's not for beginners or those who need managed support of their WordPress site. I included Digital Ocean to see how their offer would fare against specialized companies. The short answer is, it doesn't compare, at all.

Another out-of-the-box install with A Small Orange got crushed by this test too. After dconsulting with A Small Orange support, it became apparent I wasn't on their customized WordPress setup. I asked for it to be installed and all further tests were on this much more performant setup. You will see two sets of results for ASO, the normal and the LEMP stack, which is their high performance setup. One thing to note is that ASO offers less management on their customized WordPress setup because it no longer uses cPanel.

The lesson here is that WordPress, out-of-the-box with a LAMP stack, performs pretty badly. For a personal blog with low traffic, it probably won't matter, but for a site with any substantial amount of traffic, it will most likely crumble.

Who performed without any major issues?

A Small Orange (from now on, anytime I talk about ASO, it's about the specialized WordPress setup), Pagely, and SiteGround. Each of these companies had stable response times and few to no errors.

Who had some issues?

GoDaddy had an issue with errors in the middle of the test around 400 users but seemed to gracefully scale upwards without any difficulty and maintained steady load times and stopped erroring. Pressable's response times were a bit varied. Pressable didn't seem to have much trouble with the traffic because it had zero errors and minimal timeouts. WPEngine seemed to have a weird connection timeout issue around 600 users that resolved itself fairly quickly. WebSynthesis seemed to cap out at around 400 users/second with a few bursts. The response time remained steady and it was erroring (connection reset) instead of timing out. WebSynthesis support told me "We analyzed the logs on the server and some of your requests are not being cached as your tests are throwing over 14K symbols in a single URL. This is not realistic for normal use cases of WordPress." Nevertheless, they made a tweak to the nginx (webserver) config, and I tested it again in test 2.

Test 1. Quick Results Table

Success Errors Timeouts Avg Hits/second Avg Response (ms)
ASO 23788 18 2 396 241
GoDaddy 23962 165 0 399 227
Pagely 20132 1 0 336 459
Pressable 21033 0 19 351 412
SiteGround 19672 0 0 328 495
WebSynthesis 19995 4224 5 333 246
WPEngine 20512 192 196 342 395

GoDaddy, despite their small hiccups, managed to have the best average response time to 8 servers distributed across 5 continents (Virginia, Oregon, California, Singapore, Japan, Brazil, Australia, Ireland). Furthermore, they also managed to serve the most hits.

SiteGround had the slowest average response and lowest hits/second but also didn't have a single error or timeout and the response was consistent throughout the test.

A Small Orange's performance was stunningly consistent. The fastest response was 238ms and the slowest was 244ms, a difference of 6ms over nearly 24,000 requests. They were just barely behind GoDaddy in hits and average response.

Overall, other than WebSynthesis, no host seemed to have serious difficulty with this test.


 Test 2. 1-1000 Concurrent Users from 2 Locations over 60 seconds (Gallery)

Discussion of Blitz Test 2 Results

This test was designed to see just how much traffic these web hosts can handle. Blitz increased their pricing for multiple server locations while I was running this test. I had to reduce server locations from 8 down to 2 locations with higher user counts instead. The response times may be less meaningful, but I picked Virginia and California so that the test locations were on opposite sides of the US. I believe every server tested was in the US, so hopefully that was somewhat balanced, but the average response time may mean less than the stability of the response time.

Who performed without any major issues?

Pagely.

Who had some issues?

A Small Orange's setup definitely couldn't scale all the way up. Response times started increasing with increased users as did errors/timeouts. GoDaddy had some bizarre spikes that look similar to the one I saw in test 1, except three of them this time. Despite this, they pushed the most successful hits again and had the best ping of hosts that didn't completely error out. Pressable had some spikey performance similar to GoDaddy. Pressable pushed a lot of successful requests and did recover from the spikes. SiteGround hit a major spike but then seemed to kick into high gear and performed even better and finished out the test exceptionally strong and stable. WebSynthesis seemed to cap out at around 400 users/second with a few bursts again. The response time remained fairly steady and it was erroring (connection reset) instead of timing out again. WPEngine's response times got worse as the load increased and timeouts started to increase as well.

I included a screenshot from my uptime monitoring system. It's checking each host every 5 seconds, and I highlighted the hour in which all the tests took place. You can see some large spikes for companies that seemed to have latency struggles.


Test 2. Quick Results Table

Success Errors Timeouts Hits/second Avg Response (ms) Max Hit Rate (per second)
ASO 27057 777 518 451 739 597
GoDaddy 49711 685 1 829 148 1750
Pagely 48228 0 1 804 216 1580
Pressable 43815 503 9 730 271 1466
SiteGround 48735 12 19 812 263 1708
WebSynthesis 20855 35773 0 348 120 763
WPEngine 39784 25 1008 663 304 1149

GoDaddy seemed to have the best peak performance again. SiteGround and Pagely seemed to handle the load fantastically and didn't show any signs of performance issues (again). With the exception of A Small Orange, every host saw an improvement in average response time. As I wrote earlier, this may be because they were tested only from US locations. That caveat aside, the response times are a lot closer together and look pretty good for US based visitors. Still, this test also started to raise questions about many web hosts' ability to handle a heavy traffic load.

WebSynthesis Response to ECONNRESET Errors

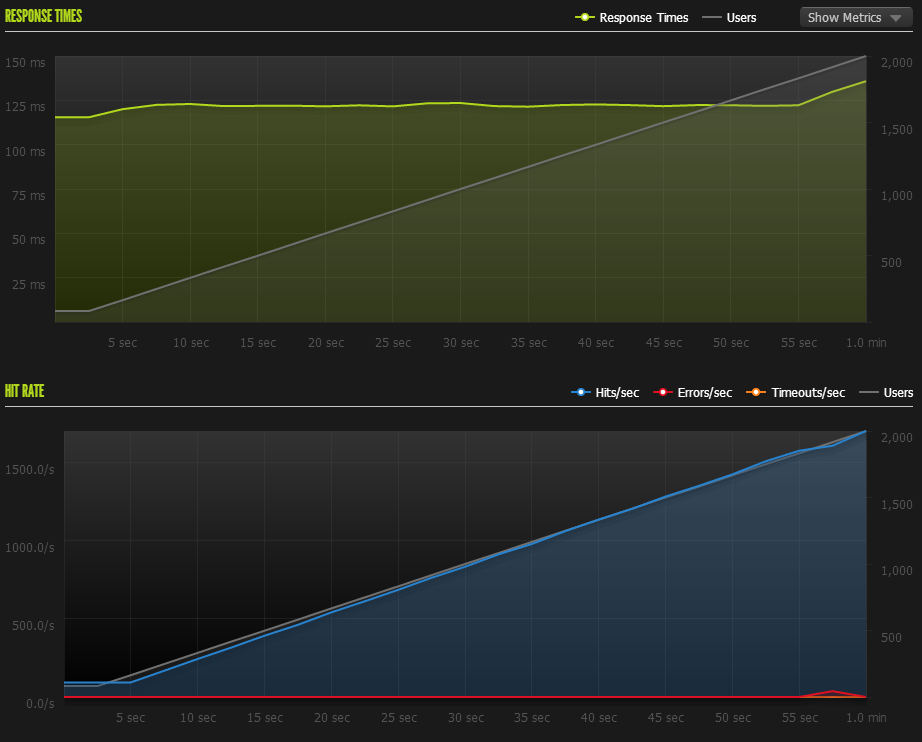
WebSynthesis ran into the same issue in both tests, a strange ECONNRESET error. Suspecting something may be blocking the test requests' as a security measure, I asked them to investigate. They made a change to their nginx config after the initial set of testing and wrote back "we made adjustments to handle the types of URLs you were hitting us with.  We did review our logs and do not see these in production thus will not put these kinds of changes in production as we feel they are unrealistic." Here are the results:
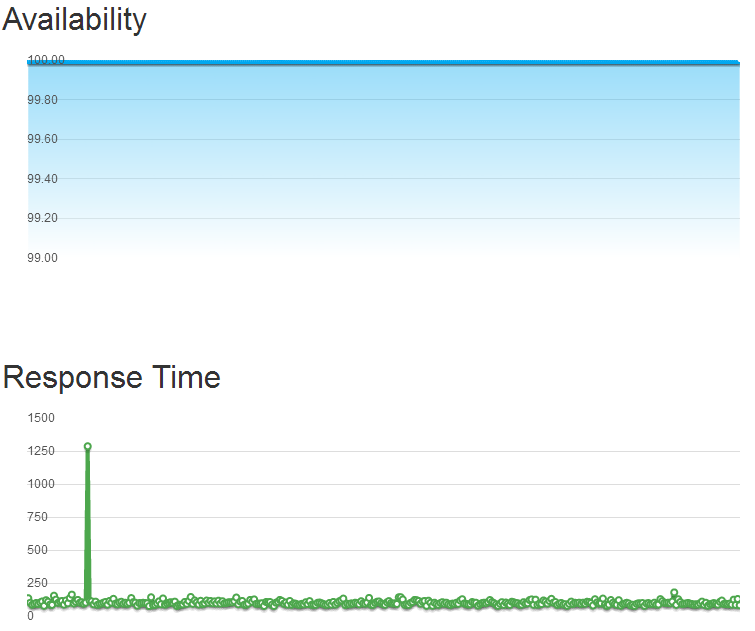
WebSynthesis2-blitz WebSynthesis2 (Download Full Report WebSynthesis2.pdf)

The new WebSynthesis results were pretty impressive. Average ping of 123ms (3ms slower than initial test), 871 hits/second average, 1704 hits/second and with only 94 errors (ECONNRESET again). The original tests did not suggest that either the hardware or software was starting to buckle. But the configuration change does indicate that they were probably blocking some of the requests. Load testing tools can't fully emulate users (they generally come from only a couple of machines) and it's conceivable that some security measures are triggered by their unusual behavior. Since I am testing these companies out of the box, I am leaving this result separate where support got involved and changed configuration settings.

Uptime

What is often more important than peak performance is how well a service does on average. To test this, I used two services: UptimeRobot and a NodeJS project called Uptime.

UptimeRobot Results

Monitored HTTP and Ping every 5 minutes. This was over a 10 day span.

HTTP Ping
ASO 1 1
GoDaddy 0.9979 -
Pagely 0.9862 -
Pressable 0.9995 1
SiteGround 0.9993 1
WebSynthesis 1 1
WPEngine 1 1

A Small Orange, WebSynthesis and WPEngine showed no downtime. Every server responded to pings 100% of the time with the exception of GoDaddy and Pagely which seemed to be blocking pings to the server (at least from UptimeRobot).

Pagely's downtime was mostly my own doing (3 hours), when I was editing a template  to use some of these testing services. Only 5 minutes of the downtime was unrelated to that incident.

GoDaddy had 28 minutes of downtime. SiteGround had 9 minutes. Pressable had 5 minutes.

When you account for my screwup, only GoDaddy shows up under the 99.9% uptime threshold.

Uptime (nodejs) Results

Uptime was configured to perform an HTTP check every 5 seconds on each host with a 1500ms slow threshold. This was executed from a Digital Ocean VPS in NYC.

Responsiveness is defined as the percentage of pings above slow threshold over the period. Availability is the uptime percentage.

Availability (%) Downtime (m) Response Time (ms) Responsiveness (%)
ASO 99.998 1 204 99.97
GoDaddy 99.963 17 309 99.679
Pagely 99.998 1 237 99.974
Pressable 99.914 39 727 90.87
SiteGround 99.997 1 206 99.616
WebSynthesis 99.994 3 97 99.727
WPEngine 99.965 16 209 99.819

Nobody had a perfect record although four companies (A Small Orange, Pagely, SiteGround and WebSynthesis) were above the 99.99% uptime marker. The rest were still all above 99.9%. The most worrisome result was Pressable because they had the most downtime and a very high average response time. This might be caused by the monitoring server being far away from their server. Below is a detailed graph of the response times:
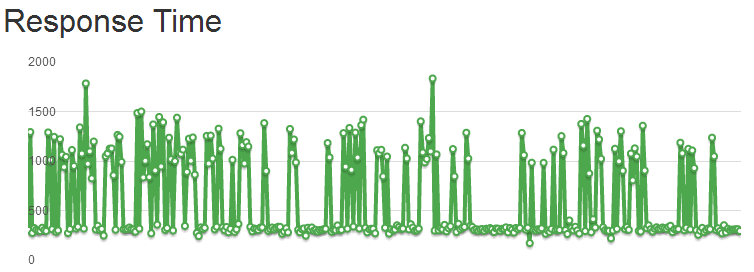
pressable_response_time

The lowest ping I saw was around 172ms and the relatively consistent bottom line of pings at around 300ms is reasonable. However, inconsistent performance with high spikes results in a very high average. Every other company had a fairly smooth graph in comparison. They show an occasional spike and/or some small variance (<100ms) between response at the base line, but nobody came close to a graph like Pressable's. The next most interesting is A Small Orange's graph:
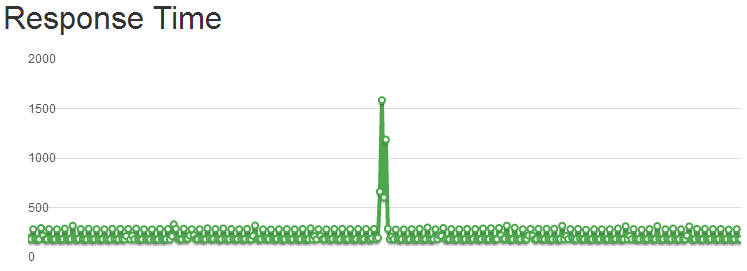
aso_response_time

Though within reasonable response times, it has a spike and a weird pattern bouncing between around 170ms and 270ms.

Giving Pressable the benefit of the doubt, I signed up for Pingdom and monitored what their service saw. This was done with 1 minute resolution.pressable_pingdom_uptime
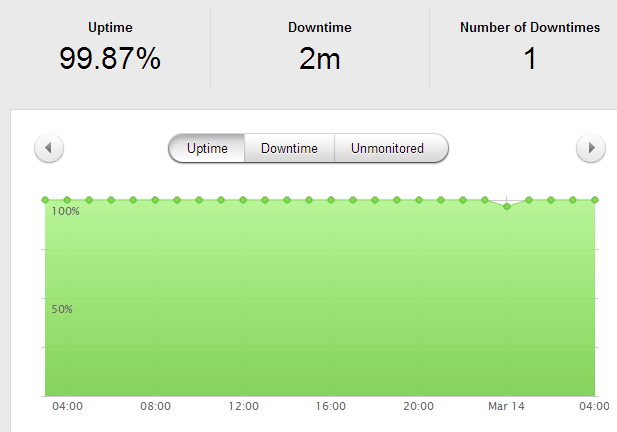
pressable_pingdom


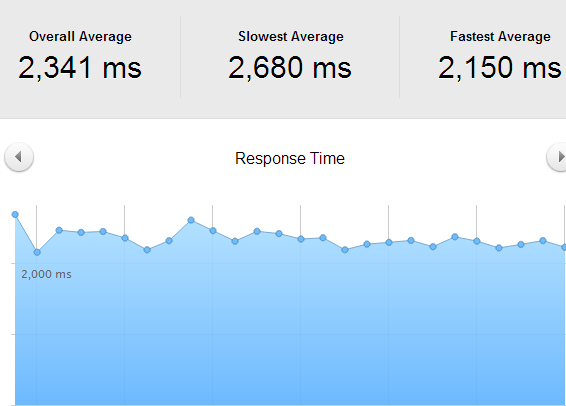
The pings varied pretty wildly, the highest being 2680ms and lowest 2150, a 530ms difference. And that was based on hourly averages; the variance within each hour may have been much greater. It would seem to corroborate the results from the Uptime script I was running, i.e. performance fluctuates a lot.


WebPageTest.org

Every test was run with the settings: Chrome Browser, 9 Runs, native connection (no traffic shaping), first view only. This was tested against the default install from every company. I also tested SiteGround's multiple levels of their SuperCache technology from one location to see how much it improved performance. SuperCache was left on for all the other tests performed. You will also notice the original A Small Orange and the WordPress optimized LEMP stack. Digital Ocean hadn't completely failed out at this point yet either.

Company Dulles,VA (s) Miami, FL (s) Denver, CO (s) Los Angeles, CA (s) Average Load (s)
A Small Orange 1.894 2.035 2.381 1.648 1.9895
ASO Lemp 0.85 0.961 1.056 0.665 0.883
Digital Ocean 1.245 0.95 1.419 0.924 1.1345
GoDaddy 0.94 1.208 1.229 0.671 1.012
Pressable 0.642 1.174 1.721 0.981 1.1295
SiteGround 1.073 1.327 1.682 1.353 1.35875
SiteGround (Varnish Dynamic Cache) 0.732
SiteGround (Varnish Dynamic Cache, Memcached) 0.725
SiteGround (PageSpeed, Memcached) 1.216
WPEngine 0.812 1.235 1.06 1.08 1.04675
Pagely 0.924 1.083 1.46 0.748 1.05375
WebSynthesis 0.616 1.021 1.516 1.116 1.06725

You can see a huge performance difference in A Small Orange's default cPanel install and their optimized LEMP stack. Load times were reduced by more than half from every location. That should convince you that optimizing WordPress can dramatically improve performance. To a lesser degree, you can see it happen when SiteGround's various SuperCache options are turned on.

A Small Orange's LEMP stack leads the pack here. However, it's amazing how close the performance of most of these companies was on this test.


Conclusion

Every service seems to have their issues somewhere. I try to avoid injecting my personal opinion and bias as much as possible. So I won't be ranking or outright saying any single company is the best. Some providers did exceptionally well and tended to clump together performance-wise, I will call those the top tier providers. This top tier designation is related to performance only and from the results of these tests. What each of these companies is offering is different and may best suit different audiences depending on a variety of factors beyond performance, such as features, price, support, and scale (I only tested entry level plans). But I will provide a short summary and discussion of the results for each provider.

A Small Orange

Once I moved away from the stock WordPress install on a normal VPS to their specialized LEMP WordPress VPS, it was a much better experience. Their uptime was near perfect on both services (1 minute of downtime total measured between them). The first load test it performed incredibly well and was 2nd by only a few requests per second. However, ASO did buckle under the heavier load test but it didn't fail out and managed to respond to most requests (including uptime monitoring) during the whole event. While their performance didn't scale as well as most of the competitors, I did receive a lot of support from them and it was quite responsive, in-line with what I would expect from a company that has one of the highest support ratings.

Digital Ocean

They are not in the same business as the rest of these companies. I added them because I wanted to see how well a stock install of WordPress would compete with pretty good hardware that's low cost (SSD backed VPS). The results here aren't a knock on their service at all. As I said earlier, this blog is running on a Digital Ocean VPS. The difference is I have spent many hours configuring it myself to be somewhat high performance. Digital Ocean is designed for people who can administrate their own servers. If you need managed WordPress hosting, stick to companies that are managing WordPress for you. If you're comfortable and want to do it yourself, these guys have one of the highest rated companies that we track.

GoDaddy

This whole test started from a statement made by Jeff King, a senior vice president at GoDaddy and GM of their hosting division. He wrote to me, "The new products are top of the market (really, you can’t get faster WordPress anywhere now) and we’re just beginning."  Challenge accepted.

GoDaddy surprised me, and in a good way. They have a pretty bad reputation in the web community and it shows on this site where their overall score is below 50%. Yet, their WordPress hosting kept up or led the pack in some of the performance tests. In both Blitz.io load tests, out-of-the-box, GoDaddy had the highest number of successful requests, the highest number of concurrent users, and either 1st or 2nd in average response time.  (WebSynthesis's performance did beat them when their support investigated connection resets) There were some weird performance bumps during the load tests, but nothing major. The biggest blot in terms of performance was on their uptime. They had the most downtime (28 minutes) of any of the companies tracked in UptimeRobot's monitoring (which ran longer than my second Uptime monitoring setup). But it was still 99.8% uptime, not a huge knock.

Overall, I would say GoDaddy delivered on their claim, performance wise. They appear to be in the top tier of specialized WordPress hosting companies. Given their price, I think they have the potential to push down pricing on most of their competitors who charge 3-4 times what GoDaddy charges. If we take a more holistic view, beyond performance, they still don't have all the tools to cater to the different niches that the specialized companies are competing for (although there were some hints dropped that things like Git, Staging Environments and more were coming soon). And then there is a branding problem they are trying to overcome. But GoDaddy is definitely doing some things very right and should make the managed WordPress hosting space very interesting.

Pagely

Pagely's performance didn't ever seem to get affected by any tests. They had a mere 5 minutes of downtime. The load testing services never seemed to cause any stress on their system. It was an impressively consistent performance. They didn't have the highest peak performance on the load tests, but they had a flat response time and only a single error or timeout in each blitz load test. One thing that irritated me about their offer was charging extra for SFTP access. Every other company included this for free and it's generally a given with a web hosting service. Still, a very impressive performance by Pagely, they are definitely in the top tier.

Pressable

Pressable had some issues during this test. I am not sure why but there was a very strange issue where performance seemed to repeatedly spike throughout my entire testing session. When it was good, it was performing at a level consistent with the top tier providers. The problem was, it wasn't always good. On the large Blitz load test there was consistent performance except for two spikes, which put it behind the front of the pack. It caused low responsiveness scores and potentially some downtime calculations as well. The foundation of a top tier provider is there, and generously open sourced on GitHub. They just need to sort out this weird performance spikiness issue.

SiteGround

Another very pleasant surprise in SiteGround. Not only are you getting cPanel hosting, you're getting top tier WordPress performance once you fully enable their SuperCacher plugin. They are one of the most well liked companies we track and have some of the best rated support. I honestly didn't know they were offering such high performance WordPress hosting. They didn't have the absolute fastest responses or push the highest concurrent users but they kept pace. They had one of the stranger graphs on the heavy load test, for some reason the performance got even better after a big spike. They had excellent uptime at above 99.9% measured by both services. Like GoDaddy, SiteGround looks like they could make this space interesting with a $7.95 plan performing on par with plans 3-4x its cost. While I didn't get to try some of the more developer-centric features like a staging environment and Git, they are available on a plan that's as little as 50% of the cost of the competitors at $14.95. Definitely in the top tier of managed WordPress providers.

WebSynthesis

These guys are harder to evaluate. Their uptime was excellent: either perfect or upwards of 99.9% as measured by the two services. The load testing ran into a weird ECONNRESET error. Their support was very helpful and made some configuration changes that seemed to allow the load testing service through. Once they did that, they outperformed every provider on almost every metric, highest average hits/second, fastest response and most successful hits with relatively flat response times. As I wrote in my discussion about them, load testing tools aren't a perfect emulation of real users. But it looked like it was running into a security rule rather than actual strain on the service. If that assumption is correct, these guys are truly a top tier provider.

WPEngine

WPEngine had some issues. Uptime was not one of them, they were perfect or upwards of 99.9% in that department. However, their performance shortcomings became apparent during the load tests. They had the most errors and timeouts, besides WebSynthesis, in the first test and seemed to buckle under the load in the second test with rising errors and timeouts and slower response times. When WPEngine was first listed here on Review Signal, they had the highest rating of any company. They've fallen a bit since then but WPEngine still remains near the front of the pack. They have a strong brand and seem to be doing some things right. They have some features that few other providers have, but this test was mostly about performance. In that department, they didn't quite match the level of performance that some of their competitors reached.


 Product Comparison Chart with Coupon Codes


Notes:

*Unnamed Load Testing Service

AVG Response Failures AVG Response Heavy
ASO 2031 No
GoDaddy 2120 No 5904
Pagely 2398 No
Pressable 1360 No 15570
SiteGround 22659 Yes 25712
WebSynthesis 1929 No 3740
WPEngine 1835 No

I didn't get to conduct a full test with this service because I may have caused the entire service to crash during testing. This table is showing 2 tests, on average response and whether failures occurred (any type of failures). The second test is what caused the service to crash and is incomplete. The first test was 500 users/second from 1 machine and the second was 8000 users/second from 40 machines. The response times were pretty slow all around, and SiteGround seemed to have some major issues with this test. I am unsure as to why, I re-ran the first test again later and it seemed to handle it without any failures (errors) on the second run. The testing system is in beta and it's really hard to know what happened. SiteGround seemed to handle Blitz's heavier test without issue and the second test here went fine. Hard to know if there was really an issue on SiteGround's end or the testing service. The heavy test was interesting, WebSynthesis ended up being the fastest which is a similar result to the Blitz.io test once they fixed the nginx config. Perhaps this load test wasn't triggering any of their security measures? I could not complete the testing because the system went down prematurely.

I am not sure if there are useful inferences to be drawn from these tests. I was asked not to name the service because of the issues encountered but I wanted to include the partial results here in case someone did find some value in looking at the numbers.

I actually tried a third load testing service that was also in beta and it never was able to fully run the tests either. I am starting to feel like load testing kryptonite.

Thank You

First off, I want to thank the companies that agreed to participate voluntarily. I had nothing but pleasant experiences dealing with the people at each company. A few even took it a step beyond and offered a lot of help and insight about how this test might be conducted. There was a surprising amount of consistency of views about what and how to measure performance offered. A few of the individuals who stood out the most:

David Koopman at GoDaddy for his insights on performance and testing.

Vid Luther at Pressable was incredibly helpful and knowledgeable about performance. He's even written a great article here about performance. He also helped get at least one other company on board for testing and for that, I am thankful as well.

Tina Kesova at Siteground has always been helpful and this test was no exception. She had SiteGround on board almost instantly when I just mentioned the seed of the idea back in November 2013.

A few friends of mine also helped in figuring out how to perform these tests and dealing with some of the technical challenges in benchmarking. Dave Lo, Eric Silverberg and Samuel Reed all offered their advice and helped me make the design of the tests as fair as possible.

A special thanks goes to people who read drafts of this article and provided feedback including Andrey Tarantsov, JR Harrel and my dad.

Anyone else I missed, I am sorry, and thank you too.
 

How To Configure MySql InnoDB to Save Tables In Unique Files

MySql is a great database and InnoDB is one of the engines you can use; the other popular choice is MyISAM (a good post explaining the differences). If you work with large amounts of data you can sometimes run into weird problems you didn't know about or expect.

InnoDB saves all the tables in your database into one file: ibdata1 (and an ib_log file). That's all well and good, except it doesn't delete information from them when you erase a table. So your ibfile1 will never decrease in size. This only becomes a problem with large amounts of data and the use of temporary tables. I don't know why this is the default behavior, but there is a very simple solution to get around this problem: use unique files for each table.

Instructions

Make sure you backup everything before doing this and I don't recommend doing this on a live system.

1. Open up your my.cnf (mysql configuration file)

nano /etc/mysql/my.cnf

If you don't know where it is try searching for it:

find / -name my.cnf

2. Add the following under [mysqld] portion of the config:

innodb_file_per_table

3. Remove old files: ibdata1 and ib_log

4. Restart mysql (a couple examples below)

service mysqld restart
/etc/init.d/mysqld restart

MySql will now save innodb tables into unique files and delete them when you delete the tables.

Reverse Proxy and Cache Server with Nginx

This is one of the ways I improve performance here at Review Signal. I run an nginx reverse proxy and cache system in front of the apache server. Apache can be slow and doesn't have a built in caching system for a lot of the static content we serve. So I put Nginx in front to cache and serve all the content it can directly from memory. This improves the performance of my servers and users get their content faster. It also can help when there is a high load. If you want to see how it performs, I've included a screenshot from Blitz.io at the bottom showing how well Review Signal performs with 500 concurrent users.

The Nginx config (http, server):

http {
  proxy_redirect off;
  proxy_set_header Host $host;
  proxy_set_header X-Real-IP $remote_addr;
  proxy_set_header X-Forwarded-For $proxy_add_x_forwarded_for;
 
  # caching options
  proxy_cache_path /var/cache/nginx levels=1:2 keys_zone=my-cache:8m 
max_size=1000m inactive=600m;
  proxy_temp_path /var/cache/tmp;
 
server {
  listen 80;
  server_name subdomain.example.com;
  access_log on;
  error_log on;
 
  location /{
    proxy_pass http://localhost:3000/subdomain;
  }
}
 
server {
  listen 80;
  server_name example.com;
  access_log on;
  error_log on;
 
  location / { 
    proxy_pass http://localhost:3000/; 
    proxy_cache my-cache;
    proxy_cache_valid 200 302 60m;
    proxy_cache_valid 404 1m;
  }
 }
}

Please note that only the relevant parts to this article are included (http and server). You definitely need to add more options to the config before http and in your http section. I didn't include those parts because they can vary a huge amount. See the Nginx documentation  for more details and example configurations.

Configuration Walkthrough:

  proxy_redirect off;
  proxy_set_header Host $host;
  proxy_set_header X-Real-IP $remote_addr;
  proxy_set_header X-Forwarded-For $proxy_add_x_forwarded_for;

proxy_redirect off tells the server we aren't redirecting content. We actually do that later with proxy_pass. The headers we set allow you to see proper header information on the server you are proxying to. Without X-Real-IP/X-Forwarded-For the server will simply see your reverse proxy server's IP address.
  proxy_cache_path /var/cache/nginx levels=1:2 keys_zone=my-cache:8m 
max_size=1000m inactive=600m;
  proxy_temp_path /var/cache/tmp;

The first line tells nginx where to save cache data (path), the structure of the cache data (levels), names your cache and it's size (keys_zone), max cache size (max_size) and how long before cached data is expired (inactive). The second line tells nginx where to save temporary data which it uses in building the cache.

server {
  listen 80;
  server_name subdomain.example.com;
  access_log on;
  error_log on;
 
  location /{
    proxy_pass http://localhost:3000/subdomain;
  }
}

This server code creates a reverse proxy to localhost:3000. It doesn't do any caching, it simply forwards all requests between Nginx and the localhost:3000. It is listening to subdomain.example.com and any request to it (/) are passed to localhost:3000/subdomain.

server {
  listen 80;
  server_name example.com;
  access_log on;
  error_log on;
 
  location / { 
    proxy_pass http://localhost:3000/; 
    proxy_cache my-cache;
    proxy_cache_valid 200 302 60m;
    proxy_cache_valid 404 1m;
  }
 }

This server is a reverse proxy and cache. We're responding to any request to example.com. It's forwarding all requests to localhost:3000. It also is creates a cache called my-cache (notice this matches the proxy_cache_path keys_zone setting). proxy_cache_valid defines what HTTP codes can be cached and for how long. So in this example 200 (OK) and 302 (FOUND) are cached for 60 minutes. 404 (NOT FOUND) is cached for 1 minute.

Conclusion

Setting up a reverse proxy isn't too difficult. However, it can be complicated to get it working with your application on occasion. You can empty the cache manually by deleting all the contents in the cache folder. That often helps fix issues. Nginx is fairly smart and when you pass post data, it doesn't serve cached pages, but get/head data will be cached by default. This setup works great when you serve a lot of static content. I run it in front of almost everything here at Review Signal including our blog. It's easy enough to configure different caching levels for different parts of your application. And if you're ever in doubt, test the application directly, then just reverse proxy without caching, and then turn on caching.

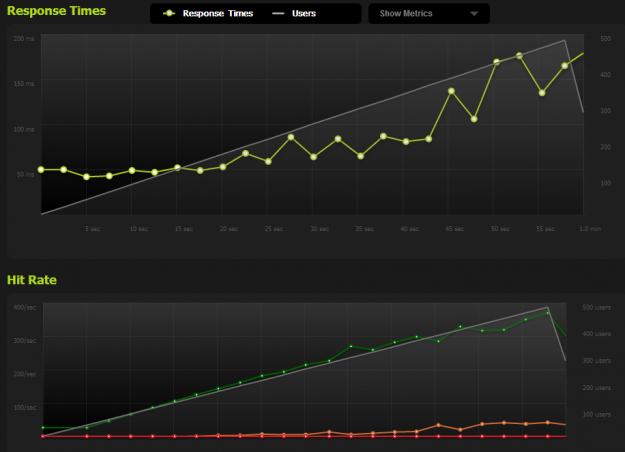
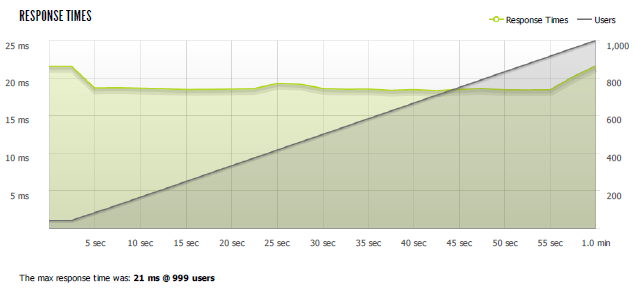
As promised, here is what Review Signal's performance looks like when rushing with Blitz.io from 1-500 concurrent users with this nginx setup. It responds to around 300 concurrent requests without going over 100ms response time.

nginxblitzio