
Sponsored by LoadStorm. The easy and cost effective load testing tool for web and mobile applications.
The full company list, product list, methodology, and notes can be found here
This post focuses only on the results of the testing in the $101-200/month price bracket for WordPress Hosting.
Other Price Tier Results
<$25/Month Tier$25-50/Month Tier$51-100/Month Tier$101-200/Month Tier$201-500/Month Tier$500+/Month (Enterprise) Tier
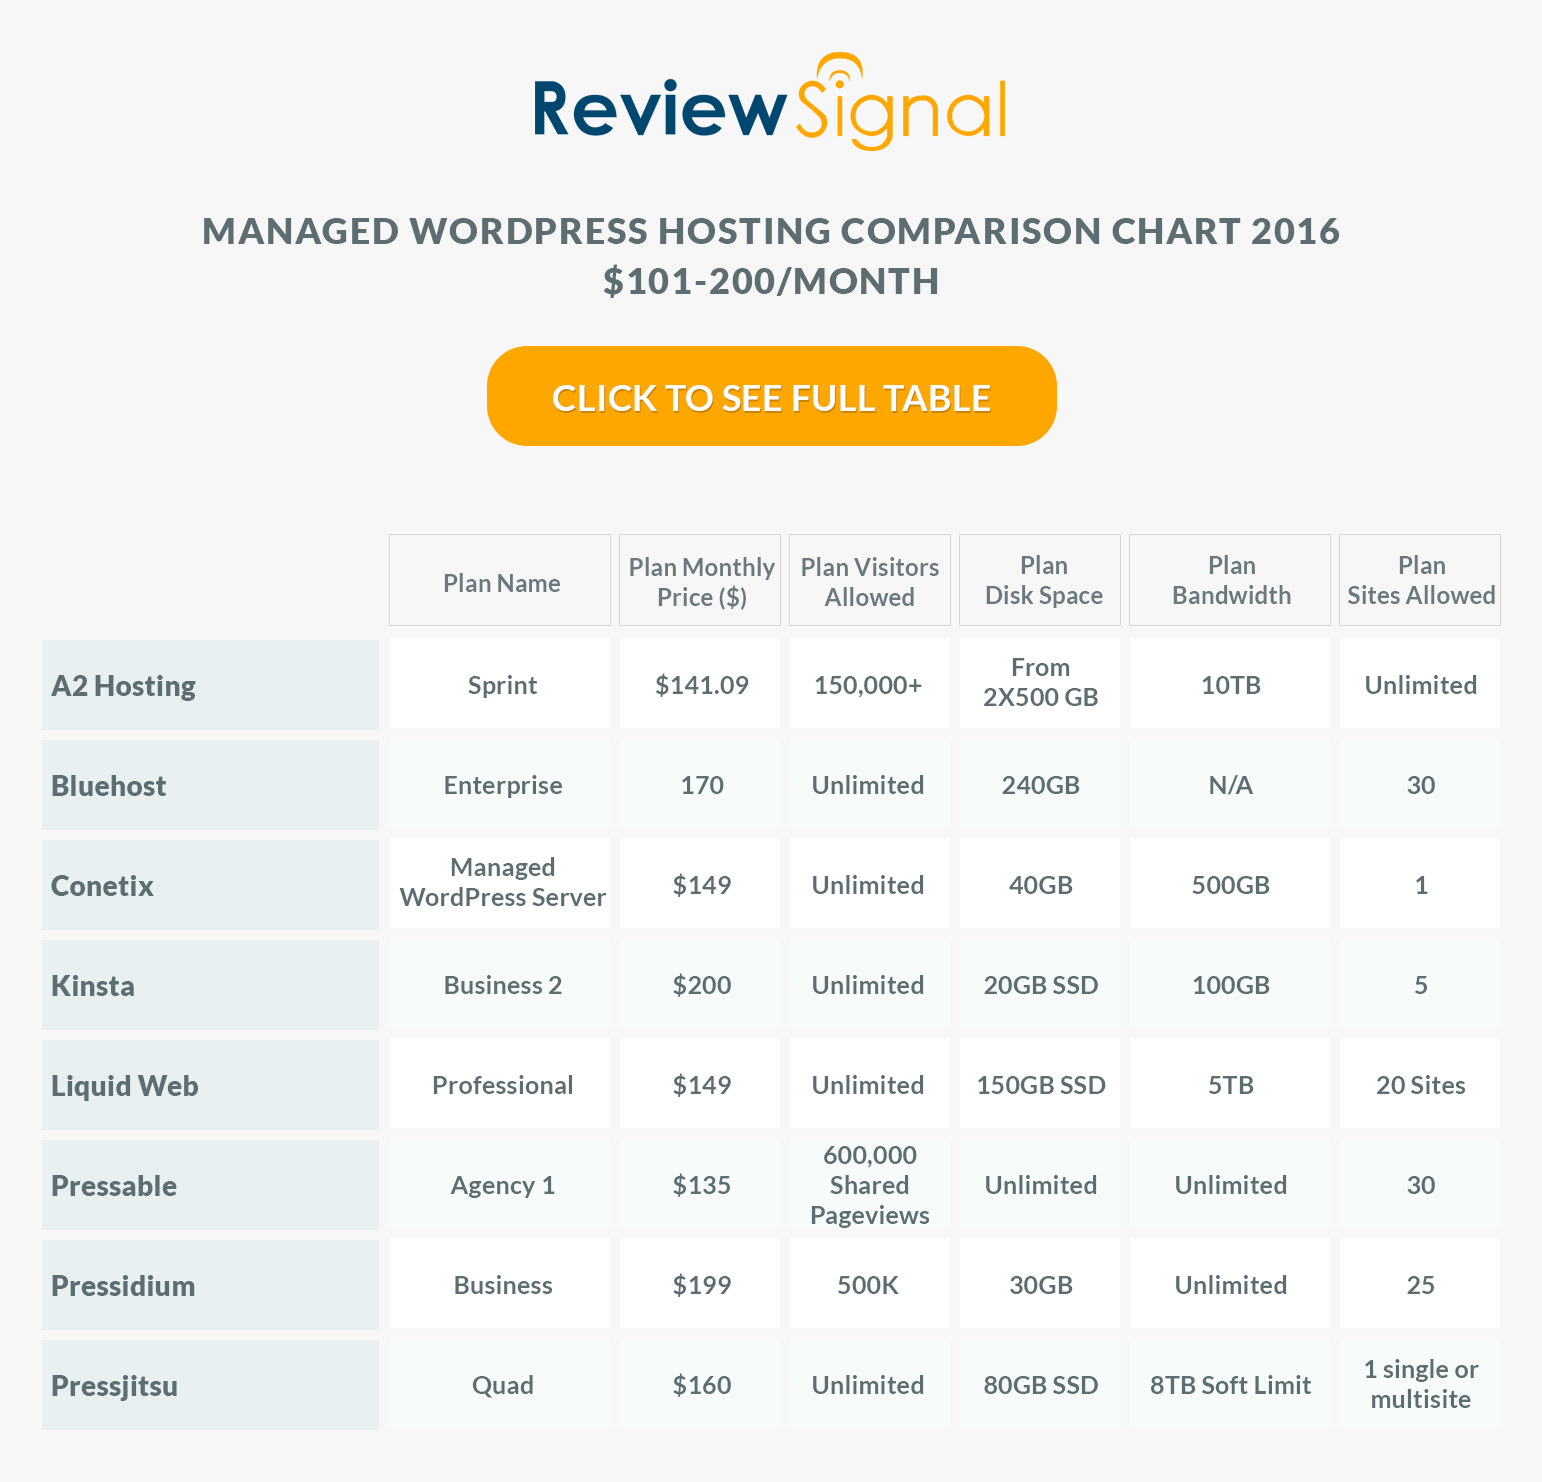
$101-200/Month WordPress Hosting Products
$101-200/Month WordPress Hosting Performance Benchmarks Results
1. Load Storm
Test 500-4000 Concurrent Users over 30 Minutes, 10 Minutes at Peak
| Company | Total Requests | Total Errors | Peak RPS | Average RPS | Peak Response Time(ms) | Average Response Time(ms) | Total Data Transferred (GB) | Peak Throughput (MB/s) | Average Throughput (MB/s) |
| A2 | 363070 | 163790 | 264.15 | 201.71 | 15443 | 6857 | 11.75 | 13.88 | 6.528 |
| BlueHost | 322139 | 166336 | 267.9 | 178.97 | 20999 | 9268 | 9.42 | 7.09 | 5.24 |
| Conetix | 341733 | 145110 | 243.3 | 189.85 | 16202 | 7347 | 11.74 | 13.87 | 6.52 |
| Kinsta | 546252 | 0 | 425.67 | 303.47 | 9078 | 286 | 31.47 | 24.95 | 17.48 |
| LiquidWeb | 635893 | 76 | 490.78 | 353.27 | 15097 | 360 | 31.3 | 25.19 | 17.39 |
| Pressable | 724499 | 1090 | 562.12 | 402.5 | 15024 | 447 | 30.91 | 26.07 | 17.17 |
| Pressidium | 563624 | 0 | 435.43 | 313.12 | 3561 | 272 | 30.82 | 24.44 | 17.12 |
| Pressjitsu | 434368 | 41339 | 339.37 | 241.32 | 15605 | 3173 | 22.5 | 18.67 | 12.5 |
Discussion of Load Storm Test Results
Kinsta, LiquidWeb [Reviews], Pressable, and Pressidium had no problems with this test.
A2 Hosting [Reviews], BlueHost [Reviews], Conetix, and Pressjitsu struggled with this test. BlueHost struggled off the bat. A2 and Conetix struggled a couple minutes in. Pressjitsu made it about 12 minutes in before it started erroring, but it had increasing load times starting around 6 minutes in. They all lasted varying amounts of time, but none were ready to handle this sort of load.
2. Blitz.io
Test 1-3000 Concurrent Users over 60 seconds
Blitz Test Quick Results Table
| Company | Hits | Errors | Timeouts | Average Hits/Second | Average Response Time | Fastest Response | Slowest Response |
| A2 | 120 | 43508 | 21784 | 2 | 518 | 304 | 733 |
| BlueHost | 28568 | 11753 | 7945 | 476 | 929 | 192 | 1889 |
| Conetix | 155 | 16827 | 13990 | 3 | 1470 | 872 | 2184 |
| Kinsta | 81397 | 3 | 0 | 1357 | 84 | 83 | 85 |
| LiquidWeb | 81393 | 47 | 10 | 1357 | 80 | 76 | 118 |
| Pressable | 77652 | 0 | 4 | 1294 | 134 | 141 | 133 |
| Pressidium | 85916 | 6 | 0 | 1432 | 27 | 25 | 31 |
| Pressjitsu | 67297 | 5833 | 0 | 1122 | 208 | 205 | 236 |
Discussion of Blitz Test 1 Results
This test is just testing whether the company is caching the front page and how well whatever caching system they have setup is performing (generally this hits something like Varnish or Nginx).
Who performed without any major issues?
Kinsta, LiquidWeb [Reviews], Pressable, and Pressidium all handled this test without issue, again.
Who had some minor issues?
Pressjitsu kept a flat response time but had a lot of errors start to build as the test scaled up. Might have been a security measure blocking it.
Who had some major issues?
BlueHost [Reviews] managed to last about 22 seconds before it started to be impacted by the load.
A2 Hosting and Conetix were overloaded almost immediately.
3. Uptime Monitoring
Both uptime monitoring solutions were third party providers that offer free services. UptimeRobot was paid for and monitoring on a 1 minute interval. All the companies were monitored over approximately two months (May-June 2016).
| Company | StatusCake | UptimeRobot |
| A2 | 99.64 | 100 |
| BlueHost | 100 | 99.99 |
| Conetix | 99.52 | 99.7 |
| Kinsta | 99.98 | 99.99 |
| LiquidWeb | 100 | 100 |
| Pressable | 99.96 | 99.94 |
| Pressidium | 99.97 | 99.99 |
| Pressjitsu | 99.99 | 99.99 |
Conetix had some uptime issues getting recorded for 99.52% and 99.7% on StatusCake and UptimeRobot respectively.
A2 had a very strange recording with UptimeRobot showing 100% and StatusCake recording 99.64%.
Everyone else maintained above 99.9% on both monitors.
4. WebPageTest.org
Every test was run with the settings: Chrome Browser, 9 Runs, native connection (no traffic shaping), first view only.
| Company | WPT Dulles | WPT Denver | WPT LA | WPT London | WPT Frankfurt | WPT South Africa |
| A2 | 0.924 | 0.654 | 1.199 | 1.554 | 1.989 | 5.118 |
| BlueHost | 0.969 | 0.588 | 0.988 | 1.684 | 2.006 | 6.23 |
| Conetix | 2.703 | 2.026 | 2.194 | 3.372 | 3.339 | 6.964 |
| Kinsta | 0.817 | 0.577 | 0.982 | 1.15 | 1.721 | 5.081 |
| LiquidWeb | 0.887 | 0.578 | 1.059 | 1.179 | 1.748 | 4.227 |
| Pressable | 0.969 | 0.738 | 1.135 | 1.493 | 1.95 | 7.669 |
| Pressidium | 0.639 | 0.627 | 1.174 | 1.187 | 1.705 | 5.303 |
| Pressjitsu | 0.915 | 0.677 | 0.87 | 1.302 | 1.786 | 6.433 |
| Company | WPT Singapore | WPT Shanghai | WPT Japan | WPT Sydney | WPT Brazil |
| A2 | 2.618 | 22.224 | 2.114 | 2.592 | 2.162 |
| BlueHost | 2.247 | 22.406 | 1.937 | 1.755 | 2.22 |
| Conetix | 3.092 | 22.465 | 2.818 | 1.493 | 3.448 |
| Kinsta | 2.054 | 22.743 | 2.064 | 1.704 | 2.345 |
| LiquidWeb | 2.215 | 22.378 | 1.983 | 1.977 | 1.823 |
| Pressable | 2.476 | 22.395 | 2.146 | 2.879 | 2.479 |
| Pressidium | 2.08 | 22.461 | 2.053 | 1.893 | 1.803 |
| Pressjitsu | 2.172 | 22.317 | 1.701 | 1.871 | 2.19 |
Everyone was pretty fast around the world without huge red flags anywhere.
Conetix had slow scores to a lot of locations, but thankfully they were the fastest in Sydney (because they are focused on the Australian market and based there).
5. WPPerformanceTester
| Company | PHP Bench [Seconds] (lower=faster) | WP Bench [Queries Per Second](higher=faster) |
| A2 | 9.336 | 1440.92 |
| BlueHost | 12.276 | 956.94 |
| Conetix | 12.019 | 418.76 |
| Kinsta | 11.458 | 330.58 |
| LiquidWeb | 7.122 | 1102.54 |
| Pressable | 10.788 | 514.13 |
| Pressidium | 10.739 | 281.14 |
| Pressjitsu | 12.3 | 574.38 |
At this mid-range tier we see pretty much only VPS/Dedicated and cloud/clustered solutions. LiquidWeb's VPS again got one of the fastest PHP Bench scores I've seen recorded. The VPS/Dedicateds also generally put up much faster WP Bench scores with A2 leading the way with their dedicated server. The Cloud/Clustered solutions were around 500 and below (Kinsta, Pressable, Pressidium). The only exception was Conetix which was a VPS.
Conclusion
Top Tier WordPress Hosting Performance
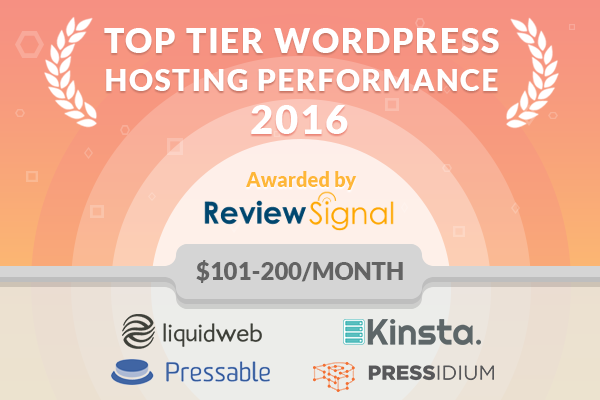
Kinsta, LiquidWeb [Reviews], Pressable, and Pressidium were the top tier in the $101-200/month price range.
Individual Host Analysis
The bright spot in this test was the WP Bench test where this dedicated server was way faster than the competition. The raw power of a dedicated machine is nice, but unless it's got all the extra caching software that the top tier hosts were running, it unfortunately fell flat in the load tests.
Another disappointing performance in the load tests. The uptime and other tests were fine.
Overall, they didn't perform that well. Uptime wasn't on par and the load test results were disappointing. The only bright spot was they were the fastest in Australia.
(9/19/2019 Update) Conetix have issued their own statement regarding Review Signal's test and why they believe this methodology doesn't accurately represent their performance and why a unique Australian perspective is required when evaluating them. I recommend reading the full details.
Kinsta continues to earn top tier status. I can't find anything to say beyond the fact they performed near perfectly, again.
LiquidWeb's lower priced plan performed spectacularly, their higher end product only continued that trend. They had a bracket leading PHP bench, perfect uptime, and aced the load tests. LiquidWeb has easily gone from brand new to top tier WordPress hosting status this year.
Pressable continues its trend of excellent load tests, but at this tier they put everything together and earned themselves top tier status.
Another test, another top tier performance. Not much to say beyond, excellent.
Pressjitsu did better than the other companies that didn't earn top tier status, but found themselves clearly below the top tier with some struggles in the load tests. It seems like security may have messed up the blitz test but the same can't be said about the LoadStorm which showed real signs of stress. It seems like a good foundation but they need to just get everything running a bit better to earn themselves the top tier recognition; hopefully next year.
Other Price Tier Results
<$25/Month Tier$25-50/Month Tier$51-100/Month Tier$101-200/Month Tier$201-500/Month Tier$500+/Month (Enterprise) Tier
Kevin Ohashi
Latest posts by Kevin Ohashi (see all)
- Analyzing Digital Ocean’s First Major Move with Cloudways - February 28, 2023
- Removing old companies - June 28, 2021
- WordPress & WooCommerce Hosting Performance Benchmarks 2021 - May 27, 2021
 WordPress & WooCommerce Hosting Performance Benchmarks 2021
 WooCommerce Hosting Performance Benchmarks 2020
 WordPress Hosting Performance Benchmarks (2020)
 The Case for Regulatory Capture at ICANN
 WordPress Hosting – Does Price Give Better Performance?
 Hostinger Review – 0 Stars for Lack of Ethics
 The Sinking of Site5 – Tracking EIG Brands Post Acquisition
 Dirty, Slimy, Shady Secrets of the Web Hosting Review (Under)World – Episode 1
 Free Web Hosting Offers for Startups
Pingback: $500+/Month Enterprise WordPress Hosting Performance Benchmarks (2016) | Review Signal Blog
Pingback: WordPress Hosting Performance Benchmarks (2016) | Review Signal Blog
Pingback: $51-100/Month WordPress Hosting Performance Benchmarks (2016) | Review Signal Blog
Pingback: Under $25/Month WordPress Hosting Performance Benchmarks (2016) | Review Signal Blog
Pingback: $25-50/Month WordPress Hosting Performance Benchmarks (2016) | Review Signal Blog
Pingback: $201-500/Month WordPress Hosting Performance Benchmarks (2016) | Review Signal Blog
Overall, I feel each of these price points were excellently tested. One thing I would like to point out, however, is that A2 uses LightSpeed for their web servers and caching is handled a bit different (in my experience, superior but a slight learning curve). That’s also going to depend on your LightSpeed license chosen as well.
Previously working for a major web host, and using most of those listed here, I’ve seen every configuration in the book, but A2 really rocks my world.
(Note: I have not affiliation with A2 other than as a customer. I just happened to give them a shot have been quite happy. I have also never used any of their products other than the dedicated server I have with them.)
Thanks Jeff. As states on the main page, I test everything out of the box except the Enterprise (500+) tier. For that sort of money I expect all of them to go out of their way and onboard/white glove service an account with tweaks and tuning. I’m sure almost all, if not all, these companies could do better in the lower testing if they put in some effort tweaking settings. Two of the problems introduced by that though are 1. Every company now has unlimited configurations they want to test which is practically impossible and 2) the service level I get is almost surely higher than normal customers because they know what I’m doing with the data and how it might reflect on their company.
I’m glad you’re happy with A2 and your input is valuable. My tests are pretty much a pure performance benchmark and don’t encapsulate some of the other aspects of hosting which are equally as important.
We’re using WP ourselves and we LOVE it.. 🙂 Thanks for this awesome performance test comparison…
Although we’re not using any of the platforms above in the “Cloud $100-200” category, but we are seriously considering to switch our hosting provider very soon.. So far we have finalised three providers “Kinsta, Pressidium & Flywheel”.
Also is there’s any reason why Flywheel is not on your list above? I have checked their website and it seems like they are using “Google Cloud” similar to Kinsta. So far so good, but its good to see some head to head competition in the “Managed WP Hosting” category..
Cheers
Sorry for the delayed response. FlyWheel didn’t request to be tested in this price bracket. All my testing is opt-in and granular to each price bracket. They only participated at the lowest plan level. I tested a more expensive plan in 2015 if you’re curious, you can look back to see how they did. I think it was $75/month plan IIRC.