Sponsored by LoadStorm. The easy and cost effective load testing tool for web and mobile applications.
The full company list, product list, methodology, and notes can be found here
This post focuses only on the results of the testing in the $201-500/month price bracket for WordPress Hosting.
Other Price Tier Results
<$25/Month Tier$25-50/Month Tier$51-100/Month Tier$101-200/Month Tier$201-500/Month Tier$500+/Month (Enterprise) Tier
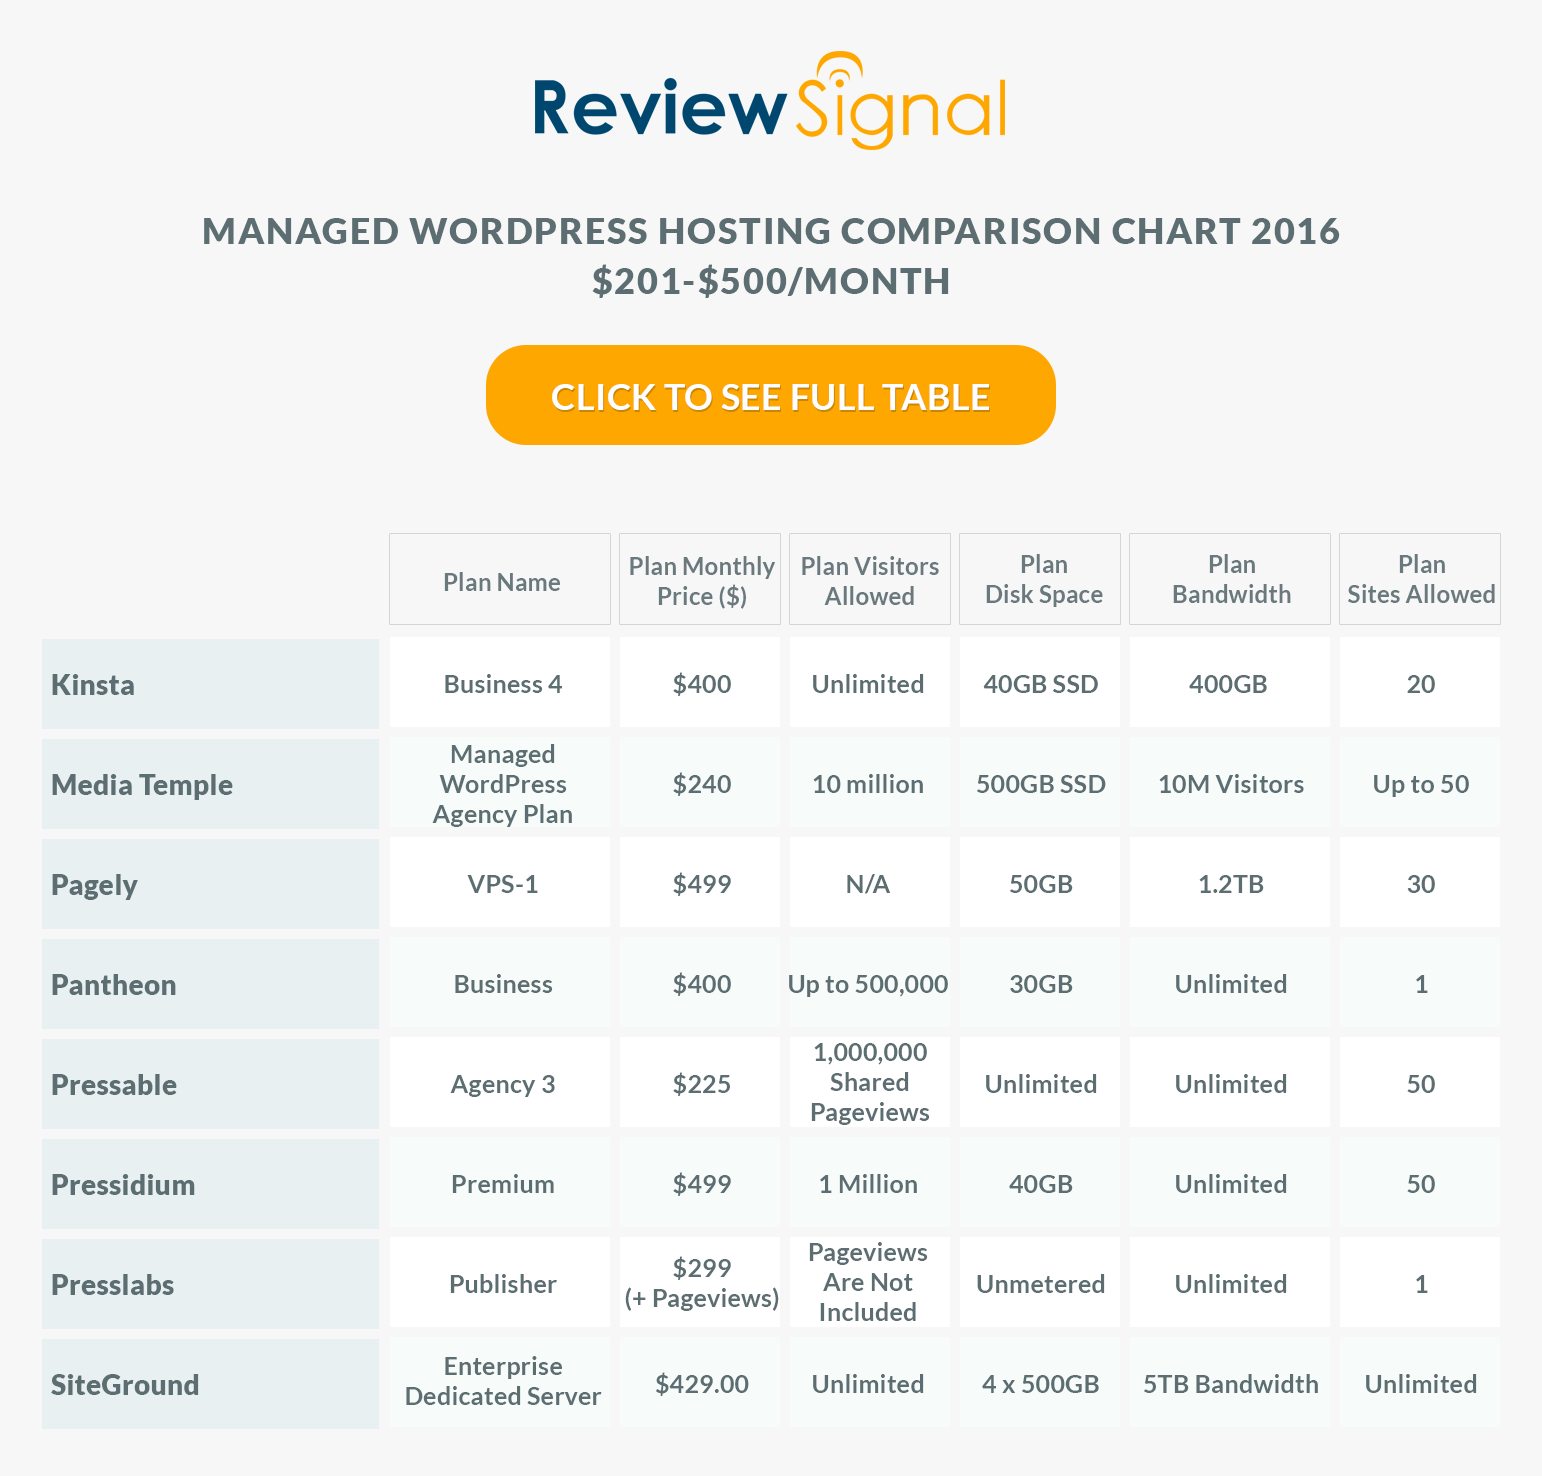
$201-500/Month WordPress Hosting Products
$201-500/Month WordPress Hosting Performance Benchmarks Results
1. Load Storm
Test 500-5000 Concurrent Users over 30 Minutes, 10 Minutes at Peak
| Company | Total Requests | Total Errors | Peak RPS | Average RPS | Peak Response Time(ms) | Average Response Time(ms) | Total Data Transferred (GB) | Peak Throughput (MB/s) | Average Throughput (MB/s) |
| Kinsta | 671665 | 47 | 528.38 | 373.15 | 9991 | 285 | 38.68 | 31.73 | 21.49 |
| MediaTemple | 775277 | 34144 | 616.05 | 430.71 | 15334 | 761 | 39.71 | 33.5 | 22.06 |
| Pagely | 553754 | 133181 | 456.03 | 307.64 | 16132 | 3333 | 19.32 | 13.94 | 10.73 |
| Pantheon | 629578 | 49212 | 510.78 | 349.77 | 15091 | 1353 | 33.88 | 28.9 | 18.82 |
| Pressable | 896616 | 12256 | 740.88 | 498.12 | 6362 | 450 | 37.87 | 33.8 | 21.04 |
| Pressidium | 697020 | 0 | 547.88 | 387.23 | 4894 | 266 | 38.16 | 31.05 | 21.2 |
| PressLabs | 692581 | 21180 | 547.72 | 384.77 | 15493 | 2109 | 23.02 | 18.45 | 12.79 |
| SiteGround | 640337 | 48537 | 507.98 | 355.74 | 15564 | 1549 | 30.64 | 24.25 | 17.02 |
Discussion of Load Storm Test Results
Kinsta and Pressidium were clearly the two best performers in this test.
Pressable had some minor issues that looked like they may have been security related to wp-login.
MediaTemple [Reviews] had a spike of errors at the very end and some minor errors throughout the test that might have been security related since they didn't impact response times at all.
PressLabs had some spikes and wp-login related problems but the server started to slow down its response times as the test progressed.
Pantheon [Reviews] had similar issues to PressLabs with slowing down and the largest chunk being wp-login related.
SiteGround [Reviews] started to have trouble around 12 minutes in and saw spikes, also mostly related to wp-login/admin. They also had increased and unstable response times associated with the spikes.
Pagely [Reviews] struggled the most with this test with spikes and increased response times. wp-login again was the worst offender.
What is amazing is none of these companies completely failed with 5000 real users logging in and bursting caches.
2. Blitz.io
Test 1-3000 Concurrent Users over 60 seconds
Blitz Test Quick Results Table
| Company | Hits | Errors | Timeouts | Average Hits/Second | Average Response Time | Fastest Response | Slowest Response |
| Kinsta | 81386 | 3 | 0 | 1356 | 84 | 84 | 86 |
| MediaTemple | 44310 | 33581 | 450 | 739 | 249 | 189 | 676 |
| Pagely | 79095 | 1554 | 1153 | 1318 | 23 | 2 | 195 |
| Pantheon | 83211 | 2 | 0 | 1387 | 61 | 61 | 68 |
| Pressable | 77850 | 11 | 1 | 1298 | 132 | 131 | 135 |
| Pressidium | 85439 | 11 | 14 | 1424 | 31 | 25 | 82 |
| PressLabs | 87432 | 0 | 0 | 1457 | 8 | 3 | 13 |
| SiteGround | 82396 | 1 | 0 | 1373 | 71 | 71 | 72 |
Discussion of Blitz Test 1 Results
This test is just testing whether the company is caching the front page and how well whatever caching system they have setup is performing (generally this hits something like Varnish or Nginx).
Who performed without any major issues?
Kinsta, Pantheon, Pressable, Pressidium, PressLabs, and SiteGround [Reviews] all had close to no errors (and exactly none in PressLabs's case).
Who had some minor issues?
Pagely [Reviews] had a couple spikes which increased response times and errors.
Who had some major issues?
MediaTemple [Reviews] had an early spike and a big spike later. The big spike later looks like it may have partially been a security measure. But it did eventually increase response times as well.
3. Uptime Monitoring
Both uptime monitoring solutions were third party providers that offer free services. UptimeRobot was paid for and monitoring on a 1 minute interval. All the companies were monitored over approximately two months (May-June 2016).
| Company | StatusCake | UptimeRobot |
| Kinsta | 99.98 | 100 |
| MediaTemple | 99.96 | 99.97 |
| Pagely | 99.95 | 99.95 |
| Pantheon | 99.98 | 99.98 |
| Pressable | 99.88 | 99.9 |
| Pressidium | 99.95 | 99.99 |
| PressLabs | 99.99 | 99.98 |
| SiteGround | 100 | 99.99 |
I hate having to penalize a company for uptime, but Pressable recorded 99.88 and 99.90 uptime scores which is below the 99.9% I expect from every company.
Every other company did well.
4. WebPageTest.org
Every test was run with the settings: Chrome Browser, 9 Runs, native connection (no traffic shaping), first view only.
| Company | WPT Dulles | WPT Denver | WPT LA | WPT London | WPT Frankfurt | WPT South Africa |
| Kinsta | 0.77 | 0.545 | 0.947 | 1.151 | 1.707 | 4.466 |
| MediaTemple | 1.064 | 0.608 | 0.901 | 1.341 | 1.925 | 6.576 |
| Pagely | 0.658 | 0.651 | 0.947 | 1.144 | 1.691 | 3.868 |
| Pantheon | 0.762 | 0.623 | 1.054 | 1.104 | 1.672 | 4.493 |
| Pressable | 0.973 | 0.781 | 1.084 | 1.514 | 1.967 | 7.708 |
| Pressidium | 0.687 | 0.641 | 1.181 | 1.17 | 1.68 | 4.516 |
| PressLabs | 0.762 | 0.754 | 1.082 | 1.148 | 1.624 | 5.357 |
| SiteGround | 0.801 | 0.725 | 1.25 | 1.214 | 1.757 | 4.514 |
| Company | WPT Singapore | WPT Shanghai | WPT Japan | WPT Sydney | WPT Brazil |
| Kinsta | 2.165 | 22.777 | 2.114 | 1.785 | 1.848 |
| MediaTemple | 2.164 | 22.061 | 1.811 | 2.071 | 2.118 |
| Pagely | 2.215 | 22.811 | 1.798 | 2.193 | 1.794 |
| Pantheon | 2.166 | 22.427 | 1.797 | 1.769 | 1.872 |
| Pressable | 2.426 | 22.233 | 2.124 | 2.945 | 2.135 |
| Pressidium | 2.105 | 22.355 | 2.038 | 1.672 | 1.745 |
| PressLabs | 1.643 | 22.048 | 1.581 | 2.358 | 2.092 |
| SiteGround | 2.496 | 22.431 | 2.051 | 3.27 | 2.034 |
Fast. Not much to really say about these results. Nobody had issues, nothing was particularly interesting here other than nobody can get into China at any price level.
5. WPPerformanceTester
| Company | PHP Bench [Seconds] (lower=faster) | WP Bench [Queries Per Second](higher=faster) |
| Kinsta | 11.297 | 321.34 |
| MediaTemple | 12.331 | 107.49 |
| Pagely | 9.841 | 194.36 |
| Pantheon | 13.836 | 184.81 |
| Pressable | 11.016 | 384.32 |
| Pressidium | 11.902 | 304.79 |
| PressLabs | 8.055 | 841.04 |
| SiteGround | 17.082 | 738 |
Not sure why SiteGround's PHP bench was so slow. The average WP Bench scores are also lower than every previous tier with PressLabs leading the way at 841. These more expensive solutions are generally trending towards cloud/clustered solutions which have slower database throughput in exchange for scale.
Conclusion
The high end WordPress hosting market is growing and has a lot of good options. No company in this tier completely faltered during the load tests despite a huge strain being put on them of 3000 concurrent hits to the frontpage and 5000 logged in users browsing the site.
Top Tier WordPress Hosting Performance
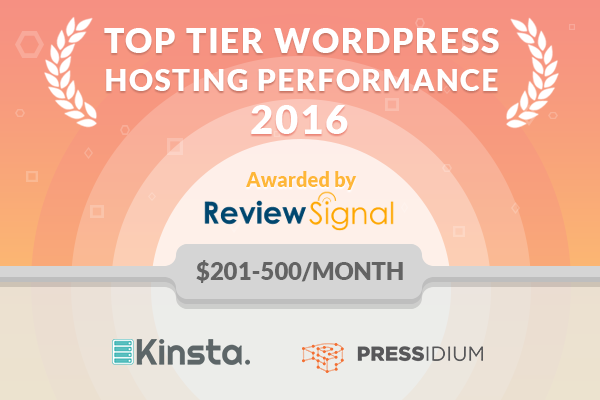
Kinsta and Pressidium clearly led the pack in terms of performance. They were the only two companies that handled LoadStorm without issue. They also didn't have any other issues across the other tests.
Honorable Mentions
PressLabs earned itself an honorable mention. It had some issues with the LoadStorm test but it managed to stay up and did well on all the other tests.
Individual Host Analysis
Overall, a splendid performance that earned them top tier WordPress hosting in the $201-500/month range. No faults in their performance at any point.
It's nice to see Media Temple playing with the big boys and doing a respectable job. They had a little bit of trouble with the LoadStorm test and some possibly security related issues during the Blitz test which kept them out. But they weren't out of place in this bracket and were by far the cheapest at $240/month.
Pagely had some minor problems with the Blitz test but the LoadStorm test really seemed to be the big problem. The 5000 users seemed to clearly tax the server too much. Pagely reviewed the results and issued a full explanation. Their tl;dr was "Wrong plan/instance size for this test.
We price the value of our human Support and DevOps resources into the plan cost, which puts the ideal Pagely plan for this test outside the $500 cap. If the customer does not utilize the full range of services we provide they are essentially overpaying for AWS instances that in this case were undersized and not tuned for the test. "
Pantheon did well everywhere but LoadStorm which was a common theme for this bracket. They didn't fail, but they certainly were being taxed with increased load times and error rates.
Pressable could have earned an honorable mention if it wasn't for some uptime issues. They found themselves just below my 99.% expectation. They handled Blitz without issue and LoadStorm looked pretty good except wp-login had some what I imagine was security related issues.
I'm running out of positive adjectives to say how well Pressidium has done this year. A perfect LoadStorm test with zero errors, the lowest peak response time and lowest average response time. Followed up by a near perfect Blitz test. Top tier for sure.
PressLabs was the only company to earn an honorable mention. They had a bit of issues in the LoadStorm related to wp-login of course, but other than that put on an excellent performance.
In an odd twist of fate, I accidentally ran the same Blitz test on their lower priced cloud platform and it did better than the dedicated server. The shared infrastructure can often have far more powerful hardware backing it than dedicated machines and that's one of the interesting results. For large bursts, it may work better. Overall, this plan did pretty well, but LoadStorm clearly overloaded the server a bit too much to earn any special recognition.
Other Price Tier Results
<$25/Month Tier$25-50/Month Tier$51-100/Month Tier$101-200/Month Tier$201-500/Month Tier$500+/Month (Enterprise) Tier
Kevin Ohashi
Latest posts by Kevin Ohashi (see all)
- Analyzing Digital Ocean’s First Major Move with Cloudways - February 28, 2023
- Removing old companies - June 28, 2021
- WordPress & WooCommerce Hosting Performance Benchmarks 2021 - May 27, 2021

 WordPress & WooCommerce Hosting Performance Benchmarks 2021
 WooCommerce Hosting Performance Benchmarks 2020
 WordPress Hosting Performance Benchmarks (2020)
 The Case for Regulatory Capture at ICANN
 WordPress Hosting – Does Price Give Better Performance?
 Hostinger Review – 0 Stars for Lack of Ethics
 The Sinking of Site5 – Tracking EIG Brands Post Acquisition
 Dirty, Slimy, Shady Secrets of the Web Hosting Review (Under)World – Episode 1
 Free Web Hosting Offers for Startups
Pingback: $101-200/Month WordPress Hosting Performance Benchmarks (2016) | Review Signal Blog
Pingback: <$25/Month WordPress Hosting Performance Benchmarks (2016) | Review Signal Blog
Pingback: $25-50/Month WordPress Hosting Performance Benchmarks (2016) | Review Signal Blog
Pingback: $51-100/Month WordPress Hosting Performance Benchmarks (2016) | Review Signal Blog
Pingback: Kinsta Scores Top Tier For WordPress Hosting Performance | Web Design Tutorial
Pingback: $500+/Month Enterprise WordPress Hosting Performance Benchmarks (2016) | Review Signal Blog
Pingback: WordPress Hosting Performance Benchmarks (2016) | Review Signal Blog