UPDATE: Round 2 of Testing (November 2014) is now available.
WordPress as a platform has become the most popular CMS around, claiming to power almost 19% of the web. As a result, Managed WordPress hosting has become a very popular niche. Many companies in the managed WordPress space are charging a very high premium over the traditional shared web hosting providers. So beyond the marketing speak, what are you really getting? Most promise to make your life easier with features like automatic updates, backups, and security. They also claim to have great performance. It's hard to test objectively the ease-of-use features. But we can measure performance. There weren't many performance benchmarks that I could find, and the ones I could were not very thorough. So I began by designing my own set of testing.
Companies Tested
A Small Orange* [Reviews]
Digital Ocean [Reviews]
GoDaddy* [Reviews]
Pagely
Pressable*
SiteGround*† [Reviews]
WebSynthesis* [Reviews]
WPEngine [Reviews]
*Company donated an account to test on. I checked to make sure I was on what appeared to be a normal server. GoDaddy had over 3000 domains on the same IP. SiteGround had 887 domains. A Small Orange was a VPS, so it should be isolated. Pressable and WebSynthesis didn't have any accounts on the same IP. I am not sure how isolated they are in their environments.
†Tests were performed with SiteGround's proprietary SuperCacher module turned on fully unless otherwise specified.
The Products
I created a comparison chart of all the companies and the product used in this test. It was mostly the basic/cheapest offer with the exception of SiteGround, because their cheapest hosting plan didn't have full WordPress caching built in, but it was still very much within the price range of other offers.
(Click to see full table)

Methodology
The question I tried to answer is how well do these WordPress hosting services perform? I tested each company on two distinct measures of performance: peak performance and consistency.
1. Blitz.io
Load testing from the most well known load testing service. First test was 60 seconds, from 8 locations each scaling from 1-125 concurrent users (total 1000 users). For this test each one was tested with identical theme (twenty fourteen) and the out of the box configuration. The second test was 60 seconds, from 2 locations (Virginia/California) scaling from 1-1000 (total 2000 users). The configuration of each site was identical with Customizr theme and plugins.
2. Uptime (UptimeRobot and Uptime - a node.js/mongo project)
Consistency matters. I wanted to see how well these companies performed over a longer period of time. I used two separate uptime monitoring services: one existing third party service and one open source project.
3. WebPageTest.org
"WebPagetest is an open source project that is primarily being developed and supported by Google as part of our efforts to make the web faster." WebPageTest grades performance and allows you to run tests from multiple locations simulating real users. I tested from Dulles, VA, Miami, FL, Denver, CO, and Los Angeles, CA.
4. Unnamed Load Testing Service*
This service asked to remain nameless in this article. They do natural load testing and are in beta. I tested each WordPress host with the same theme (twenty fourteen) and the out of the box configuration for this test. I ran into some issues with this service which I will discuss later.
Background Information
Before I go over the results I wanted to explain and discuss a few things. Every provider I tested had the latest version of WordPress installed. Every plugin that came with it was also up to date with the exception of GoDaddy which had an older version of JetPack included (17 days out of date when I first setup).
I had some trouble getting set up on A Small Orange, the signup email was stuck in gmail's spam filter. I also found a potentially minor security issue in their customer system which they promptly responded to and fixed. I also had to specifically ask for the customized WordPress LEMP stack to be installed on my VPS.
GoDaddy stores SFTP and other critical details on a separate area away from your main GoDaddy account and WordPress admin (gateway.godaddy.com for anyone stuck looking).
I ran into issues with Pressable's CNAME redirect. It seemed to cache a coming soon page and didn't resolve itself by clearing any cache I could find. It resolved itself over a day or so, but being stuck with a coming soon page wasn't a pleasant first experience.
SiteGround includes CloudFlare but I never got it working, it failed to configure on www. So I couldn't conduct the test with it enabled.
Pagely charges you extra for SFTP access (which I didn't pay for and made my own life a living hell while trying to do this test).
WebSynthesis came pre-installed with two themes that were out of date.
Results
Test 1. 1-125 Concurrent Users from 8 Locations over 60 seconds (Gallery)

Discussion of Blitz Test 1 Results
The first thing I must note here is that two companies got absolutely destroyed by this test: Digital Ocean and A Small Orange.
My Digital Ocean VPS just died repeatedly. MySql died and needed to be manually restarted. I thought it was a bad instance, so I spun up another and got the same result. I even tried installing a caching plugin to see if I could get any performance out of their WordPress stack. I had absolutely no luck. Given this result, I eliminated Digital Ocean from the rest of my testing. You can run high performance WordPress sites on Digital Ocean (Review Signal's blog is running on one currently), but it requires knowing what you're doing and isn't recommended for people looking for managed WordPress hosting. Digital Ocean is a self-managed VPS provider; it's not for beginners or those who need managed support of their WordPress site. I included Digital Ocean to see how their offer would fare against specialized companies. The short answer is, it doesn't compare, at all.
Another out-of-the-box install with A Small Orange got crushed by this test too. After dconsulting with A Small Orange support, it became apparent I wasn't on their customized WordPress setup. I asked for it to be installed and all further tests were on this much more performant setup. You will see two sets of results for ASO, the normal and the LEMP stack, which is their high performance setup. One thing to note is that ASO offers less management on their customized WordPress setup because it no longer uses cPanel.
The lesson here is that WordPress, out-of-the-box with a LAMP stack, performs pretty badly. For a personal blog with low traffic, it probably won't matter, but for a site with any substantial amount of traffic, it will most likely crumble.
Who performed without any major issues?
A Small Orange (from now on, anytime I talk about ASO, it's about the specialized WordPress setup), Pagely, and SiteGround. Each of these companies had stable response times and few to no errors.
Who had some issues?
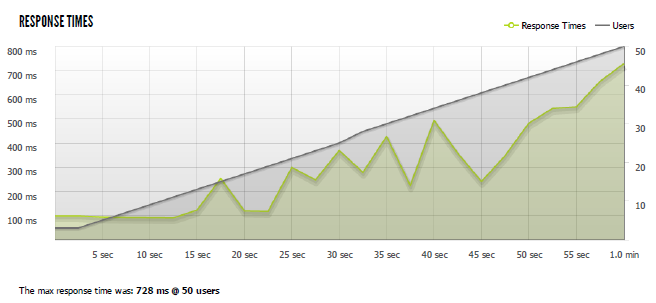
GoDaddy had an issue with errors in the middle of the test around 400 users but seemed to gracefully scale upwards without any difficulty and maintained steady load times and stopped erroring. Pressable's response times were a bit varied. Pressable didn't seem to have much trouble with the traffic because it had zero errors and minimal timeouts. WPEngine seemed to have a weird connection timeout issue around 600 users that resolved itself fairly quickly. WebSynthesis seemed to cap out at around 400 users/second with a few bursts. The response time remained steady and it was erroring (connection reset) instead of timing out. WebSynthesis support told me "We analyzed the logs on the server and some of your requests are not being cached as your tests are throwing over 14K symbols in a single URL. This is not realistic for normal use cases of WordPress." Nevertheless, they made a tweak to the nginx (webserver) config, and I tested it again in test 2.
Test 1. Quick Results Table
|
Success |
Errors |
Timeouts |
Avg Hits/second |
Avg Response (ms) |
| ASO |
23788 |
18 |
2 |
396 |
241 |
| GoDaddy |
23962 |
165 |
0 |
399 |
227 |
| Pagely |
20132 |
1 |
0 |
336 |
459 |
| Pressable |
21033 |
0 |
19 |
351 |
412 |
| SiteGround |
19672 |
0 |
0 |
328 |
495 |
| WebSynthesis |
19995 |
4224 |
5 |
333 |
246 |
| WPEngine |
20512 |
192 |
196 |
342 |
395 |
GoDaddy, despite their small hiccups, managed to have the best average response time to 8 servers distributed across 5 continents (Virginia, Oregon, California, Singapore, Japan, Brazil, Australia, Ireland). Furthermore, they also managed to serve the most hits.
SiteGround had the slowest average response and lowest hits/second but also didn't have a single error or timeout and the response was consistent throughout the test.
A Small Orange's performance was stunningly consistent. The fastest response was 238ms and the slowest was 244ms, a difference of 6ms over nearly 24,000 requests. They were just barely behind GoDaddy in hits and average response.
Overall, other than WebSynthesis, no host seemed to have serious difficulty with this test.
Test 2. 1-1000 Concurrent Users from 2 Locations over 60 seconds (Gallery)

Discussion of Blitz Test 2 Results
This test was designed to see just how much traffic these web hosts can handle. Blitz increased their pricing for multiple server locations while I was running this test. I had to reduce server locations from 8 down to 2 locations with higher user counts instead. The response times may be less meaningful, but I picked Virginia and California so that the test locations were on opposite sides of the US. I believe every server tested was in the US, so hopefully that was somewhat balanced, but the average response time may mean less than the stability of the response time.
Who performed without any major issues?
Pagely.
Who had some issues?
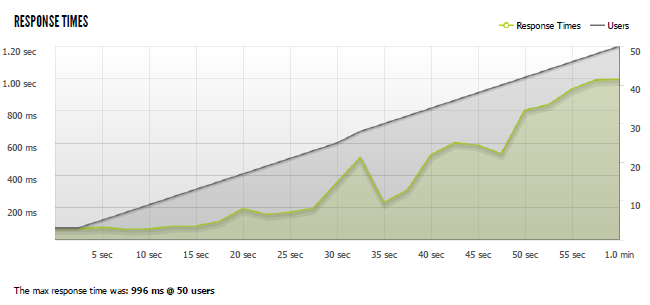
A Small Orange's setup definitely couldn't scale all the way up. Response times started increasing with increased users as did errors/timeouts. GoDaddy had some bizarre spikes that look similar to the one I saw in test 1, except three of them this time. Despite this, they pushed the most successful hits again and had the best ping of hosts that didn't completely error out. Pressable had some spikey performance similar to GoDaddy. Pressable pushed a lot of successful requests and did recover from the spikes. SiteGround hit a major spike but then seemed to kick into high gear and performed even better and finished out the test exceptionally strong and stable. WebSynthesis seemed to cap out at around 400 users/second with a few bursts again. The response time remained fairly steady and it was erroring (connection reset) instead of timing out again. WPEngine's response times got worse as the load increased and timeouts started to increase as well.
I included a screenshot from my uptime monitoring system. It's checking each host every 5 seconds, and I highlighted the hour in which all the tests took place. You can see some large spikes for companies that seemed to have latency struggles.
Test 2. Quick Results Table
|
Success |
Errors |
Timeouts |
Hits/second |
Avg Response (ms) |
Max Hit Rate (per second) |
| ASO |
27057 |
777 |
518 |
451 |
739 |
597 |
| GoDaddy |
49711 |
685 |
1 |
829 |
148 |
1750 |
| Pagely |
48228 |
0 |
1 |
804 |
216 |
1580 |
| Pressable |
43815 |
503 |
9 |
730 |
271 |
1466 |
| SiteGround |
48735 |
12 |
19 |
812 |
263 |
1708 |
| WebSynthesis |
20855 |
35773 |
0 |
348 |
120 |
763 |
| WPEngine |
39784 |
25 |
1008 |
663 |
304 |
1149 |
GoDaddy seemed to have the best peak performance again. SiteGround and Pagely seemed to handle the load fantastically and didn't show any signs of performance issues (again). With the exception of A Small Orange, every host saw an improvement in average response time. As I wrote earlier, this may be because they were tested only from US locations. That caveat aside, the response times are a lot closer together and look pretty good for US based visitors. Still, this test also started to raise questions about many web hosts' ability to handle a heavy traffic load.
WebSynthesis Response to ECONNRESET Errors
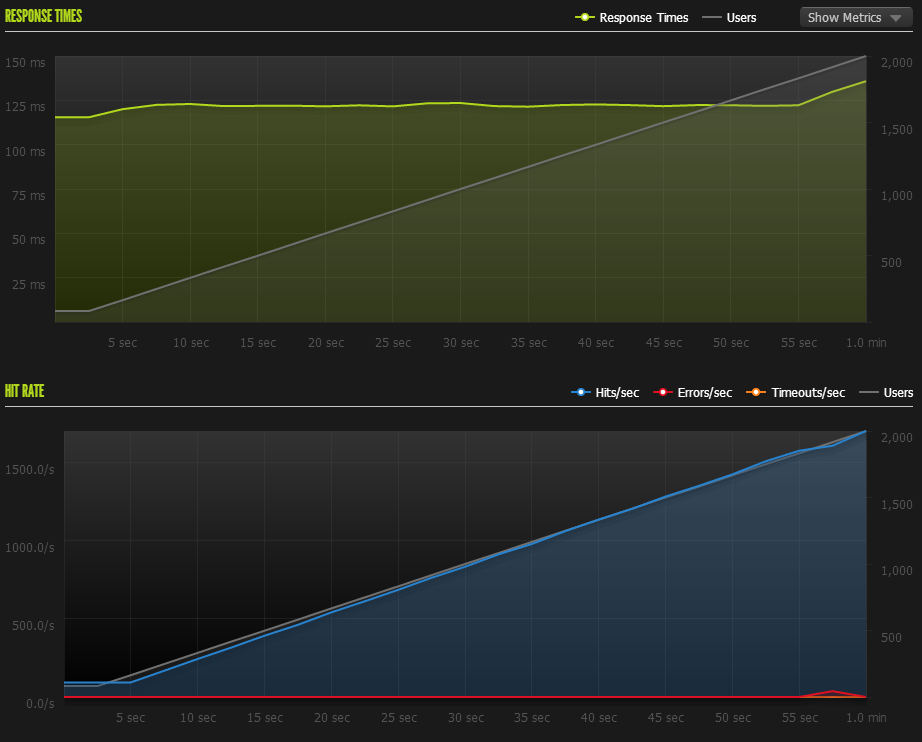
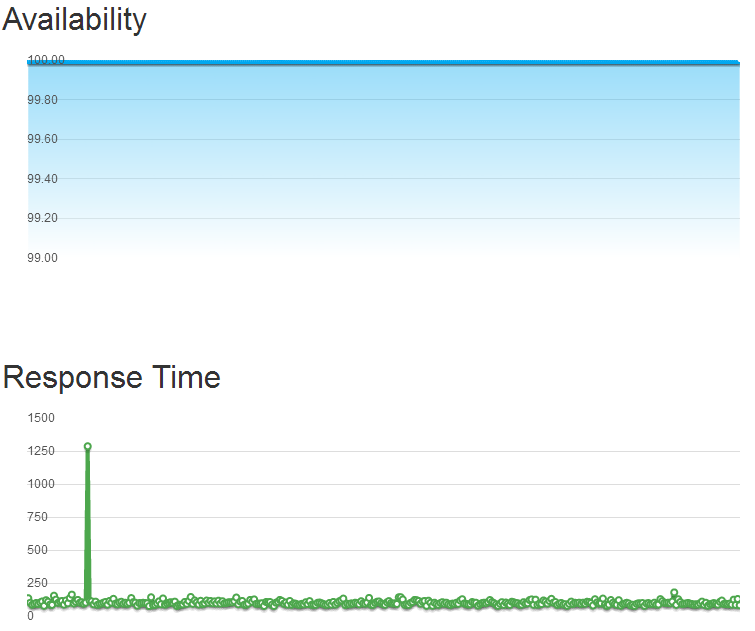
WebSynthesis ran into the same issue in both tests, a strange ECONNRESET error. Suspecting something may be blocking the test requests' as a security measure, I asked them to investigate. They made a change to their nginx config after the initial set of testing and wrote back "we made adjustments to handle the types of URLs you were hitting us with. We did review our logs and do not see these in production thus will not put these kinds of changes in production as we feel they are unrealistic." Here are the results:
 (Download Full Report WebSynthesis2.pdf)
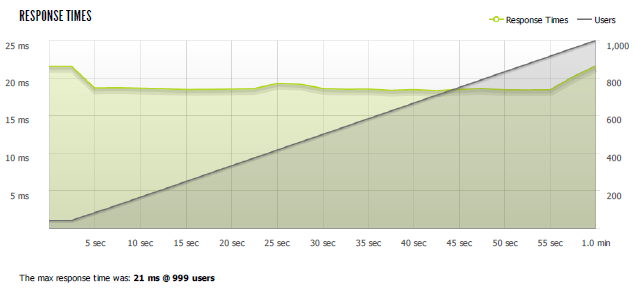
The new WebSynthesis results were pretty impressive. Average ping of 123ms (3ms slower than initial test), 871 hits/second average, 1704 hits/second and with only 94 errors (ECONNRESET again). The original tests did not suggest that either the hardware or software was starting to buckle. But the configuration change does indicate that they were probably blocking some of the requests. Load testing tools can't fully emulate users (they generally come from only a couple of machines) and it's conceivable that some security measures are triggered by their unusual behavior. Since I am testing these companies out of the box, I am leaving this result separate where support got involved and changed configuration settings.
Uptime
What is often more important than peak performance is how well a service does on average. To test this, I used two services: UptimeRobot and a NodeJS project called Uptime.
UptimeRobot Results
Monitored HTTP and Ping every 5 minutes. This was over a 10 day span.
|
HTTP |
Ping |
| ASO |
1 |
1 |
| GoDaddy |
0.9979 |
- |
| Pagely |
0.9862 |
- |
| Pressable |
0.9995 |
1 |
| SiteGround |
0.9993 |
1 |
| WebSynthesis |
1 |
1 |
| WPEngine |
1 |
1 |
A Small Orange, WebSynthesis and WPEngine showed no downtime. Every server responded to pings 100% of the time with the exception of GoDaddy and Pagely which seemed to be blocking pings to the server (at least from UptimeRobot).
Pagely's downtime was mostly my own doing (3 hours), when I was editing a template to use some of these testing services. Only 5 minutes of the downtime was unrelated to that incident.
GoDaddy had 28 minutes of downtime. SiteGround had 9 minutes. Pressable had 5 minutes.
When you account for my screwup, only GoDaddy shows up under the 99.9% uptime threshold.
Uptime (nodejs) Results
Uptime was configured to perform an HTTP check every 5 seconds on each host with a 1500ms slow threshold. This was executed from a Digital Ocean VPS in NYC.
Responsiveness is defined as the percentage of pings above slow threshold over the period. Availability is the uptime percentage.
|
Availability (%) |
Downtime (m) |
Response Time (ms) |
Responsiveness (%) |
| ASO |
99.998 |
1 |
204 |
99.97 |
| GoDaddy |
99.963 |
17 |
309 |
99.679 |
| Pagely |
99.998 |
1 |
237 |
99.974 |
| Pressable |
99.914 |
39 |
727 |
90.87 |
| SiteGround |
99.997 |
1 |
206 |
99.616 |
| WebSynthesis |
99.994 |
3 |
97 |
99.727 |
| WPEngine |
99.965 |
16 |
209 |
99.819 |
Nobody had a perfect record although four companies (A Small Orange, Pagely, SiteGround and WebSynthesis) were above the 99.99% uptime marker. The rest were still all above 99.9%. The most worrisome result was Pressable because they had the most downtime and a very high average response time. This might be caused by the monitoring server being far away from their server. Below is a detailed graph of the response times:
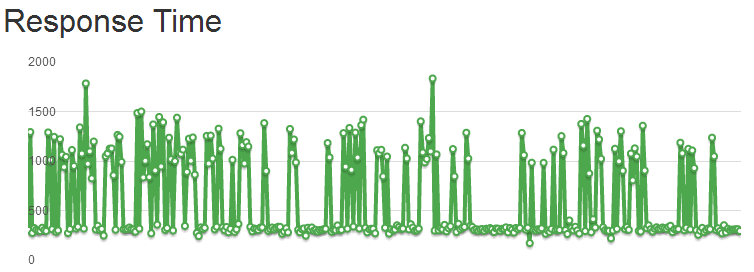
The lowest ping I saw was around 172ms and the relatively consistent bottom line of pings at around 300ms is reasonable. However, inconsistent performance with high spikes results in a very high average. Every other company had a fairly smooth graph in comparison. They show an occasional spike and/or some small variance (<100ms) between response at the base line, but nobody came close to a graph like Pressable's. The next most interesting is A Small Orange's graph:
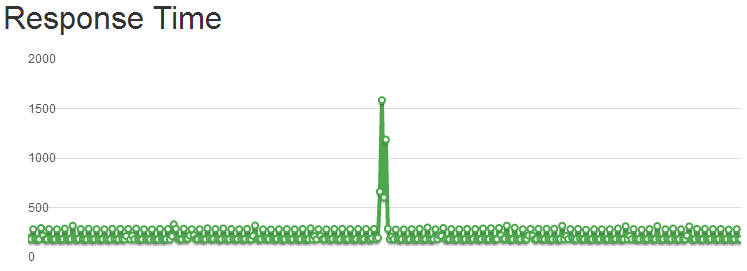
Though within reasonable response times, it has a spike and a weird pattern bouncing between around 170ms and 270ms.
Giving Pressable the benefit of the doubt, I signed up for Pingdom and monitored what their service saw. This was done with 1 minute resolution.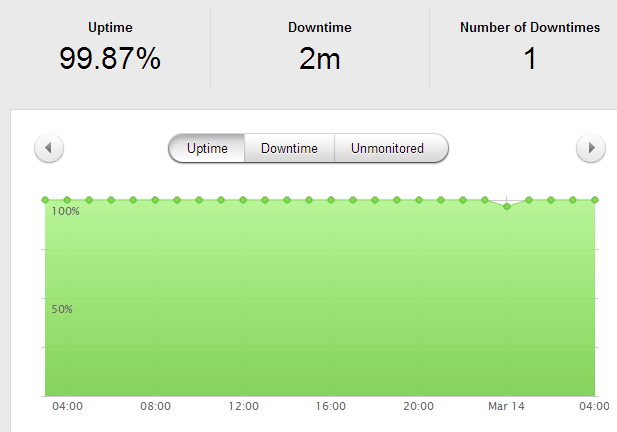
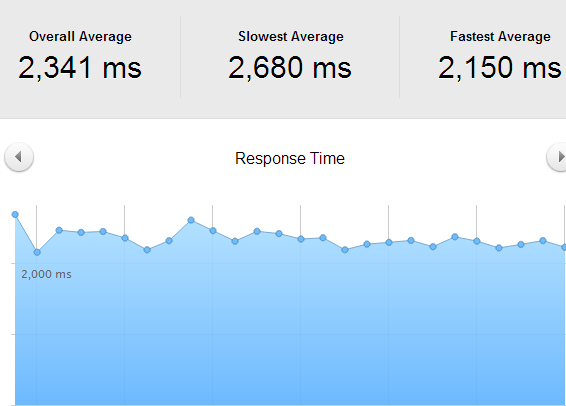
The pings varied pretty wildly, the highest being 2680ms and lowest 2150, a 530ms difference. And that was based on hourly averages; the variance within each hour may have been much greater. It would seem to corroborate the results from the Uptime script I was running, i.e. performance fluctuates a lot.
WebPageTest.org
Every test was run with the settings: Chrome Browser, 9 Runs, native connection (no traffic shaping), first view only. This was tested against the default install from every company. I also tested SiteGround's multiple levels of their SuperCache technology from one location to see how much it improved performance. SuperCache was left on for all the other tests performed. You will also notice the original A Small Orange and the WordPress optimized LEMP stack. Digital Ocean hadn't completely failed out at this point yet either.
| Company |
Dulles,VA (s) |
Miami, FL (s) |
Denver, CO (s) |
Los Angeles, CA (s) |
Average Load (s) |
| A Small Orange |
1.894 |
2.035 |
2.381 |
1.648 |
1.9895 |
| ASO Lemp |
0.85 |
0.961 |
1.056 |
0.665 |
0.883 |
| Digital Ocean |
1.245 |
0.95 |
1.419 |
0.924 |
1.1345 |
| GoDaddy |
0.94 |
1.208 |
1.229 |
0.671 |
1.012 |
| Pressable |
0.642 |
1.174 |
1.721 |
0.981 |
1.1295 |
| SiteGround |
1.073 |
1.327 |
1.682 |
1.353 |
1.35875 |
| SiteGround (Varnish Dynamic Cache) |
0.732 |
|
|
|
|
| SiteGround (Varnish Dynamic Cache, Memcached) |
0.725 |
|
|
|
|
| SiteGround (PageSpeed, Memcached) |
1.216 |
|
|
|
|
| WPEngine |
0.812 |
1.235 |
1.06 |
1.08 |
1.04675 |
| Pagely |
0.924 |
1.083 |
1.46 |
0.748 |
1.05375 |
| WebSynthesis |
0.616 |
1.021 |
1.516 |
1.116 |
1.06725 |
You can see a huge performance difference in A Small Orange's default cPanel install and their optimized LEMP stack. Load times were reduced by more than half from every location. That should convince you that optimizing WordPress can dramatically improve performance. To a lesser degree, you can see it happen when SiteGround's various SuperCache options are turned on.
A Small Orange's LEMP stack leads the pack here. However, it's amazing how close the performance of most of these companies was on this test.
Conclusion
Every service seems to have their issues somewhere. I try to avoid injecting my personal opinion and bias as much as possible. So I won't be ranking or outright saying any single company is the best. Some providers did exceptionally well and tended to clump together performance-wise, I will call those the top tier providers. This top tier designation is related to performance only and from the results of these tests. What each of these companies is offering is different and may best suit different audiences depending on a variety of factors beyond performance, such as features, price, support, and scale (I only tested entry level plans). But I will provide a short summary and discussion of the results for each provider.
A Small Orange
Once I moved away from the stock WordPress install on a normal VPS to their specialized LEMP WordPress VPS, it was a much better experience. Their uptime was near perfect on both services (1 minute of downtime total measured between them). The first load test it performed incredibly well and was 2nd by only a few requests per second. However, ASO did buckle under the heavier load test but it didn't fail out and managed to respond to most requests (including uptime monitoring) during the whole event. While their performance didn't scale as well as most of the competitors, I did receive a lot of support from them and it was quite responsive, in-line with what I would expect from a company that has one of the highest support ratings.
Digital Ocean
They are not in the same business as the rest of these companies. I added them because I wanted to see how well a stock install of WordPress would compete with pretty good hardware that's low cost (SSD backed VPS). The results here aren't a knock on their service at all. As I said earlier, this blog is running on a Digital Ocean VPS. The difference is I have spent many hours configuring it myself to be somewhat high performance. Digital Ocean is designed for people who can administrate their own servers. If you need managed WordPress hosting, stick to companies that are managing WordPress for you. If you're comfortable and want to do it yourself, these guys have one of the highest rated companies that we track.
GoDaddy
This whole test started from a statement made by Jeff King, a senior vice president at GoDaddy and GM of their hosting division. He wrote to me, "The new products are top of the market (really, you can’t get faster WordPress anywhere now) and we’re just beginning." Challenge accepted.
GoDaddy surprised me, and in a good way. They have a pretty bad reputation in the web community and it shows on this site where their overall score is below 50%. Yet, their WordPress hosting kept up or led the pack in some of the performance tests. In both Blitz.io load tests, out-of-the-box, GoDaddy had the highest number of successful requests, the highest number of concurrent users, and either 1st or 2nd in average response time. (WebSynthesis's performance did beat them when their support investigated connection resets) There were some weird performance bumps during the load tests, but nothing major. The biggest blot in terms of performance was on their uptime. They had the most downtime (28 minutes) of any of the companies tracked in UptimeRobot's monitoring (which ran longer than my second Uptime monitoring setup). But it was still 99.8% uptime, not a huge knock.
Overall, I would say GoDaddy delivered on their claim, performance wise. They appear to be in the top tier of specialized WordPress hosting companies. Given their price, I think they have the potential to push down pricing on most of their competitors who charge 3-4 times what GoDaddy charges. If we take a more holistic view, beyond performance, they still don't have all the tools to cater to the different niches that the specialized companies are competing for (although there were some hints dropped that things like Git, Staging Environments and more were coming soon). And then there is a branding problem they are trying to overcome. But GoDaddy is definitely doing some things very right and should make the managed WordPress hosting space very interesting.
Pagely
Pagely's performance didn't ever seem to get affected by any tests. They had a mere 5 minutes of downtime. The load testing services never seemed to cause any stress on their system. It was an impressively consistent performance. They didn't have the highest peak performance on the load tests, but they had a flat response time and only a single error or timeout in each blitz load test. One thing that irritated me about their offer was charging extra for SFTP access. Every other company included this for free and it's generally a given with a web hosting service. Still, a very impressive performance by Pagely, they are definitely in the top tier.
Pressable
Pressable had some issues during this test. I am not sure why but there was a very strange issue where performance seemed to repeatedly spike throughout my entire testing session. When it was good, it was performing at a level consistent with the top tier providers. The problem was, it wasn't always good. On the large Blitz load test there was consistent performance except for two spikes, which put it behind the front of the pack. It caused low responsiveness scores and potentially some downtime calculations as well. The foundation of a top tier provider is there, and generously open sourced on GitHub. They just need to sort out this weird performance spikiness issue.
SiteGround
Another very pleasant surprise in SiteGround. Not only are you getting cPanel hosting, you're getting top tier WordPress performance once you fully enable their SuperCacher plugin. They are one of the most well liked companies we track and have some of the best rated support. I honestly didn't know they were offering such high performance WordPress hosting. They didn't have the absolute fastest responses or push the highest concurrent users but they kept pace. They had one of the stranger graphs on the heavy load test, for some reason the performance got even better after a big spike. They had excellent uptime at above 99.9% measured by both services. Like GoDaddy, SiteGround looks like they could make this space interesting with a $7.95 plan performing on par with plans 3-4x its cost. While I didn't get to try some of the more developer-centric features like a staging environment and Git, they are available on a plan that's as little as 50% of the cost of the competitors at $14.95. Definitely in the top tier of managed WordPress providers.
WebSynthesis
These guys are harder to evaluate. Their uptime was excellent: either perfect or upwards of 99.9% as measured by the two services. The load testing ran into a weird ECONNRESET error. Their support was very helpful and made some configuration changes that seemed to allow the load testing service through. Once they did that, they outperformed every provider on almost every metric, highest average hits/second, fastest response and most successful hits with relatively flat response times. As I wrote in my discussion about them, load testing tools aren't a perfect emulation of real users. But it looked like it was running into a security rule rather than actual strain on the service. If that assumption is correct, these guys are truly a top tier provider.
WPEngine
WPEngine had some issues. Uptime was not one of them, they were perfect or upwards of 99.9% in that department. However, their performance shortcomings became apparent during the load tests. They had the most errors and timeouts, besides WebSynthesis, in the first test and seemed to buckle under the load in the second test with rising errors and timeouts and slower response times. When WPEngine was first listed here on Review Signal, they had the highest rating of any company. They've fallen a bit since then but WPEngine still remains near the front of the pack. They have a strong brand and seem to be doing some things right. They have some features that few other providers have, but this test was mostly about performance. In that department, they didn't quite match the level of performance that some of their competitors reached.
Notes:
*Unnamed Load Testing Service
|
AVG Response |
Failures |
AVG Response Heavy |
| ASO |
2031 |
No |
|
| GoDaddy |
2120 |
No |
5904 |
| Pagely |
2398 |
No |
|
| Pressable |
1360 |
No |
15570 |
| SiteGround |
22659 |
Yes |
25712 |
| WebSynthesis |
1929 |
No |
3740 |
| WPEngine |
1835 |
No |
|
I didn't get to conduct a full test with this service because I may have caused the entire service to crash during testing. This table is showing 2 tests, on average response and whether failures occurred (any type of failures). The second test is what caused the service to crash and is incomplete. The first test was 500 users/second from 1 machine and the second was 8000 users/second from 40 machines. The response times were pretty slow all around, and SiteGround seemed to have some major issues with this test. I am unsure as to why, I re-ran the first test again later and it seemed to handle it without any failures (errors) on the second run. The testing system is in beta and it's really hard to know what happened. SiteGround seemed to handle Blitz's heavier test without issue and the second test here went fine. Hard to know if there was really an issue on SiteGround's end or the testing service. The heavy test was interesting, WebSynthesis ended up being the fastest which is a similar result to the Blitz.io test once they fixed the nginx config. Perhaps this load test wasn't triggering any of their security measures? I could not complete the testing because the system went down prematurely.
I am not sure if there are useful inferences to be drawn from these tests. I was asked not to name the service because of the issues encountered but I wanted to include the partial results here in case someone did find some value in looking at the numbers.
I actually tried a third load testing service that was also in beta and it never was able to fully run the tests either. I am starting to feel like load testing kryptonite.
Thank You
First off, I want to thank the companies that agreed to participate voluntarily. I had nothing but pleasant experiences dealing with the people at each company. A few even took it a step beyond and offered a lot of help and insight about how this test might be conducted. There was a surprising amount of consistency of views about what and how to measure performance offered. A few of the individuals who stood out the most:
David Koopman at GoDaddy for his insights on performance and testing.
Vid Luther at Pressable was incredibly helpful and knowledgeable about performance. He's even written a great article here about performance. He also helped get at least one other company on board for testing and for that, I am thankful as well.
Tina Kesova at Siteground has always been helpful and this test was no exception. She had SiteGround on board almost instantly when I just mentioned the seed of the idea back in November 2013.
A few friends of mine also helped in figuring out how to perform these tests and dealing with some of the technical challenges in benchmarking. Dave Lo, Eric Silverberg and Samuel Reed all offered their advice and helped me make the design of the tests as fair as possible.
A special thanks goes to people who read drafts of this article and provided feedback including Andrey Tarantsov, JR Harrel and my dad.
Anyone else I missed, I am sorry, and thank you too.


 WordPress & WooCommerce Hosting Performance Benchmarks 2021
 WooCommerce Hosting Performance Benchmarks 2020
 WordPress Hosting Performance Benchmarks (2020)
 The Case for Regulatory Capture at ICANN
 WordPress Hosting – Does Price Give Better Performance?
 Hostinger Review – 0 Stars for Lack of Ethics
 The Sinking of Site5 – Tracking EIG Brands Post Acquisition
 Dirty, Slimy, Shady Secrets of the Web Hosting Review (Under)World – Episode 1
 Free Web Hosting Offers for Startups