The full company list, product list, methodology, and notes can be found here.
This post focuses only on the results of the testing in the $101-200/month price bracket for WordPress Hosting.
Contents
Other Price Tier Results
<$25/Month Tier$25-50/Month Tier$51-100/Month Tier$101-200/Month Tier$201-500/Month Tier$500+/Month (Enterprise) Tier
Hosting Plan Details
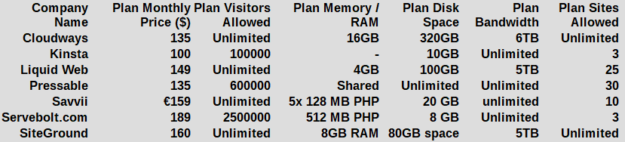
Click table for full product information.
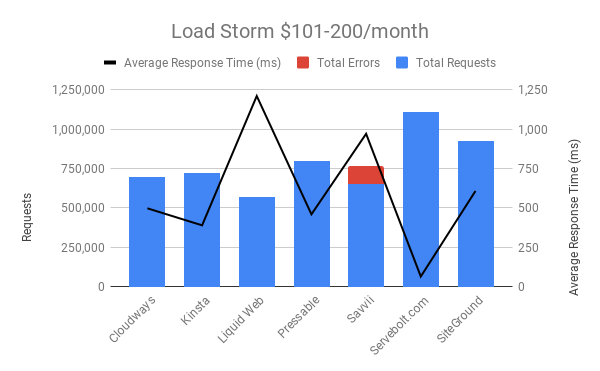
Load Storm Testing Results
Load Storm is designed to simulate real users visiting the site, logging in and browsing. It tests uncached performance.
Results Table
| Company Name | Total Requests | Total Errors | Peak RPS | Average RPS | Peak Response Time(ms) | Average Response Time (ms) | Total Data Transferred (GB) | Peak Throughput (MB/s) |
Average Throughput (MB/s)
|
| Cloudways | 697,841 | 0 | 569.98 | 387.69 | 4,651 | 498 | 41.88 | 35 | 23 |
| Kinsta | 723,242 | 0 | 555.97 | 401.80 | 7,926 | 390 | 44.4 | 35 | 25 |
| Liquid Web | 569,667 | 0 | 410.28 | 316.48 | 9,236 | 1,211 | 33.72 | 24 | 19 |
| Pressable | 798,038 | 3,036 | 608.52 | 443.35 | 15,527 | 460 | 43.59 | 34 | 24 |
| Savvii | 649,373 | 113,950 | 501.18 | 360.76 | 14,077 | 971 | 31 | 23 | 17 |
| Servebolt.com | 1,108,623 | 22 | 851.93 | 615.90 | 10,055 | 65 | 42.39 | 33 | 24 |
| SiteGround | 925,645 | 2,045 | 754.25 | 514.25 | 15,102 | 608 | 33.69 | 28 | 19 |
Discussion
Cloudways [Reviews], Kinsta, and Servebolt.com all handled the Lost Storm test without issue.
LiquidWeb [Reviews] had substantially increased response times as the test went on.
Pressable showed slight response time increases and a 0.38% error rate.
Savvii did not handle the Load Storm test well.
SiteGround [Reviews] showed a slight 0.22% error rate.
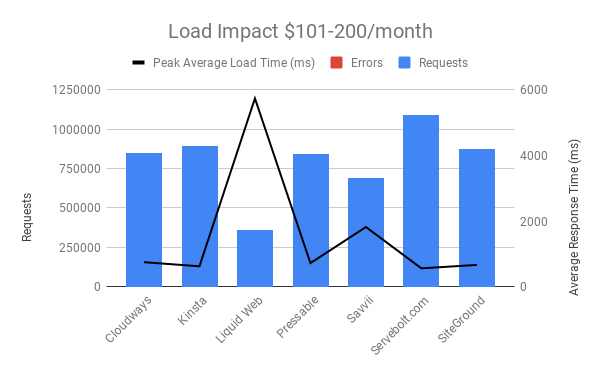
Load Impact Testing Results
Load Impact is designed to test cached performance by repeatedly requesting the homepage.
Results Table
| Company Name | Requests | Errors | Data Transferred (GB) | Peak Average Load Time (ms) | Peak Average Bandwidth (Mbps) | Peak Average Requests/Sec |
| Cloudways | 850691 | 1 | 47.6 | 749 | 805 | 1720 |
| Kinsta | 894981 | 0 | 49.75 | 624 | 815 | 1750 |
| Liquid Web | 360870 | 0 | 20.32 | 5740 | 214 | 464 |
| Pressable | 842967 | 0 | 47.96 | 721 | 814 | 1700 |
| Savvii | 688233 | 30 | 38.4 | 1820 | 500 | 1070 |
| Servebolt.com | 1092189 | 29 | 61.27 | 561 | 938 | 1070 |
| SiteGround | 877152 | 27 | 48.83 | 666 | 794 | 1990 |
Discussion
Cloudways, Kinsta, Pressable, Servebolt.com, and SiteGround all handled the Load Impact test without issue.
LiquidWeb showed significant signs of load with increased response times but zero errors.
Savvii showed significantly increased response times.
Uptime Monitoring Results
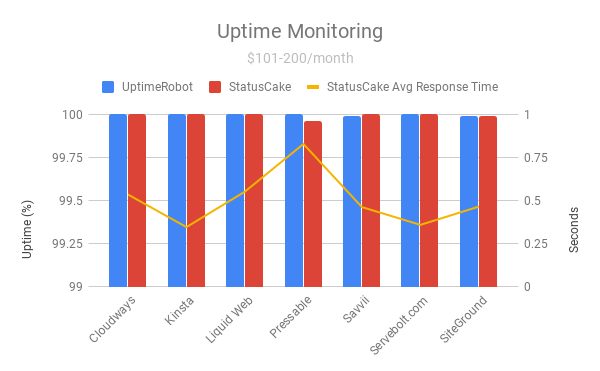
Results Table
| Company Name | UptimeRobot | StatusCake | StatusCake Avg Response Time |
| Cloudways | 100 | 100% | 0.535s |
| Kinsta | 100 | 100% | 0.346s |
| Liquid Web | 100 | 100% | 0.552s |
| Pressable | 100 | 99.96% | 0.828s |
| Savvii | 99.988 | 100% | 0.462s |
| Servebolt.com | 100 | 100% | 0.359s |
| SiteGround | 99.991 | 99.99% | 0.465s |
Discussion
The lowest uptime was a hair under 99.99% which is amazing for everyone.
WebPageTest.org Results
WebPageTest fully loads the homepage and records how long it takes from 11 different locations around the world.
Results Table
| Company Name | WPT Dulles | WPT Denver | WPT LA | WPT London | WPT Frankfurt | WPT Rose Hill, Mauritius |
| Cloudways | 0.728 | 0.934 | 0.892 | 1.114 | 1.275 | 2.553 |
| Kinsta | 0.558 | 0.819 | 0.781 | 1.007 | 1.069 | 2.29 |
| Liquid Web | 0.559 | 0.897 | 0.882 | 0.883 | 1.095 | 2.234 |
| Pressable | 0.621 | 1.444 | 2.003 | 1.238 | 1.342 | 3.823 |
| Savvii | 0.911 | 1.423 | 1.419 | 0.447 | 0.47 | 1.936 |
| Servebolt.com | 0.497 | 1.682 | 1.163 | 0.735 | 0.801 | 2.127 |
| SiteGround | 0.523 | 0.727 | 1.148 | 0.918 | 1.031 | 2.538 |
| Company Name | WPT Singapore | WPT Mumbai | WPT Japan | WPT Sydney | WPT Brazil |
| Cloudways | 1.387 | 1.92 | 1.096 | 1.508 | 1.411 |
| Kinsta | 1.704 | 2.003 | 1.241 | 1.583 | 1.357 |
| Liquid Web | 1.775 | 1.78 | 1.37 | 1.746 | 1.16 |
| Pressable | 3.51 | 2.682 | 2.098 | 2.696 | 2.178 |
| Savvii | 1.43 | 1.262 | 2.106 | 2.522 | 1.648 |
| Servebolt.com | 1.421 | 1.653 | 1.188 | 1.443 | 1.16 |
| SiteGround | 2.505 | 1.889 | 1.52 | 1.855 | 1.347 |
Discussion
There's no clearcut fast everywhere compared to their peers host in this price bracket.
Pressable is the slowest in 9/11 locales.
WPPerformanceTester Results
WPPerformanceTester performs two benchmarks. One is a WordPress (WP Bench) and the other a PHP benchmark. WP Bench measures how many WP queries per second and higher tends to be better (varies considerably by architecture). PHP Bench performs a lot of computational and some database operations which are measured in seconds to complete. Lower PHP Bench is better. WP Bench is blue in the chart, PHP Bench is red.
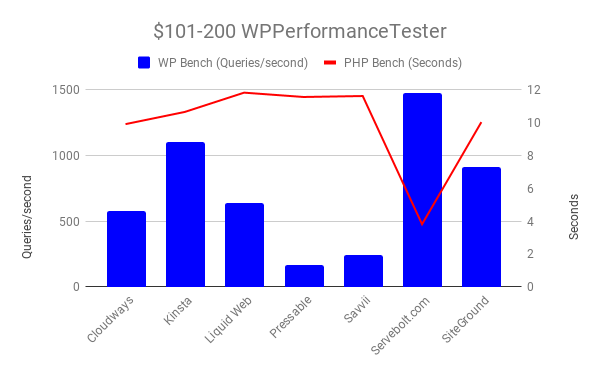
Results Table
| Company Name | PHP Bench | WP Bench |
| Cloudways | 9.911 | 578.3689994 |
| Kinsta | 10.654 | 1101.321586 |
| Liquid Web | 11.829 | 637.3486297 |
| Pressable | 11.565 | 165.3439153 |
| Savvii | 11.623 | 238.5496183 |
| Servebolt.com | 3.81 | 1477.104874 |
| SiteGround | 10.033 | 908.2652134 |
Discussion
Servebolt had incredibly fast PHP and WP Bench scores.
Qualsys SSL Report Grade
The tool is available at https://www.ssllabs.com/ssltest/
Results Table
| Company Name | Qualys SSL Report |
| Cloudways | A |
| Kinsta | A |
| Liquid Web | A |
| Pressable | A |
| Savvii | A |
| Servebolt.com | A+ |
| SiteGround | A |
Discussion
Everyone got an A, Servebolt earned an A+.
Conclusion
Top Tier
Cloudways [Reviews], Kinsta and Servebolt all handled the tests without issue and earned Top Tier status.
Honorable Mention
Pressable and SiteGround [Reviews] each earned an honorable mention. Pressable started to show a bit of load on the Load Storm test with slight increase in response times and a few errors. SiteGround had a low error rate but there seemed to be a few throughout the whole Load Storm test.
Individual Host Analysis
100% uptime and 1 cumulative error. Doesn't get much better than that. Top Tier.
Zero errors on load tests and 100% uptime. Kinsta earns another Top Tier award.
Liquid Web had 100% uptime and zero errors. The only difference between this being top tier and not is the average response time increased substantially during the load tests. While the servers kept running and didn't miss a single request, they got noticeably slower which kept Liquid Web out of any sort of recognition.
100% and 99.96% uptime were excellent. Zero errors on the Load Impact test. The only minor issue was the .38% error rate on the Load Storm and slight increase in response times as well. Definitely worthy of an honorable mention.
100% and 99.988% uptime were a solid start. The load tests proved to be a bit much though. Load Storm errored out and Load Impact showed signs of stress.
Perfect uptime, 57 cumulative errors on the load tests and the fastest average response times for both load tests made Servebolt.com an easy candidate for earning Top Tier status.
SiteGround had 99.99% uptime and handled Load Impact effortlessly. The only minor knock was the 0.22% error rate during the Load Storm test. Overall, a great performance which earned it Honorable Mention status.
Kevin Ohashi
Latest posts by Kevin Ohashi (see all)
- Analyzing Digital Ocean’s First Major Move with Cloudways - February 28, 2023
- Removing old companies - June 28, 2021
- WordPress & WooCommerce Hosting Performance Benchmarks 2021 - May 27, 2021
 WordPress & WooCommerce Hosting Performance Benchmarks 2021
 WooCommerce Hosting Performance Benchmarks 2020
 WordPress Hosting Performance Benchmarks (2020)
 The Case for Regulatory Capture at ICANN
 WordPress Hosting – Does Price Give Better Performance?
 Hostinger Review – 0 Stars for Lack of Ethics
 The Sinking of Site5 – Tracking EIG Brands Post Acquisition
 Dirty, Slimy, Shady Secrets of the Web Hosting Review (Under)World – Episode 1
 Free Web Hosting Offers for Startups