The full company list, product list, methodology, and notes can be found here.
This post focuses only on the results of the testing in the $25-50/month price bracket for WordPress Hosting.
Contents
Other Price Tier Results
<$25/Month Tier$25-50/Month Tier$51-100/Month Tier$101-200/Month Tier$201-500/Month Tier$500+/Month (Enterprise) Tier
Hosting Plan Details
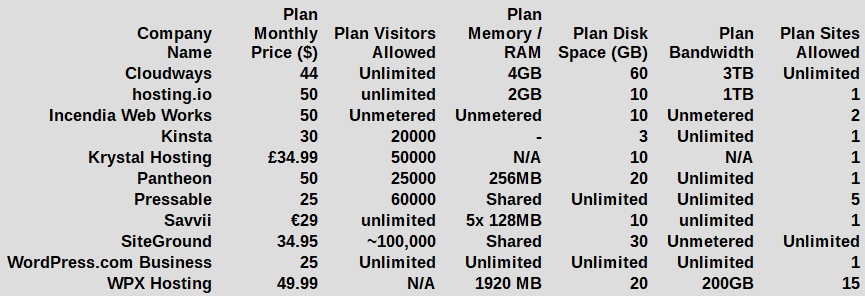
Click table for full product information.
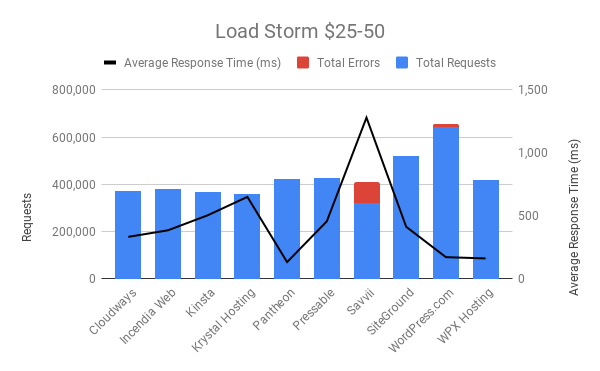
Load Storm Testing Results
Load Storm is designed to simulate real users visiting the site, logging in and browsing. It tests uncached performance.
Results Table
| Company Name | Total Requests | Total Errors | Peak RPS | Average RPS | Peak Response Time(ms) | Average Response Time (ms) | Total Data Transferred (GB) | Peak Throughput (MB/s) |
Average Throughput (MB/s)
|
| Cloudways | 373,598 | 0 | 278.68 | 207.55 | 3,889 | 334 | 22.48 | 17 | 12 |
| Incendia Web Works | 379,506 | 0 | 284.22 | 210.84 | 5,886 | 386 | 23.27 | 18 | 13 |
| Kinsta | 369,395 | 36 | 272.85 | 205.22 | 2,622 | 505 | 22.66 | 17 | 13 |
| Krystal Hosting | 357,327 | 0 | 257.42 | 198.51 | 8,058 | 651 | 21.35 | 16 | 12 |
| Pantheon | 420,625 | 133 | 328.20 | 233.68 | 10,022 | 134 | 24.21 | 20 | 13 |
| Pressable | 427,147 | 23 | 309.13 | 237.30 | 3,756 | 457 | 23.55 | 18 | 13 |
| Savvii | 321,332 | 89,069 | 244.33 | 178.52 | 15,348 | 1,280 | 7,613 | 5,362 | 4,230 |
| SiteGround | 518,673 | 1,662 | 377.45 | 288.15 | 6,746 | 414 | 22.24 | 16 | 12 |
| WordPress.com Business | 641,101 | 12,404 | 491 | 356.17 | 14,070 | 173 | 28.08 | 22 | 16 |
| WPX Hosting | 417,415 | 42 | 318.88 | 231.90 | 4,642 | 163 | 24.16 | 19 | 13 |
Discussion
Cloudways [Reviews], IWW, Kinsta, Krystal Hosting, Pantheon [Reviews], Pressable, and WPX Hosting all handled the Load Storm test without any issues.
WordPress.com Business had a security measure we couldn't work around that was causing some errors on wp-login but had zero errors outside of that, they managed to have the third fastest average response time.
Saavii did not handle this test well.
SiteGround [Reviews] had some minor issues with a tiny 0.32% error rate.
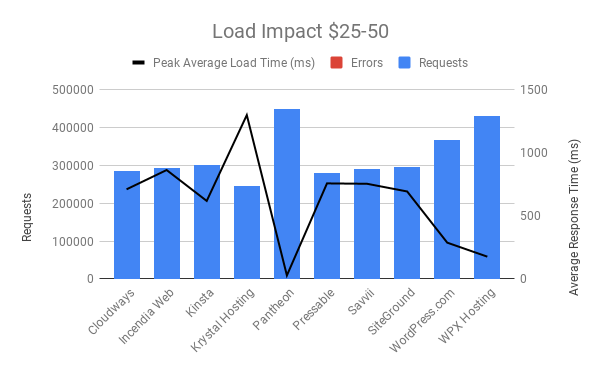
Load Impact Testing Results
Load Impact is designed to test cached performance by repeatedly requesting the homepage.
Results Table
| Company Name | Requests | Errors | Data Transferred (GB) | Peak Average Load Time (ms) | Peak Average Bandwidth (Mbps) | Peak Average Requests/Sec |
| WordPress.com Business | 368432 | 0 | 24.83 | 288 | 406 | 735 |
| Cloudways | 284176 | 0 | 15.82 | 711 | 279 | 608 |
| Incendia Web Works | 291894 | 0 | 16.15 | 864 | 250 | 551 |
| Kinsta | 301610 | 0 | 16.76 | 619 | 283 | 621 |
| Krystal Hosting | 246236 | 1 | 13.73 | 1300 | 196 | 428 |
| Pantheon | 450452 | 1 | 28.24 | 28 | 476 | 927 |
| Pressable | 280431 | 4 | 15.89 | 758 | 260 | 558 |
| Savvii | 290636 | 0 | 16.22 | 755 | 274 | 600 |
| SiteGround | 296498 | 0 | 16.57 | 694 | 280 | 612 |
| WPX Hosting | 430783 | 10 | 23.78 | 177 | 400 | 884 |
Discussion
Cloudways, IWW, Kinsta, Pantheon, Pressable, Savvii, SiteGround, WordPress.com Business and WPX Hosting all handled the Load Impact test without issue.
Krystal Hosting started to slow down and show increased response times.
Uptime Monitoring Results
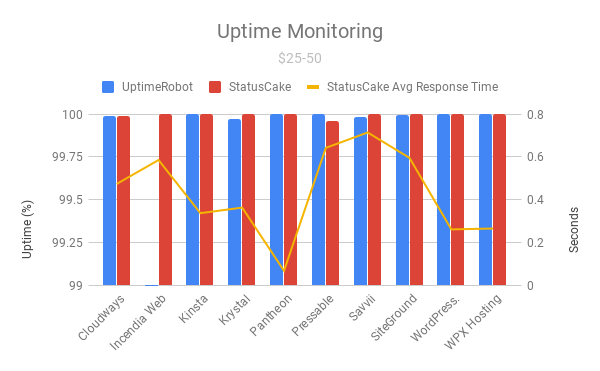
Results Table
| Company Name | UptimeRobot | StatusCake | StatusCake Avg Response Time |
| Cloudways | 99.99 | 99.99% | 0.474s |
| Incendia Web Works | 96.945 | 100% | 0.586s |
| Kinsta | 100 | 100% | 0.337s |
| Krystal Hosting | 99.974 | 100% | 0.363s |
| Pantheon | 100 | 100% | 0.067s |
| Pressable | 100 | 99.96% | 0.643s |
| Savvii | 99.987 | 100% | 0.715s |
| SiteGround | 99.993 | 100% | 0.596s |
| WordPress.com Business | 100 | 100% | 0.261s |
| WPX Hosting | 100 | 100% | 0.265s |
Discussion
Incendia Web Works downtime was because of a bad SSL certificate renewal bug in their system. Two of three servers got the updated certificate after 3 month renewal of Lets Encrypt and one didn't sync causing the uptime monitor to report downtime if it got the bad certificate. It's been fixed, but it wasn't early enough for the downtime to show up as below the 99.9% threshold expected. Because of the way each of the monitoring systems work, it seems StatusCake was more forgiving about SSL certs showing 100% uptime. The website never actually went offline, but users might have gotten an SSL warning.
Everyone else was above the 99.9% threshold.
WebPageTest.org Results
WebPageTest fully loads the homepage and records how long it takes from 11 different locations around the world.
Results Table
| Company Name | WPT Dulles | WPT Denver | WPT LA | WPT London | WPT Frankfurt | WPT Rose Hill, Mauritius |
| Cloudways | 0.741 | 0.809 | 0.688 | 1.041 | 1.18 | 2.523 |
| Incendia Web Works | 0.446 | 1.197 | 0.844 | 0.753 | 0.813 | 2.612 |
| Kinsta | 0.544 | 0.984 | 0.938 | 0.978 | 1.056 | 2.303 |
| Krystal Hosting | 0.907 | 1.536 | 1.444 | 0.483 | 0.483 | 2.562 |
| Pantheon | 0.416 | 0.92 | 0.544 | 0.402 | 0.678 | 1.594 |
| Pressable | 0.582 | 1.687 | 1.957 | 1.148 | 1.29 | 3.769 |
| Savvii | 0.902 | 1.278 | 1.395 | 0.45 | 0.801 | 2.284 |
| SiteGround | 0.563 | 0.748 | 1.121 | 0.942 | 1.084 | 2.521 |
| WordPress.com Business | 0.696 | 1.593 | 0.891 | 0.934 | 1.137 | 2.53 |
| WPX Hosting | 0.384 | 0.701 | 1.007 | 0.358 | 1.25 | 2.871 |
| Company Name | WPT Singapore | WPT Mumbai | WPT Japan | WPT Sydney | WPT Brazil |
| Cloudways | 1.416 | 1.814 | 0.895 | 1.475 | 1.341 |
| Incendia Web Works | 1.952 | 1.986 | 1.321 | 1.918 | 1.095 |
| Kinsta | 1.714 | 1.999 | 1.261 | 1.55 | 1.394 |
| Krystal Hosting | 2.047 | 2.012 | 1.977 | 2.615 | 1.64 |
| Pantheon | 0.937 | 0.919 | 0.795 | 0.952 | 0.813 |
| Pressable | 3.155 | 2.902 | 2.141 | 2.736 | 2.164 |
| Savvii | 1.999 | 1.74 | 2.499 | 2.976 | 2.165 |
| SiteGround | 2.017 | 1.883 | 1.488 | 2.028 | 1.301 |
| WordPress.com Business | 1.276 | 2.026 | 1.129 | 1.491 | 1.18 |
| WPX Hosting | 1.638 | 2.921 | 1.402 | 2.268 | 2.02 |
Discussion
Pantheon was the fastest in 7/11 locations and second fastest in 3/11. Pressable was the slowest in 6/11 locations.
WPPerformanceTester Results
WPPerformanceTester performs two benchmarks. One is a WordPress (WP Bench) and the other a PHP benchmark. WP Bench measures how many WP queries per second and higher tends to be better (varies considerably by architecture). PHP Bench performs a lot of computational and some database operations which are measured in seconds to complete. Lower PHP Bench is better. WP Bench is blue in the chart, PHP Bench is red.
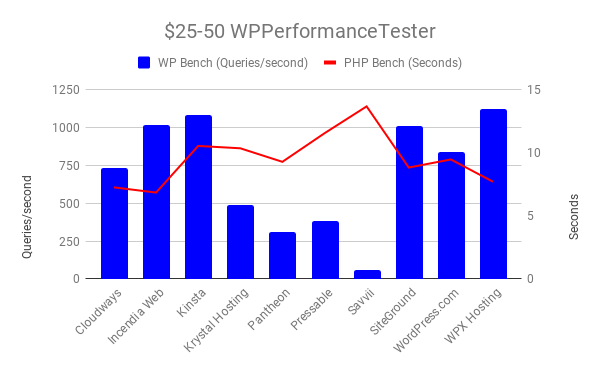
Results Table
| Company Name | PHP Bench | WP Bench |
| Cloudways | 7.265 | 729.9270073 |
| Incendia Web Works | 6.854 | 1019.367992 |
| Kinsta | 10.55 | 1085.77633 |
| Krystal Hosting | 10.365 | 488.5197851 |
| Pantheon | 9.291 | 312.3048095 |
| Pressable | 11.557 | 385.3564547 |
| Savvii | 13.687 | 60.90504903 |
| SiteGround | 8.838 | 1009.081736 |
| WordPress.com Business | 9.479 | 838.9261745 |
| WPX Hosting | 7.714 | 1119.820829 |
Discussion
Savvii had a very low WP Bench which measures the number of WordPress database queries per second. It also had the highest PHP Bench for how long it took to execute a series of functions.
Qualsys SSL Report Grade
The tool is available at https://www.ssllabs.com/ssltest/
Results Table
| Company Name | Qualys SSL Report |
| Cloudways | A |
| Incendia Web Works | A+ |
| Kinsta | A |
| Krystal Hosting | A |
| Pantheon | A |
| Pressable | A |
| Savvii | A |
| SiteGround | A |
| WordPress.com Business | A |
| WPX Hosting | A |
Discussion
Everyone got an A. IWW got an A+.
Conclusion

Top Tier
Cloudways [Reviews], Kinsta, Pantheon [Reviews], Pressable and WPX Hosting all earned Top Tier status this year and didn't have any issues with these tests.
Honorable Mention
WordPress.com Business and SiteGround [Reviews] both earned honorable mention status. WordPress.com Business had some security issues we couldn't work around for the Load Storm test that caused a higher error rate that excluded it from Top Tier status. SiteGround also had some higher than perfect error rates on the Load Storm test.
Individual Host Analysis
Cloudways has continued it's excellent performance from last year with a back to back Top Tier award. 99.9% uptime on both monitors, and zero load testing errors made them an easy shoe in for Top Tier status.
An SSL bug caused some downtime which put them below the threshold for earning recognition unfortunately this year. Otherwise, their load testing results were flawless with zero errors. IWW for the past three years has had excellent speed, I'm sad to see them disqualified from earning any recognition.
Kinsta earned Top Tier status yet again. One of only two companies that has earned Top Tier status on every plan, every year for the past 5 years.
A new entrant that did very well. Uptime was 99.97% and 100%. Load Storm had no errors or increased response time. It was borderline honorable mention but the Load Impact test showed a large spike and increased response time which kept it out of honorable mention status.
Fast. While maintaining a perfect 100%/100% uptimes they were also the fastest average response time in both load tests and uptime monitoring. In the WPT test Pantheon was the fastest in 7/11 locales and third in 3/11. A truly excellent performance which earned them Top Tier recognition.
A Top Tier performance from Pressable. It wasn't the absolute fastest, but it had a combined 27 errors across both load tests and 100%/99.96% uptime. A consistent and near perfect experience from a company that has for years earned Top Tier status.
Another new entrant for this year's testing. The uptime and Load Impact tests looked good. The Load Storm test seemed to overload the server completely though. I also am not sure what's going on with the WP Bench, it was very low which might be why the Load Storm test didn't go well. There was some communication issues because a key staff person left mid-testing, hoping to see much better results next year.
A very solid performance that earned honorable mention recognition. The only ding against it was a handful of errors on the Load Storm test which kept it out of being a Top Tier performance.
Automattic finally entered at the lower price end after competing with their VIP offering for years. Their new plans actually allowed us to test and the results were quite good. The only drawback was a security limit which couldn't be changed for the Load Storm test which caused some errors on the wp-login file. There wasn't any errors to any other resource at all. They were in the top 3 for fastest response time in all load tests and uptime monitoring as well. I wish we could have had a clean Load Storm test, but it was a great showing otherwise.
The return of WPX to these tests has been a welcome one. They earned Top Tier status again with 100%/100% uptime and almost no errors on Load Tests. They were even the fastest in three of eleven WPT tests.
Kevin Ohashi
Latest posts by Kevin Ohashi (see all)
- Analyzing Digital Ocean’s First Major Move with Cloudways - February 28, 2023
- Removing old companies - June 28, 2021
- WordPress & WooCommerce Hosting Performance Benchmarks 2021 - May 27, 2021
 WordPress & WooCommerce Hosting Performance Benchmarks 2021
 WooCommerce Hosting Performance Benchmarks 2020
 WordPress Hosting Performance Benchmarks (2020)
 The Case for Regulatory Capture at ICANN
 WordPress Hosting – Does Price Give Better Performance?
 Hostinger Review – 0 Stars for Lack of Ethics
 The Sinking of Site5 – Tracking EIG Brands Post Acquisition
 Dirty, Slimy, Shady Secrets of the Web Hosting Review (Under)World – Episode 1
 Free Web Hosting Offers for Startups