The full company list, product list, methodology, and notes can be found here.
This post focuses only on the results of the testing in the <$25/month price bracket for WordPress Hosting.
Contents
Other Price Tier Results
<$25/Month Tier$25-50/Month Tier$51-100/Month Tier$101-200/Month Tier$201-500/Month Tier$500+/Month (Enterprise) Tier
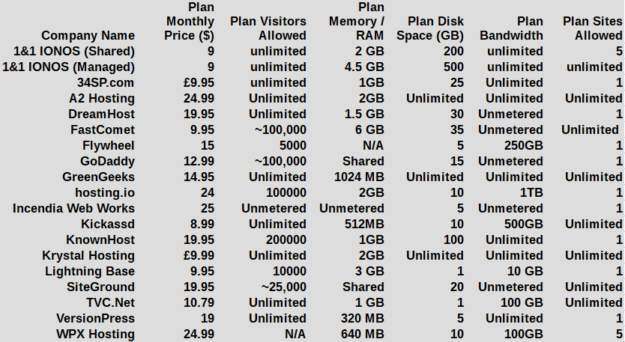
Hosting Plan Details
Click table for full product information.
Load Storm Testing Results
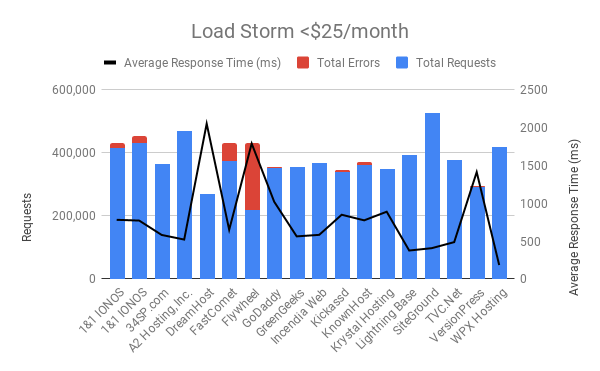
Load Storm is designed to simulate real users visiting the site, logging in and browsing. It tests uncached performance.
Results Table
| Company Name | Total Requests | Total Errors | Peak RPS | Average RPS | Peak Response Time(ms) | Average Response Time (ms) | Total Data Transferred (GB) | Peak Throughput (MB/s) |
Average Throughput (MB/s)
|
| 1&1 IONOS (ManagedWP) | 415,889 | 15,739 | 330.28 | 231.05 | 15,451 | 782 | 11.19 | 9 | 6 |
| 1&1 IONOS (Shared) | 430,896 | 22,271 | 319.10 | 239.39 | 16,042 | 772 | 21.57 | 16 | 12 |
| 34SP.com | 363,301 | 0 | 268.2 | 201.83 | 6,629 | 582 | 21.85 | 16 | 12 |
| A2 Hosting | 467,761 | 2,657 | 338.48 | 259.87 | 8,550 | 521 | 24.09 | 18.09 | 13 |
| DreamHost | 269,401 | 159 | 184.75 | 149.67 | 16,849 | 2,053 | 14.16 | 10.13 | 7.867 |
| FastComet | 374,487 | 56,230 | 267.22 | 208.05 | 15,089 | 650 | 18 | 13 | 10 |
| Flywheel | 219,433 | 210,720 | 428.82 | 121.91 | 39,378 | 1,790 | 1.425 | 2.254 | 0.791 |
| GoDaddy | 351,107 | 3,634 | 285.92 | 195.06 | 15,075 | 1,021 | 14.85 | 12 | 8.250 |
| GreenGeeks | 355,036 | 0 | 269.52 | 197.24 | 6,780 | 563 | 21.75 | 17 | 12 |
| Incendia Web Works | 367,005 | 7 | 273.42 | 203.89 | 15,086 | 583 | 22.48 | 17 | 12 |
| Kickassd | 339,432 | 6,758 | 309.77 | 188.57 | 15,543 | 849 | 19 | 15 | 10 |
| KnownHost | 362,717 | 7,756 | 279.78 | 201.51 | 15,626 | 775 | 21 | 16 | 12 |
| Krystal Hosting | 348,494 | 346 | 257.08 | 193.61 | 15,103 | 889 | 20 | 14 | 11 |
| Lightning Base | 392,619 | 0 | 302.60 | 218.12 | 2,682 | 376 | 23.66 | 19 | 13 |
| SiteGround | 525,998 | 1,890 | 388.68 | 292.22 | 6,106 | 407 | 22.3 | 17 | 12 |
| TVC.Net | 378,196 | 0 | 277.93 | 210.11 | 4,647 | 487 | 22.72 | 18 | 13 |
| VersionPress | 292,398 | 3,755 | 201.28 | 162.44 | 16,212 | 1,413 | 17.07 | 13 | 9.482 |
| WPX Hosting | 418,768 | 16 | 313.90 | 232.65 | 7,250 | 184 | 24.24 | 19 | 13 |
Discussion
34SP, GreenGeeks, Incendia Web Works, LightningBase, TVC.net and WPX Hosting all handled this test without issue.
DreamHost [Reviews] had 0.06% error rate but the response times went above 2,000ms. Krystal Hosting had 0.1% error rate but their response time went up from around 500ms to the 900ms range. SiteGround [Reviews] had a 0.36% error rate and relatively stable response time hovering around 400ms.
1&1 IONOS [Reviews], A2 Hosting [Reviews], FastComet, Flywheel [Reviews], GoDaddy [Reviews], Kickassd, KnownHost [Reviews], and VersionPress all struggled with this test to varying degrees.
Load Impact Testing Results
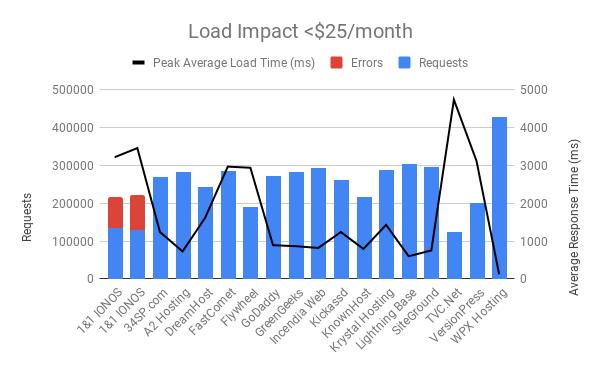
Load Impact is designed to test cached performance by repeatedly requesting the homepage.
Results Table
| Company Name | Requests | Errors | Data Transferred (GB) | Peak Average Load Time (ms) | Peak Average Bandwidth (Mbps) | Peak Average Requests/Sec |
| 1&1 IONOS (ManagedWP) | 135612 | 81052 | 2.86 | 3220 | 28 | 277 |
| 1&1 IONOS (Shared) | 130389 | 92622 | 2.2 | 3460 | 21 | 258 |
| 34SP.com | 270349 | 0 | 15.08 | 1240 | 218 | 476 |
| A2 Hosting | 283847 | 0 | 15.56 | 728 | 254 | 566 |
| DreamHost | 241985 | 0 | 13.49 | 1620 | 181 | 396 |
| FastComet | 285843 | 123 | 15.96 | 2970 | 265 | 579 |
| Flywheel | 190353 | 0 | 10.64 | 2940 | 126 | 275 |
| GoDaddy | 272051 | 0 | 15.19 | 893 | 255 | 557 |
| GreenGeeks | 283471 | 0 | 15.76 | 867 | 268 | 587 |
| Incendia Web Works | 293848 | 2 | 16.31 | 820 | 254 | 560 |
| Kickassd | 260999 | 0 | 14.54 | 1240 | 209 | 459 |
| KnownHost | 216955 | 0 | 16.03 | 794 | 275 | 601 |
| Krystal Hosting | 286796 | 1 | 12.94 | 1430 | 179 | 405 |
| Lightning Base | 303266 | 0 | 17.15 | 601 | 284 | 613 |
| SiteGround | 295824 | 0 | 16.63 | 754 | 285 | 619 |
| TVC.Net | 124060 | 0 | 6.93 | 4740 | 75 | 164 |
| VersionPress | 200922 | 132 | 11.18 | 3120 | 152 | 331 |
| WPX Hosting | 427031 | 0 | 23.58 | 125 | 369 | 815 |
Discussion
A2 Hosting, GoDaddy, GreenGeeks, IWW, KnownHost, LightningBase, SiteGround, and WPX Hosting all handled this test without issue.
34SP went from 700ms to 1500ms response times starting around 750 users. Kickassd went from 700ms to 1500ms. Krystal Hosting went from 800ms to 1400ms response times starting around 600 users.
DreamHost, Flywheel, GoDaddy, TVC.net and VersionPress didn't error significantly but response times increased a substantial amount.
1&1 IONOS struggled with this test.
Uptime Monitoring Results
Results Table
| Company Name | UptimeRobot | StatusCake | StatusCake Avg Response Time |
| 1&1 IONOS (ManagedWP) | 99.993 | 99.99% | 0.802s |
| 1&1 IONOS (Shared) | 99.989 | 99.99% | 0.599s |
| 34SP.com | 99.997 | 99.99% | 0.350s |
| A2 Hosting, Inc. | 99.912 | 99.99% | 0.717s |
| DreamHost | 99.966 | 99.92% | 0.926s |
| FastComet | 99.9 | 99.90% | 0.733s |
| Flywheel | 99.966 | 99.98% | 0.433s |
| GoDaddy | 43.253 | 78.02% | 0.377s |
| GreenGeeks | 99.984 | 99.98% | 0.666s |
| Incendia Web Works | 97.046 | 100% | 0.584s |
| Kickassd | 99.965 | 99.94% | 0.359s |
| KnownHost | 99.99 | 99.99% | 0.432s |
| Krystal Hosting | 99.958 | 99.96% | 0.406s |
| Lightning Base LLC | 99.999 | 100% | 0.470s |
| SiteGround | 99.993 | 100% | 0.530s |
| TVC.Net | 100 | 100% | 0.504s |
| VersionPress | 99.973 | 99.60% | 0.502s |
| WPX Hosting | 100 | 99.99% | 0.275s |
Discussion
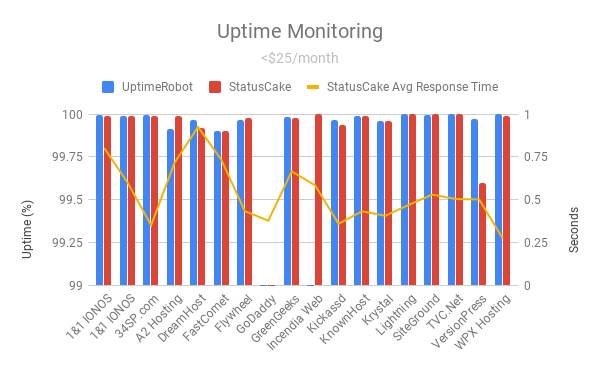
Most companies did fine on the uptime monitoring with TVC.net being the only company to manage a perfect 100%/100% uptime on both monitors. FastComet was right on the border with 99.9% uptime on both monitors, the very minimum before disqualification for any sort of recognition.
GoDaddy struggled with maintaining uptime tremendously.
Incendia Web Works downtime was because of a bad SSL certificate renewal bug in their system. Two of three servers got the updated certificate after 3 month renewal of Lets Encrypt and one didn't sync causing the uptime monitor to report downtime if it got the bad certificate. It's been fixed, but it wasn't early enough for the downtime to show up as below the 99.9% threshold expected. Because of the way each of the monitoring systems work, it seems StatusCake was more forgiving about SSL certs showing 100% uptime. The website never actually went offline, but users might have gotten an SSL warning.
VersionPress struggled at the border and one monitor showed them at 99.6% while the other was above 99.9%.
WebPageTest.org Results
WebPageTest fully loads the homepage and records how long it takes from 11 different locations around the world.
Results Table
| Company Name | WPT Dulles | WPT Denver | WPT LA | WPT London | WPT Frankfurt | WPT Rose Hill, Mauritius |
| 1&1 IONOS (ManagedWP) | 2.747 | 3.165 | 2.911 | 3.066 | 3.233 | 4.655 |
| 1&1 IONOS (Shared) | 0.995 | 1.131 | 1.254 | 1.393 | 1.527 | 2.647 |
| 34SP.com | 0.787 | 1.873 | 1.843 | 0.407 | 0.497 | 1.662 |
| A2 Hosting, Inc. | 0.67 | 0.755 | 0.707 | 1.094 | 1.313 | 2.566 |
| DreamHost | 0.487 | 0.967 | 1.013 | 0.752 | 0.998 | 2.997 |
| FastComet | 0.644 | 1.225 | 1.009 | 1.536 | 1.585 | 3.268 |
| Flywheel | 0.566 | 0.913 | 0.774 | 0.967 | 1.018 | 2.132 |
| GoDaddy | 0.813 | 1.178 | 2.682 | 1.663 | 2.087 | 3.678 |
| GreenGeeks | 0.517 | 1.026 | 0.864 | 0.837 | 0.963 | 2.25 |
| Incendia Web Works | 0.419 | 1.42 | 0.838 | 0.768 | 0.798 | 2.527 |
| Kickassd | 0.483 | 0.863 | 0.906 | 0.773 | 0.859 | 2.174 |
| KnownHost | 0.56 | 1.09 | 0.884 | 0.994 | 1.066 | 2.396 |
| Krystal Hosting | 0.872 | 1.441 | 1.701 | 0.467 | 0.464 | 1.757 |
| Lightning Base LLC | 0.533 | 0.987 | 0.777 | 0.876 | 0.982 | 2.059 |
| SiteGround | 0.535 | 0.994 | 1.162 | 0.925 | 1.027 | 2.614 |
| TVC.Net | 0.668 | 1.21 | 0.568 | 0.992 | 1.061 | 2.25 |
| VersionPress | 0.904 | 1.189 | 1.459 | 0.521 | 0.582 | 1.561 |
| WPX Hosting | 0.415 | 0.756 | 0.829 | 0.402 | 1.493 | 2.9 |
| Company Name | WPT Singapore | WPT Mumbai | WPT Japan | WPT Sydney | WPT Brazil |
| 1&1 IONOS (ManagedWP) | 3.718 | 4.029 | 4.143 | 3.86 | 3.282 |
| 1&1 IONOS (Shared) | 2.605 | 2.286 | 2.095 | 2.322 | 1.632 |
| 34SP.com | 1.51 | 1.266 | 2.23 | 2.65 | 1.636 |
| A2 Hosting, Inc. | 1.424 | 1.937 | 1.074 | 1.386 | 1.293 |
| DreamHost | 2.077 | 2.864 | 1.519 | 2.104 | 1.091 |
| FastComet | 2.725 | 3.721 | 1.993 | 2.482 | 1.947 |
| Flywheel | 1.625 | 1.956 | 1.17 | 1.607 | 1.289 |
| GoDaddy | 2.995 | 3.335 | 2.341 | 2.497 | 2.555 |
| GreenGeeks | 1.881 | 1.743 | 1.683 | 1.862 | 1.169 |
| Incendia Web Works | 1.923 | 2.075 | 1.347 | 1.863 | 1.082 |
| Kickassd | 1.896 | 1.626 | 2.053 | 1.913 | 1.189 |
| KnownHost | 1.644 | 1.867 | 1.315 | 1.519 | 1.244 |
| Krystal Hosting | 2.228 | 1.288 | 2.069 | 2.61 | 1.66 |
| Lightning Base LLC | 1.539 | 1.746 | 1.11 | 1.368 | 1.215 |
| SiteGround | 2.066 | 1.907 | 1.44 | 1.807 | 1.301 |
| TVC.Net | 1.246 | 1.635 | 0.994 | 1.277 | 1.231 |
| VersionPress | 2.153 | 1.746 | 1.83 | 2.033 | 1.581 |
| WPX Hosting | 1.648 | 2.876 | 1.355 | 2.632 | 1.245 |
Discussion
While this is a non impacting measurement (doesn't affect top tier or honorable mention status), it does provide some insight into speeds around the world. 1&1 IONOS has the dubious honor here of having the slowest response time in every single geographic location. GoDaddy and FastComet also stand out in a non positive way on the results.
A lot of companies clustered very tightly and with low response times which is a good sign for consumers.
WPPerformanceTester Results
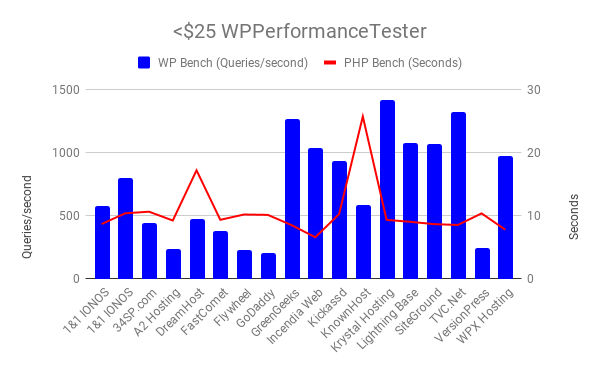
WPPerformanceTester performs two benchmarks. One is a WordPress (WP Bench) and the other a PHP benchmark. WP Bench measures how many WP queries per second and higher tends to be better (varies considerably by architecture). PHP Bench performs a lot of computational and some database operations which are measured in seconds to complete. Lower PHP Bench is better. WP Bench is blue in the chart, PHP Bench is red.
Results Table
| Company Name | PHP Bench | WP Bench |
| 1&1 IONOS (ManagedWP) | 8.712 | 574.3825388 |
| 1&1 IONOS (Shared) | 10.415 | 800.6405124 |
| 34SP.com | 10.671 | 442.282176 |
| A2 Hosting | 9.273 | 240.7897905 |
| DreamHost | 17.234 | 473.0368969 |
| FastComet | 9.385 | 377.3584906 |
| Flywheel | 10.224 | 226.9117313 |
| GoDaddy | 10.169 | 206.9964811 |
| GreenGeeks | 8.541 | 1265.822785 |
| Incendia Web Works | 6.617 | 1040.582726 |
| Kickassd | 10.283 | 933.7068161 |
| KnownHost | 25.774 | 582.7505828 |
| Krystal Hosting | 9.375 | 1422.475107 |
| Lightning Base | 9.067 | 1077.586207 |
| SiteGround | 8.698 | 1070.663812 |
| TVC.Net | 8.566 | 1321.003963 |
| VersionPress | 10.403 | 244.31957 |
| WPX Hosting | 7.801 | 973.7098345 |
Discussion
IWW led the pack on the PHP bench and TVC.net led on the WordPress database benchmark. The only real outlier is DreamHost in the PHP bench did it nearly 7 seconds slower than any other company. Not sure what's going on there.
Qualsys SSL Report Grade
The tool is available at https://www.ssllabs.com/ssltest/
Results Table
| Company Name | Qualys SSL Report |
| 1&1 IONOS (ManagedWP) | A |
| 1&1 IONOS (Shared) | A |
| 34SP.com | A |
| A2 Hosting | A |
| DreamHost | A |
| FastComet | A |
| Flywheel | A |
| GoDaddy | A |
| GreenGeeks | A+ |
| Incendia Web Works | A+ |
| Kickassd | A |
| KnownHost | A |
| Krystal Hosting | A |
| Lightning Base | A |
| SiteGround | A |
| TVC.Net | A |
| VersionPress | A+ |
| WPX Hosting | A |
Discussion
Everyone got an A. GreenGeeks, IWW and VersionPress all got A+. Nice to see everyone is doing SSL properly.
Conclusion

Top Tier
GreenGeeks, LightningBase and WPX Hosting earned Top Tier status this year for handling every single test without any significant issues.
Honorable Mention
SiteGround [Reviews] earned honorable mention status for handling the tests with minor issues that kept them out of the Top Tier but were good enough to warrant extra recognition.
Individual Host Analysis
1&1 IONOS [Reviews] (ManagedWP)
1&1 IONOS Managed WP plan has a lot of room for improvement. The uptime was satisfactory and the WPPerformanceTester was average. What puzzles me is how it performed so much worse than 1&1 IONOS Shared plan on multiple tests including Load Storm.
The bright spot here might be that it beat it's managed WP counterpart in multiple tests. I'm not sure that's really good for the company as a whole though.
34SP.com returned for a second year and put on a very admirable showing. They were on the border of earning an honorable mention, but the Load Impact test had them doubling their response time average. The Load Storm results was impressive with no errors and getting faster response times as the test went on. This was a huge step up from last year and I look forward to seeing them again and it wouldn't surprise in the slightest if they earn an award next time after their impressive performance improvements this year.
Overall, they just missed out an honorable mention consideration. The error rate on Load Storm was 0.57% and had a small response time increase. Everything else looked very good.
DreamHost earned itself a very OK this year. None of the load tests overwhelemed the servers to the point of errors, only response time increases. They seem capable of handling the load, just that it shows quite heavily in the response times. A solid base to continue improving their product on, but not a top tier showing this year.
Another new comer this year. The Load Storm test was a bit much for this plan and it couldn't keep up. They said it was rate limiting among other possible issues, but this is part of the plan as purchased. There may be more underlying performance, but out of the box, this wasn't able to handle it. The uptime was also extremely borderline (99.90%) on both monitors.
Load Storm overwhelmed Flywheel. The Load Impact test had significant response time increases but didn't error out. While their customer service and overall rating may be one of the best, the performance for dollars didn't do that well on our tests at this price tier.
It wasn't a good year for GoDaddy. They couldn't remove/turn off some security measures and the errors showed on Load Storm. Under real world circumstances the performance may actually be there. However, they went down for nearly 20 days and then had a bunch of smaller downtimes in the sub one hour range.
Last year they earned an honorable mention, this year they earned Top Tier status. They had some minor issues last time and improved to having no issues with all of the tests. It's really nice to see some companies continue to improve their offering and having it be reflected in the results. Well done.
Last year IWW earned Top Tier status for it's excellent performance. The performance on the load testing side was there again. An SSL bug caused some downtime which put them below the threshold for earning recognition unfortunately this year. I know they will work hard and probably earn themselves some recognition next year.
Kickassd is in a strange position. I've never had a company get acquired mid-testing. The responsiveness and responsibilities changed dramatically during the transition. I had a lot of difficulty reaching and discussing issues with the new owner. I finished the test, but it didn't have the usual attention it had in years past. The Load Storm test showed some issues, I think it was a security issue but I couldn't work with them to resolve it and get a clean test. Unfortunately, this meant they weren't in consideration for any sort of recognition this year.
Another new entrant to these tests, but a very well known brand with a long history. The Load Storm test was a bit much for Known Host. We isolated the issue down to CPU throttling causing the heaviest page (wp-login) to show the vast majority of the errors. This is expected behavior to ensure fair access for all customers on their plan. But it meant they didn't quite make the cut for any sort of recognition. Overall, KnownHost looks like it may become a strong competitor in the WordPress hosting space in the coming years as the rest of the tests looked solid.
Another first year entry from UK based Krystal Hosting and they nearly earned an honorable mention. Their Load Impact test showed a bit of struggle increasing response times from 800 to 1400ms. It was very borderline, but overall their tests were quite good in all other regards. Happy to see new entrants do so well. I hope they continue to improve and do even better going forward.
A model of consistency in these tests. 99.999/100% uptimes and 0 errors across both load tests. Year after year, Lightning Base earns itself Top Tier status in these tests. Another year, another amazing job.
SiteGround has earned itself another honorable mention this year. The Load Storm test wasn't perfect but was very good. They've earned a lot of recognition at multiple tiers over the past years, they continue to do quite well.
Another new entrant, TVC.net did very well in a lot of the tests. It showed zero errors on both load tests. What held it back was the Load Impact test's response times increased very substantially. Overall, a great performance from a first time entrant. A little more work on the static caching performance and TVC.net will be earning itself awards next year.
VersionPress was yet another first timer. Room for improvement might be the best way to describe the results this year. One of the uptime monitors showed below 99.9%, the load storm test didn't go as well as you would hope and Load Impact started to increase in response times substantially. It's a reminder that these tests aren't easy but I hope to see VersionPress continue to improve. I know in the past companies using VersionPress have struggled on these benchmarks, but if anyone can figure out how to run the VersionPress plugin and get high performance, it's this team.
WPX Hosting has returned to participating (formerly Traffic Planet Hosting) and earned themselves a Top Tier award. Not much to say beyond near perfect (99.99%/100%) and a miniscule 16 errors across both load tests. Nice to have them back and nice to see them put on a spectacular performance after being away for a while.
Kevin Ohashi
Latest posts by Kevin Ohashi (see all)
- Analyzing Digital Ocean’s First Major Move with Cloudways - February 28, 2023
- Removing old companies - June 28, 2021
- WordPress & WooCommerce Hosting Performance Benchmarks 2021 - May 27, 2021

 WordPress & WooCommerce Hosting Performance Benchmarks 2021
 WooCommerce Hosting Performance Benchmarks 2020
 WordPress Hosting Performance Benchmarks (2020)
 The Case for Regulatory Capture at ICANN
 WordPress Hosting – Does Price Give Better Performance?
 Hostinger Review – 0 Stars for Lack of Ethics
 The Sinking of Site5 – Tracking EIG Brands Post Acquisition
 Dirty, Slimy, Shady Secrets of the Web Hosting Review (Under)World – Episode 1
 Free Web Hosting Offers for Startups
Can you bench mark thecloudhost.net against the other providers? I am thinking of moving to them and would like to see how they compare.
I love the spider graph. Is there a way to zoom in?
You can hover on the spider graph and all the raw data is provided in the table as well. If you click a company on the spider graph, you can remove it as well and narrow it down/change the view.
As far as benchmarking companies, they have to opt in. If you know someone there, you can message them and ask them to participate in the future.
Is the GreenGeeks plan reviewed here their ‘Ecosite Pro’?
I had a really terrible experience with them in the past (not service, but quality of hosting), but it was years ago so… worth a try.
It was the Ecosite Pro, yes. I can’t comment on previous experience and only can comment on WP performance which was good.