
The full company list, product list, methodology, and notes can be found here.
This post focuses only on the results of the testing in the $51-100/month price bracket for WordPress Hosting.
Contents
Other Price Tier Results
<$25/Month Tier$25-50/Month Tier$51-100/Month Tier$101-200/Month Tier$201-500/Month Tier$500+/Month (Enterprise) TierHosting Plan Details

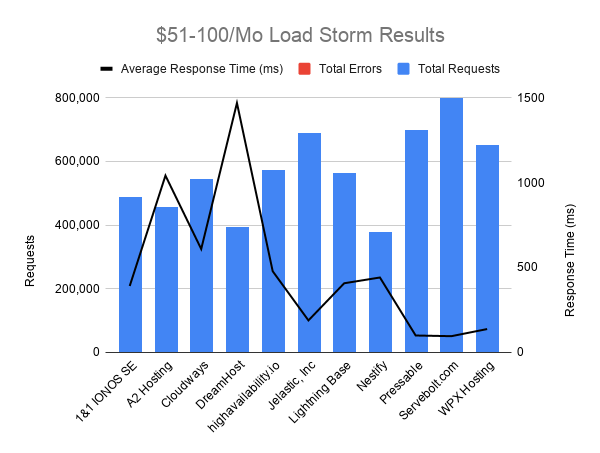
Load Storm Testing Results
Load Storm is designed to simulate real users visiting the site, logging in and browsing. It tests uncached performance.
Results Table
| Company Name | Total Requests | Total Errors | Peak RPS | Average RPS | Peak Response Time(ms) | Average Response Time (ms) | Total Data Transferred (GB) | Peak Throughput (MB/s) |
Average Throughput (MB/s)
|
| 1&1 IONOS SE | 487,409 | 3 (0%) | 353 | 271 | 6,141 | 391.00 | 32.34 | 24 | 18 |
| A2 Hosting | 456,282 | 1,145 (0.25%) | 341 | 253 | 15,113 | 1,042.00 | 23.44 | 18 | 13 |
| Cloudways | 544,009 | 0 (0%) | 404 | 302.23 | 14,085.00 | 609.00 | 32 | 23.97 | 17.58 |
| DreamHost | 394,437 | 0 (0%) | 267 | 219 | 10,116 | 1,470.00 | 21.91 | 15 | 12 |
| highavailability.io | 573,080 | 0 (0%) | 442 | 318 | 4,266 | 478.00 | 31.41 | 25 | 17 |
| Jelastic, Inc | 689,246 | 1,183 (0.17%) | 521 | 383 | 14,074 | 188.00 | 36.80 | 28 | 20 |
| Lightning Base | 564,227 | 7 (0%) | 440 | 313 | 2,283.00 | 407.00 | 34 | 27 | 19 |
| Nestify | 379,415 | 1 (0%) | 310.63 | 210.79 | 15,094.00 | 441 | 22.6 | 18.83 | 13 |
| Pressable | 699,169 | 149 (0.02%) | 566 | 388 | 15,016 | 99.00 | 35.82 | 30 | 20 |
| Servebolt.com | 798,420 | 31 (0%) | 592 | 444 | 15,099 | 95.00 | 28.85 | 22 | 16 |
| WPX Hosting | 652,294 | 72 (0.01%) | 489 | 362 | 3,069.00 | 137.00 | 36 | 27 | 20 |
Full interactive results can be referenced here.
Discussion
1&1 IONOS [Reviews], Cloudways [Reviews], HighAvailability, Jelastic, LightningBase, Nestify, Pressable, Servebolt and WPX Hosting didn't have any issues.
A2 Hosting [Reviews] started slowing down around 1600 users and average response times went up substantially. DreamHost [Reviews] started slowing down around 1300 users but didn't have a single error.
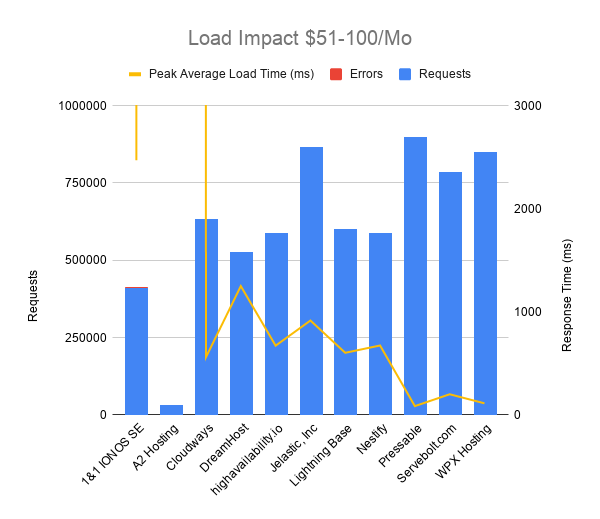
Load Impact Testing Results
Load Impact is designed to test cached performance by repeatedly requesting the homepage.
Results Table
| Company Name | Requests | Errors | Data Transferred (GB) | Peak Average Load Time (ms) | Peak Average Bandwidth (Mbps) | Peak Average Requests/Sec |
| 1&1 IONOS SE | 411084 | 849 | 22.68 | 2470 | 271.27 | 602 |
| A2 Hosting | 30471 | 994 | 1.57 | 48430 | 15.6 | 38 |
| Cloudways | 631710 | 0 | 35.61 | 561 | 577.83 | 1220 |
| DreamHost | 527517 | 0 | 29.41 | 1250 | 420.73 | 921 |
| highavailability.io | 587143 | 0 | 32.07 | 672 | 510.64 | 1110 |
| Jelastic, Inc | 865397 | 7 | 46.82 | 916 | 771.14 | 1700 |
| Lightning Base | 601856 | 0 | 34.16 | 603 | 576.75 | 1210 |
| Nestify | 588944 | 0 | 32.9 | 674 | 494.83 | 1060 |
| Pressable | 898589 | 0 | 50.59 | 86 | 836.94 | 1770 |
| Servebolt.com | 784185 | 4 | 43.41 | 201 | 640.2 | 1410 |
| WPX Hosting | 849983 | 11 | 47.52 | 113 | 787.11 | 1680 |
Full interactive results can be referenced here.
Discussion
Cloudways, High Availability, Jelastic, LightningBase, Nestify, Pressable, Servebolt and WPX Hosting didn't have any issues.
1&1 IONOS slowed down around 1050 users. A2 Hosting collapsed with an average response time spiking to over 48 seconds. DreamHost started slowing down around 1400 users but didn't error out.
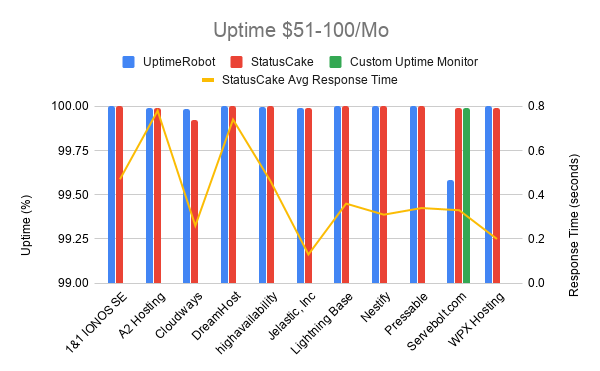
Uptime Monitoring Results
Uptime is monitored by two companies: Uptime Robot and StatusCake. A self hosted monitor was also run in case there was a major discrepancy between the two third party monitors.
Results Table
| Company Name | UptimeRobot | StatusCake | StatusCake Avg Response Time | Custom Uptime Monitor |
| 1&1 IONOS SE | 100 | 100 | 0.47 | |
| A2 Hosting | 99.993 | 99.99 | 0.78 | |
| Cloudways | 99.982 | 99.92 | 0.26 | |
| DreamHost | 100 | 100 | 0.74 | |
| highavailability.io | 99.997 | 100 | 0.46 | |
| Jelastic, Inc | 99.99 | 99.99 | 0.13 | |
| Lightning Base | 100 | 100 | 0.36 | |
| Nestify | 100 | 100 | 0.31 | |
| Pressable | 100 | 100 | 0.34 | |
| Servebolt.com | 99.583 | 99.99 | 0.33 | 99.99 |
| WPX Hosting | 100 | 99.99 | 0.2 |
Discussion
Every company did well maintaining above 99.9% uptime. The only issue was a strange discrepancy between UptimeRobot and StatusCake on Servebolt's uptime. One showed a very low 99.583 and the other 99.99. The third monitor I setup showed 99.99%, so the issue appears to be with Uptime Robot.
WebPageTest.org Results
WebPageTest fully loads the homepage and records how long it takes from 11 different locations around the world.
Results Table
Results table can be referenced here. The radar chart does an excellent job without hiding any information.
Discussion
DreamHost did shockingly well being the fastest in 5/12 locations and the second fastest in 3/12. Servebolt was the fastest in 2 locations and second in 6 more. Jelastic had a confusing performance of being the fastest in 1 location and slowest in 3 and second slowest in an additional 3 more. Nestify didn't stand out in a good way being the slowest in 6/12 locales.
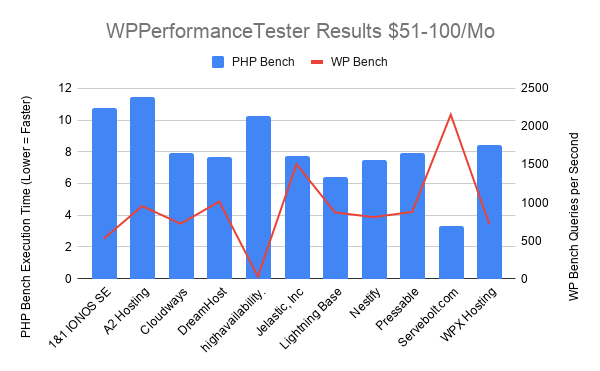
WPPerformanceTester Results
WPPerformanceTester performs two benchmarks. One is a WordPress (WP Bench) and the other a PHP benchmark. WP Bench measures how many WP queries per second and higher tends to be better (varies considerably by architecture). PHP Bench performs a lot of computational and some database operations which are measured in seconds to complete. Lower PHP Bench is better. WP Bench is blue in the chart, PHP Bench is red.
Results Table
| Company Name | PHP Bench | WP Bench |
| 1&1 IONOS SE | 10.755 | 523.5602094 |
| A2 Hosting | 11.458 | 953.2888465 |
| Cloudways | 7.948 | 722.5433526 |
| DreamHost | 7.654 | 1013.171226 |
| highavailability.io | 10.23 | 29.64719834 |
| Jelastic, Inc | 7.715 | 1503.759398 |
| Lightning Base | 6.383 | 871.0801394 |
| Nestify | 7.481 | 808.4074373 |
| Pressable | 7.904 | 877.9631255 |
| Servebolt.com | 3.298 | 2155.172414 |
| WPX Hosting | 8.407 | 713.7758744 |
Discussion
Servebolt stole the show here with completing the PHP bench in nearly half the time of the next fastest competitor. Servebolt also had the fastest WP bench by over 40% and almost two orders of magnitude faster than the slowest WP bench. But both the slowest and fastest WP bench scores were able to handle the load tests without issue showing that different architectures with different trade offs can both perform well.
Qualsys SSL Report Grade
The tool is available at https://www.ssllabs.com/ssltest/
Results Table
| Company Name | Qualys SSL Report |
| 1&1 IONOS SE | A |
| A2 Hosting | A |
| Cloudways | B |
| DreamHost | B |
| highavailability.io | B |
| Jelastic, Inc | A |
| Lightning Base | A |
| Nestify | B |
| Pressable | A |
| Servebolt.com | B |
| WPX Hosting | A |
Discussion
No company scored an A+. Every single B grade was for the following reason according to Qualsys: "This server supports TLS 1.0 and TLS 1.1. Grade capped to B."
Conclusion
Top Tier
Cloudways [Reviews], HighAvailability, Jelastic, LightningBase, Nestify, Pressable, Servebolt and WPX Hosting all earned Top Tier status.
Honorable Mention
None.
Individual Host Analysis
1&1 IONOS [Reviews]
Perfect uptime and an almost perfect Load Storm test were a great start. Unfortunately, the Load Impact test proved to be a bit too much. Hopefully next year improvements in the static caching will let them earn Top Tier status.
A2 Hosting [Reviews]
The good news was A2 Hosting had over 99.99% uptime on both monitors. The bad news is they failed both load tests with response times rising significantly. Not sure what happened this year but hopefully they make some improvements next year and do much better.
Cloudways [Reviews] (Vultr 8GB)
Zero errors on both load tests and no impact on response times, one of only two companies in this price tier that managed to pull off the perfect load tests. Congrats on earning Top Tier status.
DreamHost [Reviews]
DreamHost managed perfect uptime and zero load testing errors. DreamHost also had the fastest average load speed on WebPageTest. The problem was keeping the response times down during load testing, the servers slowed on both tests causing response times to rise substantially. DreamHost manages to do well, but just not well enough, I hope to see them do a little bit better next year and earn some more recognition.
HighAvailability
High Availability managed the perfect load tests with zero errors. Near perfect uptime of 99.997% and 100% cap off a Top Tier performance.
Jelastic
This first time participant put up 99.99% uptime and solid performances on the load test. A Top Tier performance.
LightningBase
Consistency seems to define Lightning Base. Perfect uptime. Only 7 errors total on load testing. For the sixth year in a row across every tier they've participated in, Lightning Base has earned Top Tier status. This year is no exception, consistently excellent performance that doesn't get enough recognition.
Nestify
Perfect uptime. 1 error during the load tests. The only thing I'd like to see improved is the global response times which are a non impacting measurement. Nestify definitely earned their Top Tier status this year. congratulations.
Pressable
Shaky uptime was an issue in the past, but perfect uptime this year shows Pressable has really stepped it up. The load tests went well, especially having the fastest Load Impact response times. It's nice seeing positive improvements leading to Pressable earning Top Tier status again.
Servebolt
Servebolt's second year was kind to them. Their new servers blew away the competition on WPPerformanceTester and it wasn't even close. Servebolt also managed the fastest average response time on Load Storm and the second fastest average response time on WebPageTest. Servebolt is really pushing hard on the speed button and it earned them another Top Tier performance.
WPX Hosting
WPX had near perfect uptime and did excellent on both load tests. It wasn't flashy but they were the third fastest average response on Load Storm and second fastest on Load Impact. A consistently great performance which got them another Top Tier award this year.
Kevin Ohashi
Latest posts by Kevin Ohashi (see all)
- Analyzing Digital Ocean’s First Major Move with Cloudways - February 28, 2023
- Removing old companies - June 28, 2021
- WordPress & WooCommerce Hosting Performance Benchmarks 2021 - May 27, 2021
 WordPress & WooCommerce Hosting Performance Benchmarks 2021
 WooCommerce Hosting Performance Benchmarks 2020
 WordPress Hosting Performance Benchmarks (2020)
 The Case for Regulatory Capture at ICANN
 WordPress Hosting – Does Price Give Better Performance?
 Hostinger Review – 0 Stars for Lack of Ethics
 The Sinking of Site5 – Tracking EIG Brands Post Acquisition
 Dirty, Slimy, Shady Secrets of the Web Hosting Review (Under)World – Episode 1
 Free Web Hosting Offers for Startups