
The full company list, product list, methodology, and notes can be found here.
This post focuses only on the results of the testing in the $25-50/month price bracket for WordPress Hosting.
Contents
Other Price Tier Results
<$25/Month Tier$25-50/Month Tier$51-100/Month Tier$101-200/Month Tier$201-500/Month Tier$500+/Month (Enterprise) TierHosting Plan Details

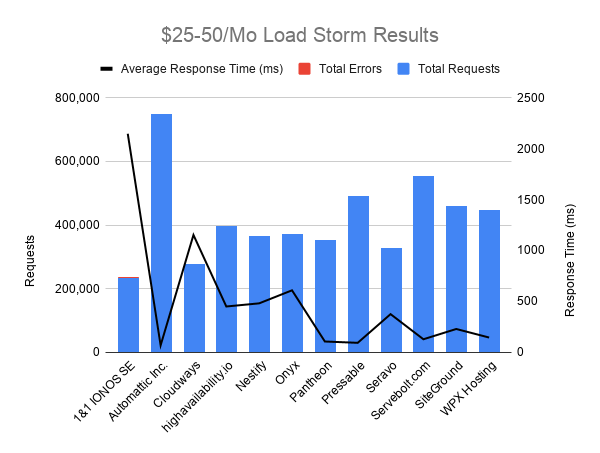
Load Storm Testing Results
Load Storm is designed to simulate real users visiting the site, logging in and browsing. It tests uncached performance.
Results Table
| Company Name | Total Requests | Total Errors | Peak RPS | Average RPS | Peak Response Time(ms) | Average Response Time (ms) | Total Data Transferred (GB) | Peak Throughput (MB/s) |
Average Throughput (MB/s)
|
| 1&1 IONOS SE | 234,689 | 493 (0.21%) | 171 | 130 | 15,285 | 2,148.00 | 16.52 | 11 | 9.179 |
| WordPress.com Business | 748,064 | 14 (0%) | 596 | 416 | 15,064.00 | 68.00 | 32 | 26 | 18 |
| Cloudways | 278,787 | 11 (0%) | 206 | 155 | 15,101 | 1,153.00 | 15.41 | 11 | 8.561 |
| highavailability.io | 395,491 | 18 (0%) | 294 | 220 | 15,006 | 450.00 | 21.63 | 16 | 12 |
| Nestify | 366,719 | 1 (0%) | 280.67 | 203.73 | 15,058.00 | 481 | 22.63 | 17.34 | 13 |
| Onyx | 371,118 | 36 (0.01%) | 282.67 | 206.18 | 13,671 | 609 | 21.84 | 16.71 | 12 |
| Pantheon | 354,355 | 4 (0%) | 296 | 197 | 3,408.00 | 106.00 | 20 | 17 | 11 |
| Pressable | 492,156 | 6 (0%) | 377 | 273.42 | 2,402.00 | 93.00 | 25 | 20 | 14 |
| Seravo | 327,441 | 3 (0%) | 265.35 | 181.91 | 10,035 | 375 | 16.57 | 13.65 | 9.205 |
| Servebolt.com | 554,186 | 49 (0.01%) | 662 | 307.88 | 15,156.00 | 128.00 | 20 | 25.64 | 11.29 |
| SiteGround | 459,967 | 1 (0%) | 339 | 256 | 3,465 | 229.00 | 24.49 | 18 | 14 |
| WPX Hosting | 446,395 | 90 (0.02%) | 334 | 248 | 15,100.00 | 145.00 | 24 | 18 | 14 |
Full interactive results can be referenced here.
Discussion
WordPress.com Business (Automattic), HighAvailability, Nestify, Onyx, Pantheon [Reviews], Pressable, Seravo, Servebolt, SiteGround [Reviews] and WPX Hosting all handled this test without any issues.
1&1 IONOS [Reviews] and Cloudways [Reviews] slowed down but didn't error out.
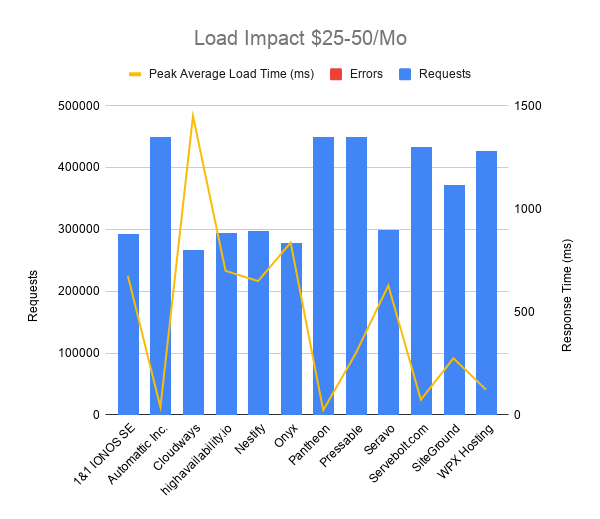
Load Impact Testing Results
Load Impact is designed to test cached performance by repeatedly requesting the homepage.
Results Table
| Company Name | Requests | Errors | Data Transferred (GB) | Peak Average Load Time (ms) | Peak Average Bandwidth (Mbps) | Peak Average Requests/Sec |
| 1&1 IONOS SE | 293129 | 0 | 16.33 | 675 | 261.07 | 572 |
| WordPress.com Business | 448550 | 0 | 29.8 | 38 | 506.48 | 931 |
| Cloudways | 265772 | 25 | 14.98 | 1450 | 192.9 | 418 |
| highavailability.io | 293902 | 0 | 16.04 | 699 | 277.67 | 621 |
| Nestify | 296475 | 0 | 16.55 | 649 | 262.3 | 574 |
| Onyx | 277224 | 0 | 15.7 | 836 | 270.69 | 583 |
| Pantheon | 449874 | 0 | 25.85 | 23 | 380.25 | 808 |
| Pressable | 449760 | 0 | 25.33 | 299 | 436.6 | 946 |
| Seravo | 299282 | 0 | 16.68 | 628 | 281.61 | 619 |
| Servebolt.com | 433336 | 0 | 24.17 | 74 | 407.11 | 891 |
| SiteGround | 370867 | 0 | 20.71 | 275 | 326.51 | 714 |
| WPX Hosting | 427313 | 3 | 24.01 | 123 | 407.96 | 886 |
Full interactive results can be referenced here.
Discussion
1&1 IONOS, WordPress.com Business (Automattic), HighAvailability, Nestify, Onyx, Pantheon, Pressable, Seravo, Servebolt, SiteGround and WPX Hosting all handled this test without issue.
Cloudways slowed down and had peak average response time climb to almost 1.5s.
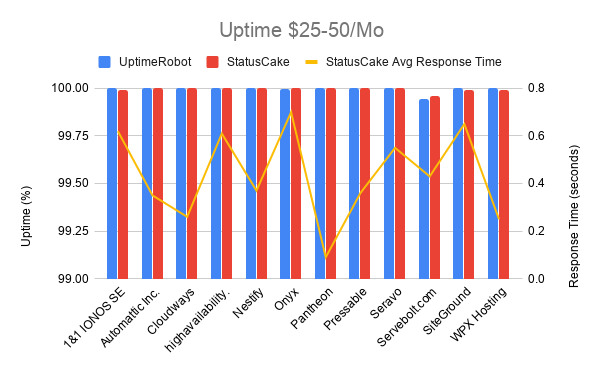
Uptime Monitoring Results
Uptime is monitored by two companies: Uptime Robot and StatusCake. A self hosted monitor was also run in case there was a major discrepancy between the two third party monitors.
Results Table
| Company Name | UptimeRobot | StatusCake | StatusCake Avg Response Time |
| 1&1 IONOS SE | 99.999 | 99.99 | 0.62 |
| WordPress.com Business | 100 | 100 | 0.35 |
| Cloudways | 100 | 100 | 0.26 |
| highavailability.io | 100 | 100 | 0.61 |
| Nestify | 100 | 100 | 0.37 |
| Onyx | 99.998 | 100 | 0.7 |
| Pantheon | 100 | 100 | 0.09 |
| Pressable | 100 | 100 | 0.36 |
| Seravo | 100 | 100 | 0.55 |
| Servebolt.com | 99.946 | 99.96 | 0.43 |
| SiteGround | 100 | 99.99 | 0.65 |
| WPX Hosting | 100 | 99.99 | 0.25 |
Discussion
Everyone maintained uptime above 99.9% including with 11/12 keeping 99.99% or higher.
WebPageTest.org Results
WebPageTest fully loads the homepage and records how long it takes from 11 different locations around the world.
Results Table
Results table can be referenced here. The radar chart does an excellent job without hiding any information.
Discussion
1&1 IONOS and Nestify stand out as the two slowest around the globe being first or second in 8/12 locales together. Onyx, the UK based company, was the fastest in London and Frankfurt, which is nice to see that geography seems to make an impact. Servebolt picked up the fastest average response time at just under a second average across the 12 locales.
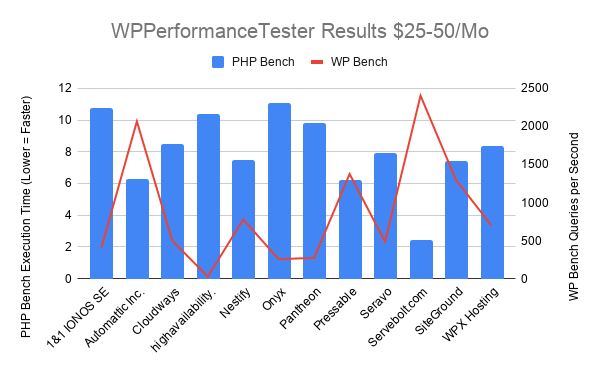
WPPerformanceTester Results
WPPerformanceTester performs two benchmarks. One is a WordPress (WP Bench) and the other a PHP benchmark. WP Bench measures how many WP queries per second and higher tends to be better (varies considerably by architecture). PHP Bench performs a lot of computational and some database operations which are measured in seconds to complete. Lower PHP Bench is better. WP Bench is blue in the chart, PHP Bench is red.
Results Table
| Company Name | PHP Bench | WP Bench |
| 1&1 IONOS SE | 10.774 | 407.3319756 |
| WordPress.com Business | 6.255 | 2066.115702 |
| Cloudways | 8.486 | 498.2561036 |
| highavailability.io | 10.392 | 27.53910553 |
| Nestify | 7.486 | 777.6049767 |
| Onyx | 11.083 | 257.003341 |
| Pantheon | 9.793 | 273.5978112 |
| Pressable | 6.217 | 1375.515818 |
| Seravo | 7.926 | 485.2013586 |
| Servebolt.com | 2.436 | 2403.846154 |
| SiteGround | 7.425 | 1297.016861 |
| WPX Hosting | 8.389 | 699.3006993 |
Discussion
The clear standout here is Servebolt with some of the fastest times I've ever seen. WordPress.com Business isn't too far back with both of them breaking them 2000 mark on WP bench (which is more than double WordPress.com Business' score last year). The highest score in any tier last year was in 1700 range (from Servebolt and High Availability[under old IWW brand]), so this is a drastic improvement.
Qualsys SSL Report Grade
The tool is available at https://www.ssllabs.com/ssltest/
Results Table
| Company Name | Qualys SSL Report |
| 1&1 IONOS SE | A |
| WordPress.com Business | A |
| Cloudways | B |
| highavailability.io | B |
| Nestify | B |
| Onyx | A |
| Pantheon | A+ |
| Pressable | A |
| Seravo | B |
| Servebolt.com | B |
| SiteGround | A |
| WPX Hosting | A |
Discussion
Pantheon is the only company that achieved an A+ rating. Every single B grade was for the following reason according to Qualsys: "This server supports TLS 1.0 and TLS 1.1. Grade capped to B."
Conclusion
Top Tier
HighAvailability, Nestify, Onyx, Pantheon [Reviews], Pressable, Seravo, Servebolt, SiteGround [Reviews], WordPress.com Business, and WPX Hosting all handled the tests effortlessly and earned Top Tier honors.
Honorable Mention
None.
Individual Host Analysis
1&1 IONOS [Reviews]
1&1 IONOS overall had a much stronger showing here than in the tier below. The server didn't error out on any tests. It kept excellent uptime. The only issue was Load Storm seemed to slow down the server to over 2s average load times which kept it out of earning any recognition.
Cloudways [Reviews] (Vultr 4GB)
Cloudways had perfect uptime on both monitors which was good. The problem was the load tests caused the server to slow down and have high response times.
HighAvailability
100% uptime is really nice to see. 0 Load Impact errors and a miniscule 18 errors on Load Storm wrap up an overall excellent performance, well deserving of Top Tier honors.
Nestify
A whopping 1 error across both load tests with perfect uptime easily earned Nestify Top Tier status this year.
Onyx
This UK brand (owned by Krystal Hosting) earned itself their first Top Tier honors ever. Dedicated to Managed WordPress Hosting, the new offering really showed off well with near perfect uptime of 100 and 99.998%. It was also the fastest in London and Frankfurt on WebPageTest.
Pantheon [Reviews]
Pantheon has historically done very well in these tests and this year was no exception. Perfect uptime. The absolute fastest Load Impact response time at a blazing 23ms. They were also the fastest on WebPageTest from 4/12 locales. A Top Tier performance without question.
Pressable
Perfect uptime. The second fastest average response time on Load Storm (only beat by WordPress.com Business which are both owned by Automattic). Pressable also had the second fastest PHP bench score. Well deserved on another Top Tier performance this year.
Seravo
The only truly new entrant in this price tier put on excellent showing with perfect uptime, zero errors on Load Impact and only three errors on Load Storm. Nice to see new entrant do so spectacularly and earn Top Tier status.
Servebolt
The second year for Servebolt has treated them well. They haven't missed a beat with near perfect load tests. They stood out the most on the WPPerformanceTester benchmark where they blew away the numbers from last year. Top Tier performance again.
SiteGround [Reviews]
Near perfect uptime. A total of one error on both load tests. It wasn't flashy in any of the results but it handled all the tests gracefully and earned another Top Tier mark this year.
WordPress.com Business
The other Automattic brand. It appears there may be some similarities in infrastructure with sister brand Pressable. They had similar PHP bench scores which were very fast. They also shared perfect uptime. An excellent brand to be sharing a lot in common with. WordPress.com Business stood out in having the fastest average response on Load Storm and the second fastest on Load Impact. They also had the second fastest WP bench score. Another year, another Top Tier performance well earned.
WPX Hosting
WPX Hosting had 100/99.99% uptime marks. Their average response times on both load tests was in the snappy 100ms range. WPX earned themselves Top Tier honors again this year.
Kevin Ohashi
Latest posts by Kevin Ohashi (see all)
- Analyzing Digital Ocean’s First Major Move with Cloudways - February 28, 2023
- Removing old companies - June 28, 2021
- WordPress & WooCommerce Hosting Performance Benchmarks 2021 - May 27, 2021
 WordPress & WooCommerce Hosting Performance Benchmarks 2021
 WooCommerce Hosting Performance Benchmarks 2020
 WordPress Hosting Performance Benchmarks (2020)
 The Case for Regulatory Capture at ICANN
 WordPress Hosting – Does Price Give Better Performance?
 Hostinger Review – 0 Stars for Lack of Ethics
 The Sinking of Site5 – Tracking EIG Brands Post Acquisition
 Dirty, Slimy, Shady Secrets of the Web Hosting Review (Under)World – Episode 1
 Free Web Hosting Offers for Startups