
The full company list, product list, methodology, and notes can be found here.
This post focuses only on the results of the testing in the $101-200/month price bracket for WordPress Hosting.
Contents
Other Price Tier Results
<$25/Month Tier$25-50/Month Tier$51-100/Month Tier$101-200/Month Tier$201-500/Month Tier$500+/Month (Enterprise) TierHosting Plan Details

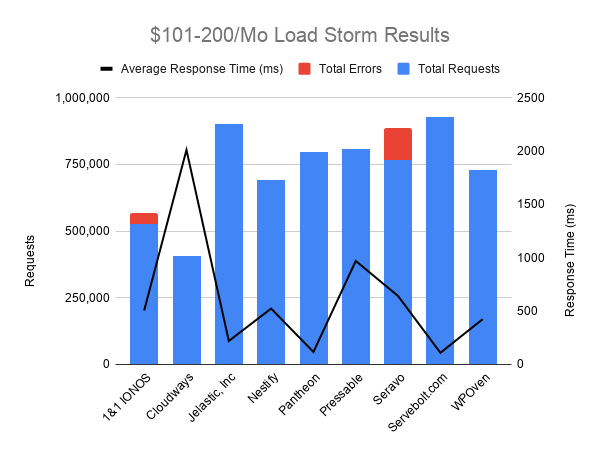
Load Storm Testing Results
Load Storm is designed to simulate real users visiting the site, logging in and browsing. It tests uncached performance.
Results Table
| Company Name | Total Requests | Total Errors | Peak RPS | Average RPS | Peak Response Time(ms) | Average Response Time (ms) | Total Data Transferred (GB) | Peak Throughput (MB/s) |
Average Throughput (MB/s)
|
| 1&1 IONOS | 524,757 | 41,655 (7.94%) | 380 | 292 | 15,593 | 505.00 | 23.53 | 17 | 13 |
| Cloudways | 405,655 | 0 (0%) | 282 | 225.36 | 13,206.00 | 2,012.00 | 21 | 14 | 12 |
| Jelastic, Inc | 900,234 | 1,030 (0.11%) | 693 | 500 | 14,609 | 219.00 | 48.21 | 37 | 27 |
| Nestify | 692,645 | 1(0%) | 540 | 385 | 15,054 | 523.00 | 42.65 | 34 | 24 |
| Pantheon | 794,976 | 132 (0.02%) | 621 | 442 | 15,102.00 | 116.00 | 45 | 36 | 25 |
| Pressable | 809,307 | 0(0%) | 587 | 450 | 12,354 | 970.00 | 41.58 | 30 | 23 |
| Seravo | 765,043 | 121,572 (15.89%) | 531 | 425 | 5,029 | 641.00 | 34.33 | 23 | 19 |
| Servebolt.com | 926,739 | 1,038 (0.11%) | 879 | 515 | 15,100 | 108.00 | 33.93 | 33 | 19 |
| WPOven | 728,369 | 94 (0.01%) | 577 | 405 | 15,100.00 | 424.00 | 42 | 34 | 24 |
Full interactive results can be referenced here.
Discussion
Jelastic, Nestify, Pantheon [Reviews], Servebolt and WPOven all handled the Load Storm test without issue.
1&1 IONOS [Reviews] may have run into some security issues which couldn't be turned off with a stable response time but high error rate.
Cloudways [Reviews] slowed down substantially with average response time going over 2000ms.
Pressable started to slow down with average response times rising from 500ms to 1100ms.
Seravo ran into an issue with docker proxy that couldn't be resolved which caused a high error rate.
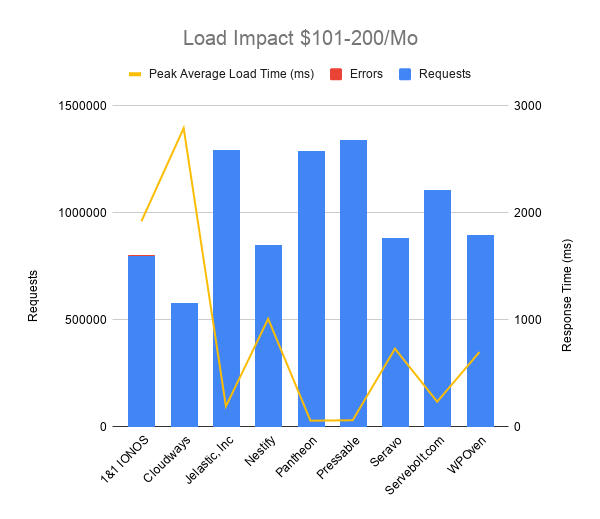
Load Impact Testing Results
Load Impact is designed to test cached performance by repeatedly requesting the homepage.
Results Table
| Company Name | Requests | Errors | Data Transferred (GB) | Peak Average Load Time (ms) | Peak Average Bandwidth (Mbps) | Peak Average Requests/Sec |
| 1&1 IONOS | 796414 | 5000+ | 3.45 | 1920 | 35.62 | 1640 |
| Cloudways | 578617 | 0 | 32.62 | 2790 | 378.37 | 820 |
| Jelastic, Inc | 1293290 | 9 | 69.97 | 193 | 1022 | 2260 |
| Nestify | 851045 | 0 | 47.54 | 1010 | 730.67 | 1560 |
| Pantheon | 1289653 | 1 | 74.76 | 59 | 1180 | 2480 |
| Pressable | 1337047 | 0 | 75.3 | 63 | 1590 | 3460 |
| Seravo | 881714 | 148 | 48.89 | 731 | 789.96 | 1750 |
| Servebolt.com | 1104070 | 5 | 61.12 | 236 | 913.11 | 1970 |
| WPOven | 895233 | 0 | 49.85 | 700 | 814.52 | 1740 |
Full interactive results can be referenced here.
Discussion
Jelastic, Pantheon, Pressable, Seravo, Servebolt and WPOven didn't experience any issues with the Load Impact test.
1&1 IONOS ran into security measures again and experienced a lot of errors.
Cloudways experienced some stress and response times increased substantially starting around 1200 users.
Nestify started experiencing load around 2500 and increased slightly to 1s average response time.
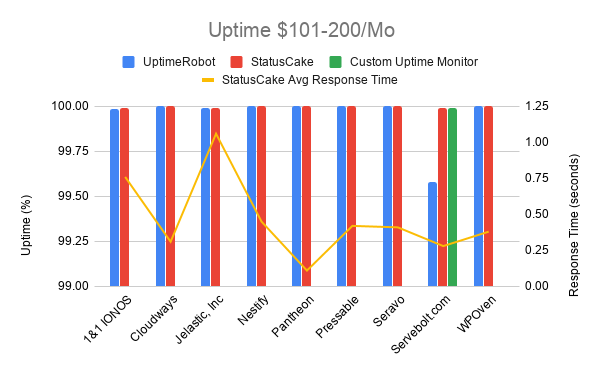
Uptime Monitoring Results
Uptime is monitored by two companies: Uptime Robot and StatusCake. A self hosted monitor was also run in case there was a major discrepancy between the two third party monitors.
Results Table
| Company Name | UptimeRobot | StatusCake | StatusCake Avg Response Time | Custom Uptime Monitor |
| 1&1 IONOS | 99.986 | 99.99 | 0.76 | |
| Cloudways | 100 | 100 | 0.31 | |
| Jelastic, Inc | 99.99 | 99.99 | 1.06 | |
| Nestify | 100 | 100 | 0.45 | |
| Pantheon | 100 | 100 | 0.11 | |
| Pressable | 100 | 100 | 0.42 | |
| Seravo | 100 | 100 | 0.41 | |
| Servebolt.com | 99.582 | 99.99 | 0.28 | 99.99 |
| WPOven | 100 | 100 | 0.38 |
Discussion
Every company did well maintaining above 99.98% uptime. The only issue was a strange discrepancy between UptimeRobot and StatusCake on Servebolt's uptime. One showed a very low 99.582 and the other 99.99. The third monitor I setup showed 99.99%, so the issue appears to be with Uptime Robot.
WebPageTest.org Results
WebPageTest fully loads the homepage and records how long it takes from 11 different locations around the world.
Results Table
Results table can be referenced here. The radar chart does an excellent job without hiding any information.
Discussion
Pantheon picked up the fastest response times in 5/12 locations. Servebolt ended up being the fastest in only two locations but had the fastest average overall being near the fastest in most locaations. Nestify didn't stand out well here being slowest in 6/12 locales and second slowest in 5/12. Jelastic was the slowest in 5 locations, second slowest in 2 locations and the fastest in 3 locations.
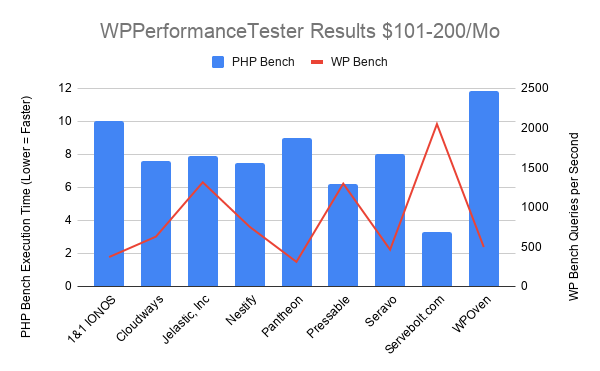
WPPerformanceTester Results
WPPerformanceTester performs two benchmarks. One is a WordPress (WP Bench) and the other a PHP benchmark. WP Bench measures how many WP queries per second and higher tends to be better (varies considerably by architecture). PHP Bench performs a lot of computational and some database operations which are measured in seconds to complete. Lower PHP Bench is better. WP Bench is blue in the chart, PHP Bench is red.
Results Table
| Company Name | PHP Bench | WP Bench |
| 1&1 IONOS | 10.029 | 370.5075954 |
| Cloudways | 7.605 | 628.1407035 |
| Jelastic, Inc | 7.888 | 1314.060447 |
| Nestify | 7.487 | 753.0120482 |
| Pantheon | 8.996 | 309.8853424 |
| Pressable | 6.213 | 1297.016861 |
| Seravo | 8.029 | 463.6068614 |
| Servebolt.com | 3.275 | 2049.180328 |
| WPOven | 11.831 | 497.2650423 |
Discussion
Servebolt blew away the competition on this test recording near 50% faster scores on both PHP bench and WP bench than the next fastest competitors. The competition wasn't slow either, Pressable's PHP bench was a near 50% improvement over their own score last year too.
Qualsys SSL Report Grade
The tool is available at https://www.ssllabs.com/ssltest/
Results Table
| Company Name | Qualys SSL Report |
| 1&1 IONOS | B |
| Cloudways | B |
| Jelastic, Inc | A |
| Nestify | B |
| Pantheon | A |
| Pressable | A |
| Seravo | B |
| Servebolt.com | B |
| WPOven | B |
Discussion
No company achieved an A+ rating. Every single B grade was for the following reason according to Qualsys: "This server supports TLS 1.0 and TLS 1.1. Grade capped to B."
Conclusion
Top Tier
Jelastic, Pantheon [Reviews], Servebolt and WPOven all earned Top Tier status this year. They didn't struggle at any point during this testing.
Honorable Mention
Nestify and Pressable earned Honorable Mentions because they had some minor slowdowns during Load Impact and Load Storm respectively.
Individual Host Analysis
1&1 IONOS [Reviews]
1&1 IONOS was marred by security measures that couldn't be worked around. Their uptime was solid, but the load tests just had too many errors which seemed like were triggered by security features because response times were remaining flat.
Cloudways [Reviews] (AWS Large)
Perfect uptime. Zero errors on load tests was nice. But the response times just increased too much to be win any recognition.
Jelastic
99.99% uptime on both monitors. Minimal errors on the load tests. Jelastic earned a top tier performance.
Nestify
Nestify's perfect uptime was a great start. 1 error total between both load tests. The only issue was the response times increased around 2500 users on Load Impact to over 1000ms which meant Nestify earned Honorable Mention status.
Pantheon [Reviews]
100% uptime. Effortless load test results including the fastest Load Impact average response time. Often the fastest response times on WebPageTest with the second fastest average load time overall. A solid showing earned Pantheon Top Tier status.
Pressable
Perfect uptime. Incredibly fast Load Impact results with zero errors and second fastest peak average load time. The only thing that kept Pressable from earning Top Tier status was Load Storm slowing down responses from 500ms to 1100ms during the test. Honorable Mention well earned.
Seravo
Perfect uptime. Solid Load Impact result. The downfall was a docker proxy bug which kept popping up and causing a lot of errors on Load Storm.
Servebolt
Servebolt prides themselves on speed. They were blazingly fast on WPPerformanceTester. They had the fastest average response time on WebPageTest. They had the fastest Load Storm average response time. Top Tier honors were easily awarded to Servebolt.
WPOven
A relatively unknown provider which intermittently participates in these benchmarks. Each time they seem to do quite well earning Top Tier honors for the third time in a row this year. Perfect uptime and excellent load tests will do that. Well done and welcome back WPOven.
Kevin Ohashi
Latest posts by Kevin Ohashi (see all)
- Analyzing Digital Ocean’s First Major Move with Cloudways - February 28, 2023
- Removing old companies - June 28, 2021
- WordPress & WooCommerce Hosting Performance Benchmarks 2021 - May 27, 2021
 WordPress & WooCommerce Hosting Performance Benchmarks 2021
 WooCommerce Hosting Performance Benchmarks 2020
 WordPress Hosting Performance Benchmarks (2020)
 The Case for Regulatory Capture at ICANN
 WordPress Hosting – Does Price Give Better Performance?
 Hostinger Review – 0 Stars for Lack of Ethics
 The Sinking of Site5 – Tracking EIG Brands Post Acquisition
 Dirty, Slimy, Shady Secrets of the Web Hosting Review (Under)World – Episode 1
 Free Web Hosting Offers for Startups
No Kinsta or WP Engine?
They didn’t choose to participate this year. WPEngine didn’t participate the year before either. Kinsta was in the middle of upgrading their platform and didn’t want the old one tested. I hope to see them next year.