
The full company list, product list, methodology, and notes can be found here.
This post focuses only on the results of the testing in the $201-500/month price bracket for WordPress Hosting.
Contents
Other Price Tier Results
<$25/Month Tier$25-50/Month Tier$51-100/Month Tier$101-200/Month Tier$201-500/Month Tier$500+/Month (Enterprise) TierHosting Plan Details

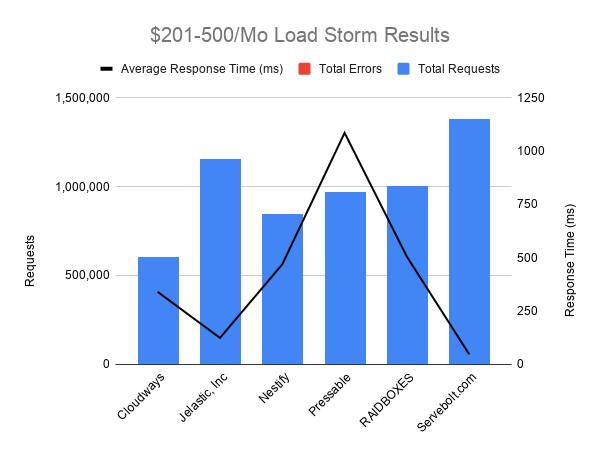
Load Storm Testing Results
Load Storm is designed to simulate real users visiting the site, logging in and browsing. It tests uncached performance.
Results Table
| Company Name | Total Requests | Total Errors | Peak RPS | Average RPS | Peak Response Time(ms) | Average Response Time (ms) | Total Data Transferred (GB) | Peak Throughput (MB/s) |
Average Throughput (MB/s)
|
| Cloudways | 606,481 | 0 (0%) | 521 | 336.93 | 3,760.00 | 340.00 | 35 | 30 | 19 |
| Jelastic, Inc | 1,153,090 | 928 (0.08%) | 900 | 641 | 15,315 | 124.00 | 61.27 | 48 | 34 |
| Nestify | 848,046 | 0 (0%) | 668.7 | 471.14 | 4,214.00 | 469 | 52.14 | 41.48 | 29 |
| Pressable | 972,232 | 22 (0%) | 708 | 540 | 12,405 | 1,086.00 | 49.91 | 37 | 28 |
| RAIDBOXES | 1,003,451 | 0 (0%) | 773.97 | 557.47 | 10,728 | 505 | 53.05 | 41.11 | 29.47 |
| Servebolt.com | 1,381,129 | 42 (0%) | 1,090 | 767 | 15,099 | 47.00 | 50.95 | 40 | 28 |
Full interactive results can be referenced here.
Discussion
Cloudways [Reviews], Jelastic, Nestify, Raidboxes and Servebolt all handled this test without issue.
Pressable saw a slight increase in response times from 500 to 1200ms.
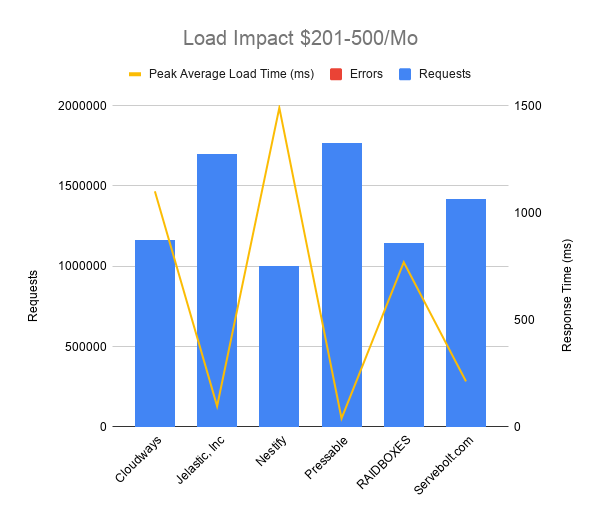
Load Impact Testing Results
Load Impact is designed to test cached performance by repeatedly requesting the homepage.
Results Table
| Company Name | Requests | Errors | Data Transferred (GB) | Peak Average Load Time (ms) | Peak Average Bandwidth (Mbps) | Peak Average Requests/Sec |
| Cloudways | 1162068 | 15 | 65.5 | 1100 | 959.03 | 2030 |
| Jelastic, Inc | 1696819 | 7 | 91.81 | 97 | 1310 | 2950 |
| Nestify | 1003582 | 0 | 56.07 | 1490 | 731.14 | 1560 |
| Pressable | 1768926 | 0 | 99.61 | 40 | 1460 | 3170 |
| RAIDBOXES | 1142240 | 0 | 63.19 | 769 | 1010 | 2240 |
| Servebolt.com | 1420760 | 0 | 77.36 | 213 | 1070 | 2400 |
Full interactive results can be referenced here.
Discussion
Jelastic, Pressable, Raidboxes and Servebolt all handled the Load Impact test without issue.
Cloudways started to slow down around 3250 users and peak average response time increased to 1100.
Nestify started to slow down around 2500 users and peak average response time went to almost 1500ms.
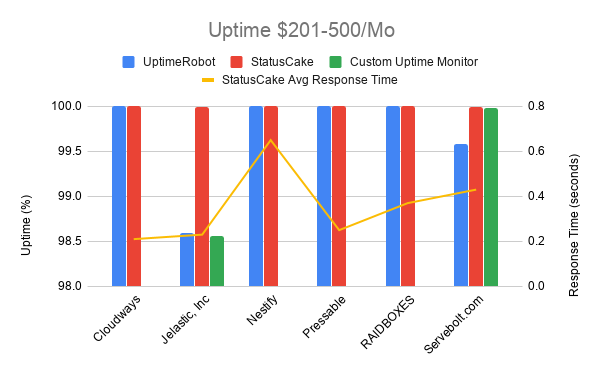
Uptime Monitoring Results
Uptime is monitored by two companies: Uptime Robot and StatusCake. A self hosted monitor was also run in case there was a major discrepancy between the two third party monitors.
Results Table
| Company Name | UptimeRobot | StatusCake | StatusCake Avg Response Time | Custom Uptime Monitor |
| Cloudways | 100 | 100 | 0.21 | |
| Jelastic, Inc | 98.587 | 99.99 | 0.23 | 98.56 |
| Nestify | 100 | 100 | 0.65 | |
| Pressable | 100 | 100 | 0.25 | |
| RAIDBOXES | 99.999 | 100 | 0.37 | |
| Servebolt.com | 99.583 | 99.99 | 0.43 | 99.98 |
Discussion
Cloudways, Nestify, Pressable, and Raidboxes had perfect or 99.999% uptime.
Jelastic had very different uptimes based on the monitors with UptimeRobot showing 98.587% and StatusCake showing 99.99%. The third monitor showed 98.56% which was inline with UptimeRobot, so I went with that being correct.
Servebolt also had a discrepancy between UptimeRobot and StatusCake uptime. One showed a very low 99.583 and the other 99.99. The third monitor I setup showed 99.98%, so I went with the StatusCake number.
WebPageTest.org Results
WebPageTest fully loads the homepage and records how long it takes from 11 different locations around the world.
Results Table
Results table can be referenced here. The radar chart does an excellent job without hiding any information.
Discussion
Servebolt was the fastest in 7/12 locations and had the fastest average response time. Jelastic was the slowest in 7/12 and fastest in 1. Nestify was the slowest in 5/12.
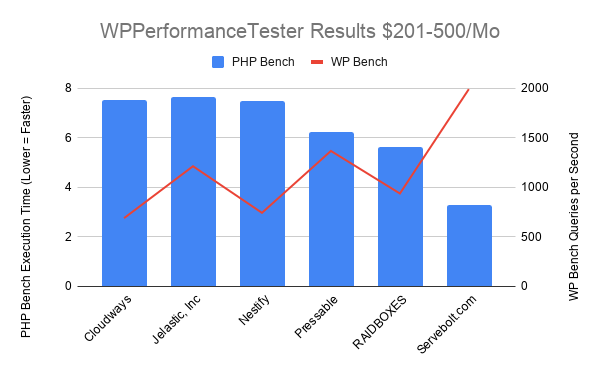
WPPerformanceTester Results
WPPerformanceTester performs two benchmarks. One is a WordPress (WP Bench) and the other a PHP benchmark. WP Bench measures how many WP queries per second and higher tends to be better (varies considerably by architecture). PHP Bench performs a lot of computational and some database operations which are measured in seconds to complete. Lower PHP Bench is better. WP Bench is blue in the chart, PHP Bench is red.
Results Table
| Company Name | PHP Bench | WP Bench |
| Cloudways | 7.538 | 689.1798759 |
| Jelastic, Inc | 7.649 | 1213.592233 |
| Nestify | 7.486 | 742.9420505 |
| Pressable | 6.215 | 1367.989056 |
| RAIDBOXES | 5.644 | 938.0863039 |
| Servebolt.com | 3.281 | 1992.031873 |
Discussion
The speed on this test was impressive. Servebolt was clearly the fastest on both tests but the numbers were an astonishing improvement over last year. The second fastest score last year on PHP Bench was 9.388 and the slowest this year was 7.649, nearly a two second improvement. Some of this could be because there are a different mix of companies but three of them are the same. Servebolt got faster by ~500ms and ~500 queries per second. Pressable improved by 4000ms and 900 queries per second. Cloudways improved by 1900ms and 260 queries per second. It's nice to see continuous improvements being made across the board.
Qualsys SSL Report Grade
The tool is available at https://www.ssllabs.com/ssltest/
Results Table
| Company Name | Qualys SSL Report |
| Cloudways | B |
| Jelastic, Inc | A |
| Nestify | B |
| Pressable | A |
| RAIDBOXES | A+ |
| Servebolt.com | B |
Discussion
Raidboxes was the only company to achieve an A+ rating. Every single B grade was for the following reason according to Qualsys: "This server supports TLS 1.0 and TLS 1.1. Grade capped to B."
Conclusion
Top Tier
Raidboxes and Servebolt stood out and earned Top Tier honors. Both companies handled these tests effortlessly.
Honorable Mention
Cloudways [Reviews] earned an Honorable Mention because they had a minor slow down towards the end of the Load Impact test.
Individual Host Analysis
Cloudways [Reviews] (AWS - 2XL)
Overall a very good performance from Cloudways. Perfect uptime. Improved speeds from last years WPPerformanceTester results. Just a minor slow down during Load Impact kept them from earning Top Tier honors.
Jelastic
Excellent performance from this new comer except for the uptime issue. They didn't have this issue in other tiers, so I am optimistic next year they will earn Top Tier status.
Nestify
Nestify had perfect uptime. A perfect looking Load Storm test with zero errors and flat response times. The only issue was Load Impact slowed down starting around 2300 users and kept climbing upwards to around 1.5s average response time. Very borderline on earning an Honorable Mention, just a bit better next year will earn some them recognition.
Pressable
Pressable had perfect uptime and Load Impact test. In fact, they had the fastest peak average response time of any company in this price tier. The only issue was Load Storm caused some increased response times with it slowly climbing to over 1300ms at points. It was borderline on the honorable mention, but the response times went a bit too high. A little better and Pressable would be earning honors at this tier.
Raidboxes
One of the standout new entrants this year earned Top Tier status right off the bat. 99.999% uptime and up. Zero errors on both load tests. Hard to ask for a better performance, but they also had the fastest PHP bench score of a company not named Servebolt across any price tier. Well done Raidboxes and congrats on the Top Tier marks.
Servebolt
Speed, speed, speed. Servebolt had the fastest response times on Load Storm and WebPageTest. They also were in a class of their own on WPPerformanceTester. The Top Tier status was well deserved for Servebolt.
Kevin Ohashi
Latest posts by Kevin Ohashi (see all)
- Analyzing Digital Ocean’s First Major Move with Cloudways - February 28, 2023
- Removing old companies - June 28, 2021
- WordPress & WooCommerce Hosting Performance Benchmarks 2021 - May 27, 2021
 WordPress & WooCommerce Hosting Performance Benchmarks 2021
 WooCommerce Hosting Performance Benchmarks 2020
 WordPress Hosting Performance Benchmarks (2020)
 The Case for Regulatory Capture at ICANN
 WordPress Hosting – Does Price Give Better Performance?
 Hostinger Review – 0 Stars for Lack of Ethics
 The Sinking of Site5 – Tracking EIG Brands Post Acquisition
 Dirty, Slimy, Shady Secrets of the Web Hosting Review (Under)World – Episode 1
 Free Web Hosting Offers for Startups