Category Archives: Web Hosting

goodbye hostingreviews

Goodbye HostingReviews.io, I Will Miss You

It's strange writing a positive article about a competitor. This industry is so full of shit, that it feels weird to be writing this. But if we don't recognize the good as well as the bad, what's the point?

In order to bring you more accurate web hosting reviews, HostingReviews.io is now merged with HostingFacts.com and soon to be redirected to HostingFacts.com
-HostingReviews.io popup notice

HostingReviews.io was a project created by Steven Gliebe. It was basically a manually done version of Review Signal. He went through by hand categorizing tweets and displaying data about hosting company. Besides the automated vs manual approach, the only other big difference was he didn't use affiliate links. It was bought out by HostingFacts.com last year sometime and left alone.

I'm truly saddened because it's disappearing at some point 'soon.' The only real competitor whose data I trusted to compare myself against. So I thought I would take the opportunity to write about my favorite competitor.

I am consciously not linking to either in this article because HostingFacts.com, who purchased HostingReviews.io, has HostGator listed as their #1 host in 2017 who are rated terribly by both Review Signal (42%) and HostingReviews.io (9%). So whatever their methodology purports to be, it's so drastically out of line with the data Steven and I have meticulously collected for years that I don't trust it one bit. Not to mention their misleading and bizarre rankings showing BlueHost #4 and in the footer recommending A Small Orange as the #4 rated company. In their actual review, they recommend A Small Orange, I guess they missed The Rise and Fall of A Small Orange and the fact that HostingReviews.io (March 2017) has ASO at 27%.

It would be easy to be upset that someone copied the same idea, but the reality is, it's quite helpful. Steven is a completely different person, with different interests, values and techniques. He also didn't put any affiliate links which many people believe are inherently corrupt. But our results for the most part, were very much the same. So the whole idea that affiliate links corrupts Review Signal rankings, I could pretty confidently throw out the door.

I just want to clarify that I had actually built most of the site before seeing Review Signal. I probably wouldn't have started if I knew about yours first. We came up with the same idea independently. They are similar but nothing was copied. I was a bit disappointed to find out that I wasn't first but later happy, after chatting with you and seeing that we were kind of the Two Musketeers of web hosting reviews.

- Steven Gliebe

I decided to actually look at how close we really were using old archive.org data from Jan 2015 when his site was still being actively updated a lot.

Comparing HostingReviews.io vs Review Signal Ratings (Jan 2015). I've only included companies that both sites covered for comparison's sake.

Company HR Rating Review Signal Rating Rating Difference HR Rank RS Rank Rank Difference
Flywheel 97 93 -4 1 1 0
Pagely 81 56 -25 2 18 -16
SiteGround 79 74 -5 3 4 -1
WiredTree 75 67 -8 4 12 -8
A Small Orange 74 77 3 5 2 3
Linode 72 74 2 6 5 1
WP Engine 72 74 2 7 6 1
LiquidWeb 70 70 0 8 8 0
DigitalOcean 66 75 9 9 3 6
MidPhase 61 59 -2 10 16 -6
HostDime 60 60 0 11 14 -3
Servint 59 60 1 12 15 -3
Amazon Web Services 55 67 12 13 13 0
SoftLayer 50 70 20 14 9 5
DreamHost 49 55 6 15 19 -4
Synthesis 47 74 27 16 7 9
Microsoft Azure 43 70 27 17 10 7
InMotion Hosting 43 52 9 18 20 -2
WestHost 43 51 8 19 21 -2
Rackspace 40 69 29 20 11 9
Media Temple 35 58 23 21 17 4
GoDaddy 30 45 15 22 25 -3
HostMonster 25 42 17 23 29 -6
Bluehost 22 46 24 24 24 0
Just Host 22 39 17 25 30 -5
Netfirms 21 44 23 26 26 0
Hostway 18 44 26 27 27 0
iPage 16 44 28 28 28 0
HostGator 13 49 36 29 22 7
Lunarpages 11 49 38 30 23 7
Mochahost 10 20 10 31 34 -3
1&1 6 36 30 32 32 0
Verio 5 35 30 33 33 0
IX Web Hosting 0 38 38 34 31 3

The biggest difference is Pagely. I'm not sure why we're so different, but it could be a few factors: small sample size (HR had 42 reviews vs RS having 291), time frame (Review Signal has been collecting data on companies as early as 2011) or perhaps categorization methodology.

To calculate the actual ratings, we both used the same simple formula of % positive reviews (Review Signal has since changed it's methodology to decrease the value of older views). There is a lot greater difference there than between ranking order. This could also be a sampling or categorization issue, but the rankings actually were a lot closer than rating numbers especially at the bottom. The biggest differences were about Pagely, WiredTree, WebSynthesis, Azure, RackSpace, HostGator, and LunarPages. Review Signal had most of those companies higher than HostingReviews with the exceptions of Pagely and WiredTree. WiredTree the actual % difference isn't that high, it looks more distorted because of how many companies were ranked in that neighborhood. Pagely still remains the only concerning discrepancy, some of which could be corrected by using a different rating algorithm to compensate for small sample sizes (Wilson Confidence Interval). If you use a Wilson Confidence Interval with 95% confidence, Pagely would have 67% which makes the difference only 11%. Something still is off, but I'm not sure what. Towards the bottom, HostingReviews had companies with a lot lower ratings in general. I'm not sure why that is, but I'm not sure that it concerns me that greatly if a company is at 20 or 40%, that's pretty terrible through any lens.

The Wilson Confidence Interval is something I'm a big fan of, but the trouble is explaining it. It's not exactly intuitive and most users won't understand. To get around that problem here at Review Signal, I don't list companies with small sample sizes. I think it's unfair to small companies because those companies will always have lower scores using a Wilson Confidence Interval.

I always thought if you were going to list low data companies, you would have to use it for the ratings to be meaningful. So I went ahead and applied it to HostingReviews since they list low data companies.

Company HR Rating HR Wilson Score RS Rating Wilson HR Rank RS Rank Rank Difference
Flywheel 97 0.903664487437776 93 1 1 0
SiteGround 79 0.725707872732548 74 2 4 -2
Linode 72 0.667820465467272 74 3 5 -2
Pagely 81 0.667522785017387 56 4 18 -14
A Small Orange 74 0.665222315806623 77 5 2 3
WP Engine 72 0.664495409977001 74 6 6 0
DigitalOcean 66 0.632643582791056 75 7 3 4
WiredTree 75 0.62426879138105 67 8 12 -4
LiquidWeb 70 0.591607758450507 70 9 8 1
Amazon Web Services 55 0.50771491300961 67 10 13 -3
DreamHost 49 0.440663157139283 55 11 19 -8
Servint 59 0.410929374988646 60 12 14 -2
SoftLayer 50 0.387468960047243 70 13 9 4
MidPhase 61 0.3851843256587 59 14 16 -2
Microsoft Azure 43 0.379726217475451 70 15 10 5
HostDime 60 0.357464427565077 60 16 15 1
Rackspace 40 0.356282970938665 69 17 11 6
Synthesis 47 0.317886056933924 74 18 7 11
Media Temple 35 0.305726756042135 58 19 17 2
GoDaddy 30 0.277380620794128 45 20 25 -5
InMotion Hosting 43 0.252456868216651 52 21 20 1
WestHost 43 0.214851925523797 51 22 21 1
Bluehost 22 0.193489653693868 46 23 24 -1
Just Host 22 0.130232286167726 39 24 30 -6
HostGator 13 0.110124578122674 49 25 22 3
iPage 16 0.106548464670946 44 26 26 0
Netfirms 21 0.1063667334132 44 27 27 0
Hostway 18 0.085839112937093 44 28 28 0
Lunarpages 11 0.056357713906061 49 29 23 6
HostMonster 25 0.045586062644636 42 30 29 1
1&1 6 0.042907593743725 36 31 32 -1
Mochahost 10 0.017875749515721 20 32 34 -2
Verio 5 0.008564782830854 35 33 33 0
IX Web Hosting 0 0 38 34 31 3

This actually made the ranked order between companies even closer between Review Signal and HostingReviews. Pagely and WebSynthesis are still the two major outliers which suggests we have a more fundamental problem between the two sites and how we've measured those companies. But overall, the ranks got closer together, the original being off by a total of 124 (sum of how far off each rank was from one another) and Wilson rank being 104 which is 16% closer together. A win for the Wilson Confidence Interval and sample sizing issues!

Bonus: HostingReviews with Wilson Confidence Interval vs Original Rating/Ranking

Company Rating Reviews Wilson Score Rating Difference Rank Wilson Rank Difference
Flywheel 97 76 0.903664487437776 7 2 1 1
Kinsta 100 13 0.771898156944708 23 1 2 -1
SiteGround 79 185 0.725707872732548 6 5 3 2
Pantheon 84 49 0.713390268477418 13 3 4 -1
Linode 72 313 0.667820465467272 5 9 5 4
Pagely 81 42 0.667522785017387 14 4 6 -2
A Small Orange 74 153 0.665222315806623 7 7 7 0
WP Engine 72 278 0.664495409977001 6 10 8 2
DigitalOcean 66 1193 0.632643582791056 3 13 9 4
WiredTree 75 57 0.62426879138105 13 6 10 -4
Google Cloud Platform 70 101 0.604645970406924 10 11 11 0
LiquidWeb 70 79 0.591607758450507 11 12 12 0
Vultr 73 33 0.560664188794383 17 8 13 -5
Amazon Web Services 55 537 0.50771491300961 4 18 14 4
DreamHost 49 389 0.440663157139283 5 21 15 6
GreenGeeks 59 39 0.434429655157957 16 16 16 0
Servint 59 29 0.410929374988646 18 17 17 0
SoftLayer 50 72 0.387468960047243 11 19 18 1
Site5 49 83 0.385299666256405 10 22 19 3
MidPhase 61 18 0.3851843256587 22 14 20 -6
Microsoft Azure 43 358 0.379726217475451 5 24 21 3
HostDime 60 15 0.357464427565077 24 15 22 -7
Rackspace 40 461 0.356282970938665 4 28 23 5
Synthesis 47 36 0.317886056933924 15 23 24 -1
Media Temple 35 416 0.305726756042135 4 30 25 5
Arvixe 41 59 0.293772727671168 12 27 26 1
GoDaddy 30 1505 0.277380620794128 2 32 27 5
InMotion Hosting 43 23 0.252456868216651 18 25 28 -3
Web Hosting Hub 38 34 0.237049871468482 14 29 29 0
WebHostingBuzz 50 8 0.215212526824442 28 20 30 -10
WestHost 43 14 0.214851925523797 22 26 31 -5
Bluehost 22 853 0.193489653693868 3 34 32 2
Just Host 22 54 0.130232286167726 9 35 33 2
HostGator 13 953 0.110124578122674 2 41 34 7
iPage 16 128 0.106548464670946 5 39 35 4
Netfirms 21 34 0.1063667334132 10 36 36 0
Pressable 19 43 0.100236618545274 9 37 37 0
Hostway 18 34 0.085839112937093 9 38 38 0
Fasthosts 12 179 0.080208937918757 4 42 39 3
HostPapa 14 72 0.078040723708843 6 40 40 0
Globat 33 3 0.060406929099298 27 31 41 -10
Lunarpages 11 71 0.056357713906061 5 43 42 1
HostMonster 25 4 0.045586062644636 20 33 43 -10
1&1 6 540 0.042907593743725 2 46 44 2
Mochahost 10 10 0.017875749515721 8 44 45 -1
JaguarPC 10 10 0.017875749515721 8 45 46 -1
Verio 5 19 0.008564782830854 4 47 47 0
IPOWER 5 19 0.008564782830854 4 48 48 0
IX Web Hosting 0 45 0 0 49 49 0
PowWeb 0 10 0 0 50 50 0
MyHosting 0 9 0 0 51 51 0
WebHostingPad 0 5 0 0 52 52 0
HostRocket 0 2 0 0 53 53 0
Superb Internet 0 1 0 0 54 54 0

You will notice the biggest differences are companies with more reviews generally moving up in rank, small sample sizes move down. Because the sample sizes are so small on some companies, you can see their % rating drops dramatically. But since most companies don't have a lot of data, it doesn't influence the rankings as much.

Conclusion

It's been nice having HostingReviews.io around when it was actively being updated (the manual process is certainly overwhelming for any individual I think!). I will miss having a real competitor to compare what I'm seeing in my data. I don't know the new owners, but I do consider Steven, the creator, a friend and wish him the best of luck going forward while he works on his primary business, ChurchThemes.com. It saddens me to see the new owners ruining his work with what looks like another mediocre affiliate review site pushing some of the highest paying companies in the space. But it's yet another unfortunate reminder of why I'm so disappointed by the web hosting review industry.

Sources: All data was pulled from Archive.org.

http://web.archive.org/web/20150113073121/http://hostingreviews.io/

http://web.archive.org/web/20150130063013/https://reviewsignal.com/webhosting/compare/

HostingAdvice.com Steals Review Signal’s Content and Uses it to Mislead Visitors

This was originally written on July 7, 2015. The screenshots are mostly from that period using archive.org. The site has changed (no longer has a Top 10 that I see, but still misuses Review Signal in the exact same way). I was hesitant to bash competitors, but I decided I don't care, they are the ones behaving badly, I will call them out on it.

This is Episode 2 of Dirty Slimy Shady Secrets of the Web Hosting Review World

I've long hated the fake review sites that plague the web hosting review business. But it just became even more personal. HostingAdvice.com decided to take reviews from Review Signal, edit them and selectively use them to promote companies with very poor ratings.

Let's take a look at what is happening at HostingAdvice.com (This links to archive of their site in case they change it and I don't want them getting any benefit for the BS they are pulling).

hosting_advice_mission

They claim to be an expert and say everyone sucks. They are calling everyone else spammy and unreliable. It's hard to argue with the sentiment considering I have the same stance here.

But let's take a look at their Top Hosts in 2015

hosting_advice_top

Media Temple as number one, not the most abusive ranking I've seen. They don't have the best reviews here, but they are 58% (56% as of Jan 2017), which is 2nd tierish, at least more than half their customers are saying good things. BlueHost is #2? That's just nonsense. They have a 47% (40% as of Jan 2017) which means less than half their users are saying good things about them.

BUT WAIT, THERE'S MORE!

hosting_advice_disclaimer

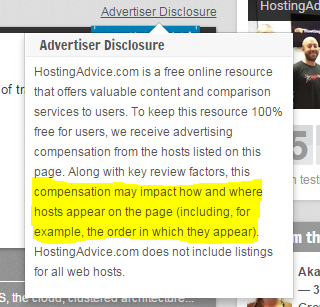
Remember that Highfalutin rhetoric about them being different and not spammy/unreliable? How could you possible need a disclosure like that if it were true? That's right, you're just like every other crap web hosting review site out there trying to pimp the highest paying affiliate program on unsuspecting visitors.

If that wasn't enough, there's always the coup de grâce:

Things are starting to make sense. But none of this has gotten personal yet.

So I took a look at the #3 Ranked iPage and to my absolute delight found this under 'Customer Reviews'

hosting_advice_stealing_reviews Yes, those are the two highest rated positive comments about iPage on Review Signal.

review_signal_actual_review

Except they've been given 5 stars which isn't something we do here. Also, they've edited this review without indicating they changed it (adding 'I'), which tells me they did this by hand and not scraping.

So that five star rating is made up. How made up?hosting_advice_fake_bluehost

So made up that this stolen review was given four stars. They are simply adding their own narrative and judgement to Review Signal's data.

At Review Signal, we only categorize as positive or negative.

Why does this matter and why is this so personal?

This matters because they were conscious enough of Review Signal to steal its content. They were also conscious enough to cherry pick the data they wanted to push the highest paying affiliates and ignored the fact they are selling out to some of the lowest rated companies around. They have JustHost listed as #9 (like many Fake review sites have in their top lists) when every indication shows that they have a terrible reputation. One of the absolute lowest on this site at 39% ( 31% as of Jan 2017) or you can look at the 21% on a no-affiliate link site that uses a similar methodology to Review Signal (now down to 7% as of Jan 2017).

2017 Update: iPage is still listed as 5 Stars with a 4.9/5 Rating as one of their best hosts in 2017.

Finally, what made this so personal is they are using the Review Signal brand to mislead consumers. This site was built to help consumers in a space filled with charlatans and it is painful to watch the brand be used by one of them to enhance their bottom line.

If you're not familiar with Review Signal, I suggest start by looking at our full dataset. Alternatively, you can read about how it works where our entire methodology is detailed including the algorithms used to generate our ratings. The gist of it is we use twitter data to listen to what good and bad things are saying about web hosting companies and publish the results. We validate our method using the few limited available metrics like NPS scores when given the opportunity.

Black Friday / Cyber Monday Web Hosting Deals

 Company Deal Restrictions Coupon Start End
A Small Orange [Reviews] 85% Off all new plans + 2X Memory (VPS 2X Memory on VPS only EPIC 11/23/16 11/29/16
A2 Hosting 67% off shared hosting BFCM67 Cyber Monday 12/02/16
 A2 Hosting 50% off Managed & Core VPS Hosting MANVPS50  Cyber Monday  12/02/16
 A2 Hosting 40% off Reseller Hosting RESELL40  Cyber Monday  12/02/16
 A2 Hosting 25% off Sprint Dedicated Server (Unmanaged, Core, Managed) SPRINT25 Cyber Monday Cyber Monday
Cloudways 25% off all plans for first 3 months Must get credit card authorized and new customers only. HOLIDAY25 Now 11/30/16
DreamHost [Reviews] 50% off Shared Hosting Now Cyber Monday 3pm PDT
 DreamHost [Reviews] DreamPress 25% Off  Now  Cyber Monday 3pm PDT
FlyWheel [Reviews] 25% Off (3 Months Free) Annual Subscription Only flyday2016 Now Cyber Monday
GoDaddy [Reviews] $1/mo Managed WordPress Hosting New purchase only, 12 month term hos1gbr22 Now 12/31/16
HostGator [Reviews] 65% off hosting, 1 hour flash sales for 75% off New plans only 11/25/16 12 pm CST 11/28 11:59 PM CST
Kickassd 6 Months for $6 Little Kicker Plan Only. Limited to 50. 6FOR6 Now 11/29/16
Kinsta 30% off first month Must open a support ticket with coupon code to apply it post-purchase ReviewSBF16 Now 11/29/16
MediaTemple [Reviews] 40% off one year of hosting WordPress / Shared / VPS levels 1+2 only CYBER2016 11/27/16 11/29/16
Nexcess 70% Off First Month Dedicated or Shared Servers NEX70OFF Black Friday Cyber Monday
Pressjitsu 50% off for 3 months after free trial Not on enterprise plans BF2016 Now 11/29/16
SiteGround [Reviews] 70% off annual shared hosting plans Black Friday Cyber Monday
WPEngine [Reviews] 30% off first payment cyberwknd Now Cyber Monday
WPX Hosting (Traffic Planet Hosting) $1 for First Month on Business (normally $24.99), Professional (normally $49.99) and Elite (normally $99). New Customers Only 00:01 AМ Wednesday, November 23, 2016 (EST) 11:59 PМ Wednesday, November 30, 2016 (EST)
 WPX Hosting (Traffic Planet Hosting) Prepay 3 Years, Get 5 Years New & Existing Customers  00:01 AМ Wednesday, November 23, 2016 (EST)  11:59 PМ Wednesday, November 30, 2016 (EST)

WordPress.com VIP Hosting Review (2016)

WordPress.com VIP participated for the first time in WordPress Hosting Performance Benchmarks. They were easily the most expensive service tested, clocking in at $5,000/month. They also host some of the most popular WordPress sites on the web and being Automattic's flagship hosting product, it has some huge expectations riding on it.

Products

Company Plan Monthly Price Visitors Allowed Disk Space Bandwidth Sites Allowed
WordPress.com VIP Basic $5,000 Unlimited Unlimited Unlimited 5

View Full Product Details

Performance Review

LoadStorm Results

Company Total Requests Total Errors Peak RPS Average RPS Peak Response Time(ms) Average Response Time(ms) Total Data Transferred (GB) Peak Throughput (MB/s) Average Throughput (MB/s)
WordPress.com VIP 4660190 8151 3726.38 2588.99 8186 101 197.82 158.29 109.9

LoadStorm test logged in thousands of users to simulate heavy uncached load on the server, scaling up with more users on larger plans after the $25-50/month range. WordPress.com VIP handled this test with minimal errors and never hitting the response timeout limit of 15000ms. In fact, it had the lowest average response time and and peak response time.

Blitz Results

Company Hits Errors Timeouts Average Hits/Second Average Response Time Fastest Response Slowest Response
WordPress.com VIP 146200 0 73 2437 6 3 21

The Blitz test is designed to make sure that static assets (which should be served from cache) are being handled properly and can scale to very heavy big spikes in traffic. WordPress.com VIP had a 17ms spread and a mere 73 timeouts out of 146,2000 requests. Certainly, top tier.

Uptime

Company StatusCake UptimeRobot
WordPress.com VIP 100 100

Perfect.

WebPageTest / WPPerformanceTester

I mention these because they are in the full testing but I won't bother putting them here. No company had any significant issue with either and it's not worth writing about. If you're very interested in seeing the geographical response times on WPT or what the raw computing power test of WPPerformanceTester measured, read the full results.

Conclusion

WordPress.com VIP stepped into the Enterprise level of our testing and proved itself worthy and earned our Top Tier WordPress Hosting Performance award. The huge expectations of being owned by the creator of WordPress, being one of the largest companies in the space and hosting some of the biggest brands in the world were met. The price for VIP is beyond what most site owners will ever likely spend, but for the few that can afford it, VIP's performance is certainly top notch.

wpvip

The Sinking of Site5 – Tracking EIG Brands Post Acquisition

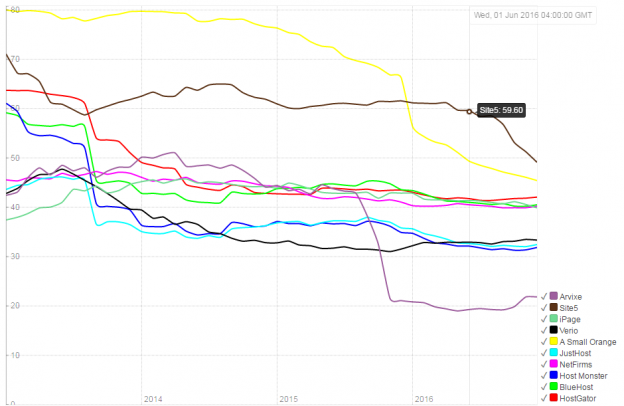
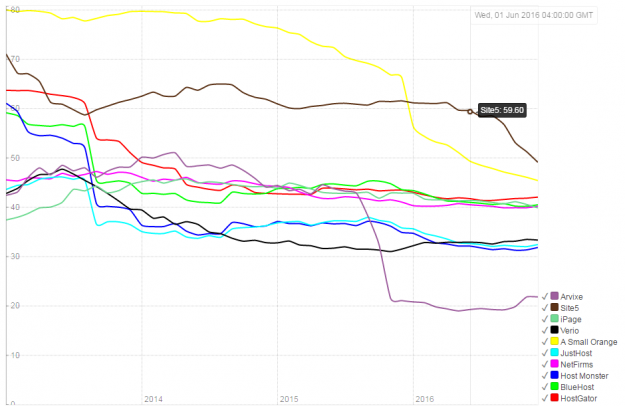
"You'll notice their ratings, in general, are not very good with Site5 (their most recent acquisition) being the exception. iPage was acquired before I started tracking data. BlueHost/HostMonster also had a decline, although the data doesn't start pre-acquisition. JustHost collapses post acquisition. NetFirms has remained consistently mediocre. HostGator collapses with a major outage a year after acquisition. Arvixe collapses a year after being acquired. Site5 is still very recent and hasn't shown any signs of decline yet." - The Rise and Fall of A Small Orange, January 2016

Review Signal Rating Calculated Pos/(Pos+Neg), without duplicate filtering

Review Signal Rating Calculated Pos/(Pos+Neg), without duplicate filtering (January 2016)

That's what I wrote at the beginning of 2016 as I watched A Small Orange's rating collapse in a pretty popular post called The Rise and Fall of A Small Orange, which documented ASO's Rise and Fall, but also the fall of many EIG brands. One thing I mentioned was the recent acquisition of Site5 (and Verio) which had a fairly good rating on Review Signal at the time of acquisition. The trend seemed to be roughly a year to see the drop in rating, post acquisition.

Site5 ~ 1 Year Later

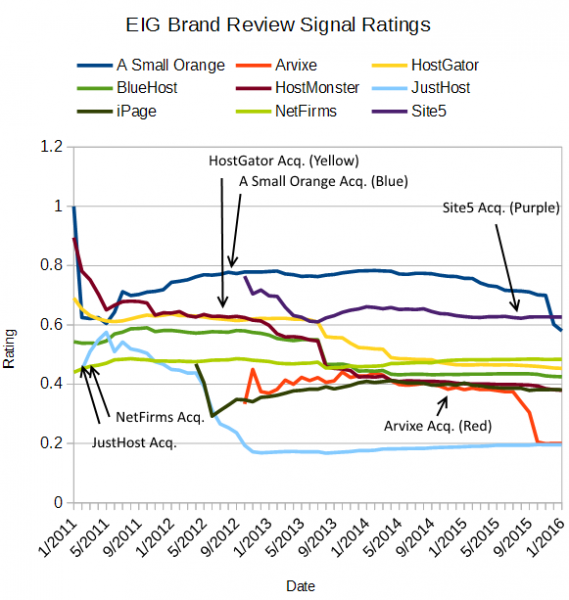
The acquisition of Site5 was announced August 2015. Here's the updated EIG brand tracking graph. One thing to note, this now uses the new rating algorithm which has a built in decay function to weight older reviews less. So the new graph uses the new algorithm but calculating each point in time as if it always used it. There will be some differences between it and the original graph (which prompted the change in algorithm). It's minimal for most brands, only when there is a major change in sentiment, it shows a change more quickly. Full details about the change can be read on Review Signal Ranking Algorithm Update.

eig_brand_review_signal_ratings_2016

What you can see is the reputation remained relatively stable until about April 2016 and then started a slow but steady decline where it has dipped below 50% for the first time recently. As with nearly every brand, except A Small Orange, the decline happened within a year.

Since the original post there also hasn't been much movement in any other brands beyond Site5 crashing and A Small Orange continuing to slide downward. Verio didn't see a dip post-acquisition, but it had a pretty low rating to start with that put it in the bottom half of EIG brand ratings already.

Why Do EIG Brands Go Down Post Acquisition?

The longer I am in this industry, the more stories I hear. A Small Orange was such an interesting exception and I've heard a lot about it from a lot of people. It's relative independence and keeping the staff seemed to be the key to maintaining a good brand even within the EIG conglomerate.

Site5 offers what I imagine is more business-as-usual in the EIG world. Cut staff, migrate to EIG  and maximize profit (in the short term). Site5's founder, Ben, reached out to a competitor, SiteGround, and arranged for them to hire a large number of Site5 staff that EIG had no plans on keeping according to SiteGround's blog. A very classy move from the former CEO and a seeming win for SiteGround, one of EIG's larger hosting competitors. I also saw similar behavior of long time staff all leaving when A Small Orange started to go downhill and staff from other EIG brands showed up.

Beyond simply trying to cut costs, you have to wonder why would you spend all that money acquiring these brands that have lots of customers, good reputations and talented staff that obviously are keeping the operation running successfully only to get rid of nearly all of that except the customers. But once you gut the staff, it seems like the customers notice, because it certainly shows up in the data I track.

Conveniently, EIG just published their Q3 2016 10-Q.

We have certain hosting and other brands to which we no longer allocate significant marketing or other funds. These brands generally have healthy free cash flow, but we do not consider them strategic or growth priorities. Subscriber counts for these non-strategic brands are decreasing. While our more strategic brands, in the aggregate, showed net subscriber adds during the quarter ended September 30, 2016, the net subscriber losses in non-strategic brands and certain gateway brands contributed to a decrease in our total subscribers of approximately 42,000 during the quarter. We expect that total subscribers will continue to decrease in the near term.

Overall, our core hosting and web presence business showed relatively slow revenue and subscriber growth during the first nine months of 2016. We believe that this is due to flat marketing expenditures relative to 2015 levels on this business in the first half of 2016 as a result of our focus on gateway products during that period, and to trends in the competitive landscape, including greater competition for referral sources and an increasing trend among consumers to search for web presence and marketing solutions using brand-related search terms rather than generic search terms such as “shared hosting” or “website builder”. We believe this trend assists competitors who have focused more heavily than we have on building consumer awareness of their brand, and that it has made it more challenging and more expensive for us to attract new subscribers. In order to address this trend, during the third quarter of 2016, we began to allocate additional marketing investment to a subset of our hosting brands, including our largest brands, Bluehost.com, HostGator and iPage. We plan to continue this increased level of marketing investment in the near term, and are evaluating different marketing strategies aimed at increasing brand awareness.

So the result of their current strategy this past quarter has been a net loss of 42,000 customers. They say their strategic brands on aggregate had a net subscriber increase and named the largest ones (BlueHost, HostGator, iPage) and they are going to focus on a subset of brands going forward. But the phrasing would seem to imply that some of the strategic brands experienced losses as well. It also means that the non-strategic brands lost more than 42,000 customers and pulled down the net subscribers to -42,000 customers last quarter.

The cap it all off, I got one of the most surprising emails from Site5 a couple days ago.

We wanted to let you know that we’ve decided to terminate the Site5 Affiliate program as of November 30th, 2016.

We want to thank you for your support of Site5, especially during our most recent move into Impact Radius, and we hope that you’ll consider promoting another one of Endurance’s other programs.

I guess Site5 isn't being considered a strategic brand if they are killing off the affiliate channel on it entirely, right after a big migration from Site5's custom affiliate program to Impact Radius. They also asked that affiliates promote HostGator now, which certainly fits in the strategic brand category.

It's extremely disappointing to see this trend continue of brands collapsing after a year in EIG's hands. What will be interesting going forward is that EIG hasn't acquired any new hosting brands for a while. They seem to be focused on their existing brands for now. I wonder if that will mean we will see any noticeable positive change or improvements in existing brands (or at least some of the strategic brands).

WPOven WordPress Hosting Review (2016)

WPOven participated for the second time in WordPress Hosting Performance Benchmarks. Last year they struggled with the LoadStorm test, but I'm happy to say that's no longer the case. They stepped up their performance including doubling the amount of memory for accounts while tests were on-going.

Products

Company Plan Monthly Price Visitors Allowed Disk Space Bandwidth Sites Allowed
WPOven Personal $39.95 Unlimited 40GB 4TB No Limit

They made it clear to me that the products are identical until the VIP level, each site has equal resources, the only difference in plans is that more sites are allowed.

View Full Product Details

Performance Review

LoadStorm Results

Company Total Requests Total Errors Peak RPS Average RPS Peak Response Time(ms) Average Response Time(ms) Total Data Transferred (GB) Peak Throughput (MB/s) Average Throughput (MB/s)
WPOven 288369 0 217.85 160.21 5815 283 16.64 13.63 9.245

LoadStorm test logged in thousands of users to simulate heavy uncached load on the server, scaling up with more users on larger plans after the $25-50/month range. WPOven had no errors this year, a marked improvement and perfect result.

Blitz Results

Company Hits Errors Timeouts Average Hits/Second Average Response Time Fastest Response Slowest Response
WPOven 26687 0 0 445 103 101 104

The Blitz test is designed to make sure that static assets (which should be served from cache) are being handled properly and can scale to very heavy big spikes in traffic. If the LoadStorm test was a clinic, this was absolute perfection. WPOven again had zero errors and a 3ms response spread.

Uptime

Company StatusCake UptimeRobot
WPOven 100 100


Perfect. Enough said.

WebPageTest / WPPerformanceTester

I mention these because they are in the full testing but I won't bother putting them here. No company had any significant issue with either and it's not worth writing about. If you're very interested in seeing the geographical response times on WPT or what the raw computing power test of WPPerformanceTester measured, read the full results.

Conclusion

WPOven put on an absolute clinic this year. On every test they performed perfectly. A whopping zero errors across all the load tests and perfect 100% uptime. WPOven easily earned the recognition of being a Top Tier WordPress Host.

wpoven

DreamHost / DreamPress WordPress Hosting Review (2016)

DreamHost participated for the third year in a row in WordPress Hosting Performance Benchmarks. Last year, I wrote:

DreamPress improved their performance a lot over last round. In fact they did fantastically well on every load test once I got the opportunity to actually work with their engineers to bypass the security measures. However, they failed pretty badly on the uptime metrics. I have no idea what happened but I experienced a huge amount of downtime and ran into some very strange errors. If it wasn't for the severe downtime issues, DreamPress could have been in the top tier.

This year, they made even further progress and earned that Top Tier status. DreamHost also are the second highest rated shared hosting company here at Review Signal in terms of customer opinion.

Products

Company Plan Monthly Price Visitors Allowed Disk Space Bandwidth Sites Allowed
DreamHost DreamPress $19.95 Unlimited 30GB Unlimited 1

View Full Product Details

Performance Review

LoadStorm Results

Company Total Requests Total Errors Peak RPS Average RPS Peak Response Time(ms) Average Response Time(ms) Total Data Transferred (GB) Peak Throughput (MB/s) Average Throughput (MB/s)
DreamHost 295685 43 224.1 164.27 15063 339 16.06 13.5 8.922

LoadStorm test logged in thousands of users to simulate heavy uncached load on the server, scaling up with more users on larger plans after the $25-50/month range. DreamHost did exceptionally well with almost no errors and fast aerage response time.

Blitz Results

Company Hits Errors Timeouts Average Hits/Second Average Response Time Fastest Response Slowest Response
DreamHost 29337 0 1 489 4 3 7

The Blitz test is designed to make sure that static assets (which should be served from cache) are being handled properly and can scale to very heavy big spikes in traffic. If the LoadStorm test was a clinic, this was absolute perfection. DreamHost was near perfect with a ridiculously quick 4ms average response time (which is likely due to being physically close to the testing server) and 4ms spread which is excellent.

Uptime

Company StatusCake UptimeRobot
DreamHost 99.97 99.97


Not much to say here beyond DreamHost had good uptime at 99.97%.

WebPageTest / WPPerformanceTester

I mention these because they are in the full testing but I won't bother putting them here. No company had any significant issue with either and it's not worth writing about. If you're very interested in seeing the geographical response times on WPT or what the raw computing power test of WPPerformanceTester measured, read the full results.

Conclusion

DreamHost continues to step up their performance game. Last year, a severe uptime issue knocked them out of earning awards. This year, there were no such problems. They handled every test near flawlessly and earned themselves a Top Tier WordPress Hosting Performance award. I always am happy to see companies continually improve their performance. It's good for the space to have another strong competitor at the entry level price range.

dreamhost

Pantheon WordPress Hosting Review (2016)

Pantheon participated for the third time in WordPress Hosting Performance Benchmarks. They've done well in the past earning top tier status in both previous tests. This year they had four plans entered into the following ranges: $25-50/month, $51-100/month, $201-500/month and Enterprise ($500+/month).

Products

Company Plan Monthly Price Visitors Allowed Disk Space Bandwidth Sites Allowed
Pantheon 25-50 Personal $25 10,000 5GB Unlimited 1
Pantheon 51-100 Professional $100 100,000 20GB Unlimited 1
Pantheon 201-500 Business $400 500,000 30GB Unlimited 1
Pantheon Enterprise Elite $1,666.66 Unlimited 100GB+ Unlimited Priced Per Site

View Full Product Details

Performance Review

LoadStorm Results

Company Total Requests Total Errors Peak RPS Average RPS Peak Response Time(ms) Average Response Time(ms) Total Data Transferred (GB) Peak Throughput (MB/s) Average Throughput (MB/s)
Pantheon 25-50 268164 866 205.5 148.98 14422 315 6466 4.927 3.592
Pantheon 51-100 409962 57051 325.53 227.76 11682 762 20.74 17.97 11.52
Pantheon 201-500 629578 49212 510.78 349.77 15091 1353 33.88 28.9 18.82
Pantheon Enterprise 1295178 9964 1014.58 719.54 15101 786 30.86 24.18 17.15

LoadStorm test logged in thousands of users to simulate heavy uncached load on the server, scaling up with more users on larger plans after the $25-50/month range. Pantheon did well at the entry level and the enterprise level. The 51-100 and 201-500 range the load exceeded the capacity of the containers hosting the sites. Pantheon showed they definitely can scale at the Enterprise level, but some of the mid-range of their lineup struggled to keep up with our tests.

Blitz Results

Company Hits Errors Timeouts Average Hits/Second Average Response Time Fastest Response Slowest Response
Pantheon 25-50 27755 0 0 463 61 60 67
Pantheon 51-100 55499 0 0 925 61 60 64
Pantheon 201-500 83211 2 0 1387 61 61 68
Pantheon Enterprise 138607 4 27 2310 62 60 80

The Blitz test is designed to make sure that static assets (which should be served from cache) are being handled properly and can scale to very heavy big spikes in traffic. If the LoadStorm test was a clinic, this was absolute perfection. Pantheon had no issue with the Blitz tests at any level with near perfect results across every tier.

Uptime

Company StatusCake UptimeRobot
Pantheon 25-50 100 100
Pantheon 51-100 100 100
Pantheon 201-500 99.98 99.98

2/3 were perfect and the third was 99.98%. Pantheon did excellent in the uptime department.

Uptime wasn't tracked on most Enterprise level plans because they are just so expensive that it felt wasteful to run them for a long period doing nothing but monitoring uptime if the company had other plans in the testing which could also be measured.

WebPageTest / WPPerformanceTester

I mention these because they are in the full testing but I won't bother putting them here. No company had any significant issue with either and it's not worth writing about. If you're very interested in seeing the geographical response times on WPT or what the raw computing power test of WPPerformanceTester measured, read the full results.

Conclusion

Pantheon earned two Top Tier WordPress Hosting Performance awards this year, for their entry level Personal plan and their Enterprise level plan. They definitely can scale for enormous sites and compete with the biggest companies in the space. The only place they struggled this year was the mid-range of their offerings during the LoadStorm test. It's by far the most stressful test and the $201-500 range was the most difficult price/performance point of any of the price brackets. Pantheon has a very unique platform compared to the rest of the field that's exceptionally developer-centric and focused around building a toolkit for teams of developers to work on a site in an opinionated workflow. If you like that workflow, you get an amazing toolkit combined with scalable performance.

pantheon-logo-black

LiquidWeb WordPress Hosting Review (2016)

LiquidWeb was a first time participant in WordPress Hosting Performance Benchmarks. They have been around for a long time in the managed web hosting space but only recently entered the WordPress space. They have consistently been one of the top companies tracked at Review Signal winning numerous awards for their shared and VPS hosting.

Those are some pretty big expectations to meet when you enter a space that is already full of many competitors and being the new kid on the block. The only other first time participant that did as well was WordPress.com VIP, which isn't a new entrant into the space, but only this testing.

Products

Company / Price Bracket Plan Monthly Price Visitors Allowed Disk Space Bandwidth Sites Allowed
LiquidWeb 51-100 Personal $89 Unlimited 100GB SSD 5 TB 10
LiquidWeb 101-200 Professional $149 Unlimited 150GB SSD 5 TB 20

View Full Product Details

Performance Review

LoadStorm Results

Company / Price Bracket Total Requests Total Errors Peak RPS Average RPS Peak Response Time(ms) Average Response Time(ms) Total Data Transferred (GB) Peak Throughput (MB/s) Average Throughput (MB/s)
LiquidWeb 51-100 520072 2745 408.3 288.93 15322 525 24.04 19.69 13.35
LiquidWeb 101-200 635893 76 490.78 353.27 15097 360 31.3 25.19 17.39

LoadStorm test logged in thousands of users to simulate heavy uncached load on the server, scaling up with more users on larger plans after the $25-50/month range. LiquidWeb handled these tests with relative ease. The larger plan did better managing a faster average response time and having fewer errors. But both results were top tier performances.

Blitz Results

Company / Price Bracket Hits Errors Timeouts Average Hits/Second Average Response Time Fastest Response Slowest Response
LiquidWeb 51-100 54574 0 4 910 78 77 82
LiquidWeb 101-200 81393 47 10 1357 80 76 118

The Blitz test is designed to make sure that static assets (which should be served from cache) are being handled properly and can scale to very heavy big spikes in traffic. If the LoadStorm test was a clinic, this was absolute perfection. LiquidWeb had minimal issues with the Blitz test. A very minor spike up to 118ms on the bigger test is the only noticeable thing. Again, top tier performances.

Uptime

Company StatusCake UptimeRobot
LiquidWeb 51-100 100 100
LiquidWeb 101-200 100 100


Perfect.

WebPageTest / WPPerformanceTester

I mention these because they are in the full testing but I won't bother putting them here. No company had any significant issue with either and it's not worth writing about. If you're very interested in seeing the geographical response times on WPT or what the raw computing power test of WPPerformanceTester measured, read the full results.

Conclusion

LiquidWeb earned Top Tier WordPress Hosting Performance for both plans it entered. It's product line starts in the mid-range price wise and goes up. They definitely have the performance to match the pricing. Absolutely perfect uptime was nice to see too. I'm pleased to see they bring their strong reputation to this market with a strong product that matches the quality people have come to expect from LiquidWeb.

liquidweb-wordpress


Pressable WordPress Hosting Review (2016)

Pressable participated for the second time in WordPress Hosting Performance Benchmarks. Their last participation was in the original which was performed in 2013. They've undergone major changes since then and are now owned by Automattic. This year they had the most plans entered of any company at five into the following ranges: $25-50/month, $51-100/month, $101-200/m, $201-500/month and Enterprise ($500+/month).

Products

Company / Price Bracket Plan Monthly Price Visitors Allowed Disk Space Bandwidth Sites Allowed
Pressable 25-50 5 Sites $25 60,000 Unlimited Unlimited 5
Pressable 51-100 20 Sites $90 400,000 Unlimited Unlimited 20
Pressable 101-200 Agency 1 $135 600,000 Unlimited Unlimited 30
Pressable 201-500 Agency 3 $225 1 Million Unlimited Unlimited 50
Pressable Enterprise VIP 1 $750 5 Million Unlimited Unlimited 100

They made it clear to me that the products are identical until the VIP level, each site has equal resources, the only difference in plans is that more sites are allowed.

View Full Product Details

Performance Review

LoadStorm Results

Company / Price Bracket Total Requests Total Errors Peak RPS Average RPS Peak Response Time(ms) Average Response Time(ms) Total Data Transferred (GB) Peak Throughput (MB/s) Average Throughput (MB/s)
Pressable 25-50 394405 26 294.6 219.11 15101 226 16.4 13.32 9.111
Pressable 51-100 569095 0 441.43 316.16 3152 239 24.35 20.19 13.53
Pressable 101-200 724499 1090 562.12 402.5 15024 447 30.91 26.07 17.17
Pressable 201-500 896616 12256 740.88 498.12 6362 450 37.87 33.8 21.04
Pressable Enterprise 1538237 7255 1162.63 854.58 15099 733 29.18 21.95 16.21

LoadStorm test logged in thousands of users to simulate heavy uncached load on the server, scaling up with more users on larger plans after the $25-50/month range. Pressable overall did very well. Earning top tier status in four our of five. The 201-500 price bracket had a bit of difficulty with the increased load which disappears at the Enterprise level.

Blitz Results

Company / Price Bracket Hits Errors Timeouts Average Hits/Second Average Response Time Fastest Response Slowest Response
Pressable 25-50 25914 0 2 432 134 134 136
Pressable 51-100 51781 0 0 863 135 134 136
Pressable 101-200 77652 0 4 1294 134 141 133
Pressable 201-500 77850 11 1 1298 132 131 135
Pressable Enterprise 129866 13 2 2164 132 131 139

The Blitz test is designed to make sure that static assets (which should be served from cache) are being handled properly and can scale to very heavy big spikes in traffic. If the LoadStorm test was a clinic, this was absolute perfection. Pressable had zero issues with the Blitz tests across every plan. Their caching is certainly up to snuff.

Uptime

Company StatusCake UptimeRobot
Pressable 25-50 99.91 99.92
Pressable 51-100 99.93 99.95
Pressable 101-200 99.96 99.94
Pressable 201-500 99.88 99.9

Oddly enough, Uptime was one of the biggest struggles for Pressable. The 201-500 plan didn't earn top tier status because it fell below the 99.9% threshold averaging 99.89 between the two monitors. The rest were closer to the 99.9% mark than the 100% mark which, while above the expected threshold, I'd like to see a bit of improvement in.

Uptime wasn't tracked on most Enterprise level plans because they are just so expensive that it felt wasteful to run them for a long period doing nothing but monitoring uptime if the company had other plans in the testing which could also be measured.

WebPageTest / WPPerformanceTester

I mention these because they are in the full testing but I won't bother putting them here. No company had any significant issue with either and it's not worth writing about. If you're very interested in seeing the geographical response times on WPT or what the raw computing power test of WPPerformanceTester measured, read the full results.

Conclusion

Pressable managed to earn four Top Tier WordPress Hosting Performances out of five plans. Overall, the performance is excellent and they can scale from $25/month to Enterprise size workloads. I'd like to see some minor improvements in uptime, but apart from that small issue, they don't have much else to improve on. It's great to see a strong competitor at virtually every price level in the space.

pressable234x60


Loading...

Interested in seeing which web hosting companies people love (and hate!)? Click here and find out how your web host stacks up.