
The full company list, product list, methodology, and notes can be found here.
This post focuses only on the results of the testing in the Enterprise ($500+) price bracket for WordPress Hosting.
Contents
Other Price Tier Results
<$25/Month Tier$25-50/Month Tier$51-100/Month Tier$101-200/Month Tier$201-500/Month Tier$500+/Month (Enterprise) TierHosting Plan Details

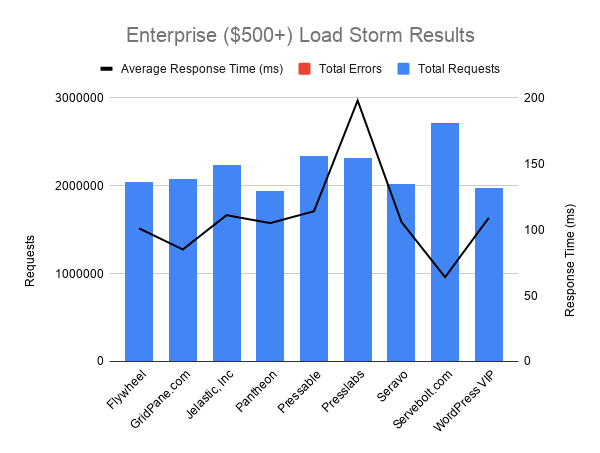
Load Storm Testing Results
Load Storm is designed to simulate real users visiting the site, logging in and browsing. It tests uncached performance.
Results Table
| Company Name | Total Requests | Total Errors | Peak RPS | Average RPS | Peak Response Time(ms) | Average Response Time (ms) | Total Data Transferred (GB) | Peak Throughput (MB/s) |
Average Throughput (MB/s)
|
| Flywheel | 2,043,029 | 218 (0.01%) | 1,644.77 | 1,135.02 | 2,239 | 101 | 112.42 | 90.44 | 62.46 |
| GridPane.com | 2,071,182 | 3 (0%) | 1,652 | 1,151 | 15,069 | 85 | 112.27 | 90 | 62 |
| Jelastic, Inc | 2,231,688 | 495 (0.02%) | 1,782 | 1,240 | 15,103 | 111 | 117.82 | 94 | 65 |
| Pantheon | 1,934,443 | 252 (0.01%) | 1,548 | 1,075 | 27,699 | 105 | 120.86 | 97 | 67 |
| Pressable | 2,339,016 | 5 (0%) | 1,887 | 1,299 | 15,099 | 114 | 120.53 | 97 | 67 |
| Presslabs | 2,313,006 | 0 (0%) | 1,867 | 1,285 | 5,763.00 | 198 | 112 | 91 | 62 |
| Seravo | 2,017,026 | 6 (0%) | 1,647.15 | 1,120.57 | 13,379 | 106 | 105.21 | 86.17 | 58.45 |
| Servebolt.com | 2,707,825 | 250 (0.01%) | 2,180 | 1,504 | 15,289 | 64 | 101.02 | 80 | 56 |
| WordPress VIP | 1,968,726 | 3 (0%) | 1,581.05 | 1,093.74 | 3,821 | 109 | 165.96 | 133.41 | 92.2 |
Full interactive results can be referenced here.
Discussion
Flywheel [Reviews], GridPane, Jelastic, Pantheon [Reviews], Pressable, Presslabs, Seravo, Servebolt and WPVIP all handled this test without issue. It's impressive how the average response time for every company was below 200ms.
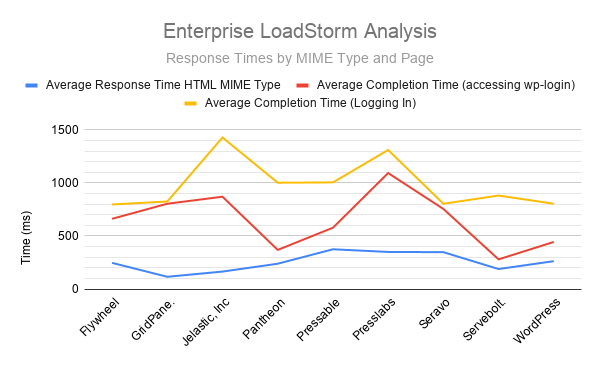
I thought it would be interesting to take a deeper look into the results since every company handled it pretty easily. I broke down three different views:
- HTML MIME Type
- Accessing wp-login (Page 2)
- Logging in (Page 3)
The HTML MIME type should reduce the effect of caching on response times because it's only pages being served, not things like css/js/etc. Page 2/3 are the heaviest queries accessing the WordPress backend and passing data to it which cannot be cached because users need to login and get their data.
| Company Name | Average Response Time HTML MIME Type | Average Completion Time (accessing wp-login) |
Average Completion Time (Logging In)
|
| Flywheel | 247 | 662 | 797 |
| GridPane.com | 116 | 804 | 825 |
| Jelastic, Inc | 165 | 870 | 1428 |
| Pantheon | 239 | 369 | 1002 |
| Pressable | 375 | 578 | 1005 |
| Presslabs | 350 | 1093 | 1310 |
| Seravo | 348 | 755 | 804 |
| Servebolt.com | 189 | 280 | 881 |
| WordPress VIP | 263 | 444 | 804 |
The results were quite interesting to see, the response times are a lot higher on the harder tasks, as expected. I wasn't sure how much higher they would be but it's substantial.
Bonus analysis at the bottom comparing last year's performance is also available.
Load Impact Testing Results
Load Impact is designed to test cached performance by repeatedly requesting the homepage.
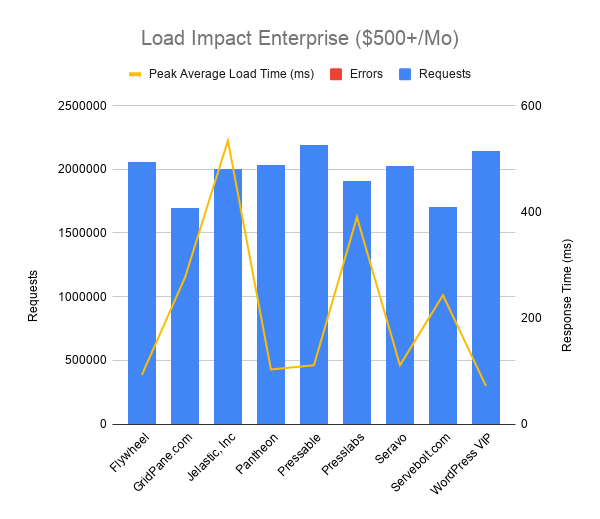
Results Table
| Company Name | Requests | Errors | Data Transferred (GB) | Peak Average Load Time (ms) | Peak Average Bandwidth (Mbps) | Peak Average Requests/Sec |
| Flywheel | 2055993 | 3 | 121.08 | 93 | 1810 | 3750 |
| GridPane.com | 1692853 | 0 | 89.87 | 276 | 1250 | 2880 |
| Jelastic, Inc | 2003605 | 9 | 107.59 | 534 | 1700 | 3870 |
| Pantheon | 2033313 | 3 | 131.42 | 103 | 1880 | 3560 |
| Pressable | 2193045 | 0 | 123.67 | 111 | 1950 | 4220 |
| Presslabs | 1909394 | 1 | 107.78 | 390 | 1620 | 3500 |
| Seravo | 2022325 | 0 | 112.89 | 111 | 1700 | 3710 |
| Servebolt.com | 1703187 | 0 | 92.86 | 243 | 1300 | 2920 |
| WordPress VIP | 2146954 | 0 | 128.27 | 72 | 1940 | 3960 |
Full interactive results can be referenced here.
Discussion
No company struggled with the Load Impact test. Jelastic had a very strange looking graph with response times bouncing up and down, possibly an auto scaling issue? GridPane's graph looked like there was an increasing in load but the peak was under 300ms, it really isn't an issue.
Uptime Monitoring Results
Uptime is monitored by two companies: Uptime Robot and StatusCake. A self hosted monitor was also run in case there was a major discrepancy between the two third party monitors.
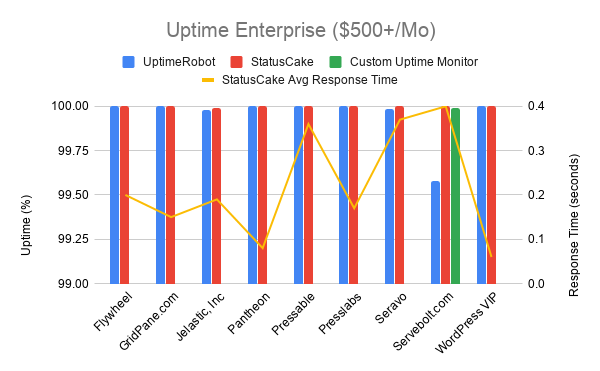
Results Table
| Company Name | UptimeRobot | StatusCake | StatusCake Avg Response Time | Custom Uptime Monitor |
| Flywheel | 100 | 100 | 0.2 | |
| GridPane.com | 100 | 100 | 0.15 | |
| Jelastic, Inc | 99.979 | 99.99 | 0.19 | |
| Pantheon | 100 | 100 | 0.08 | |
| Pressable | 100 | 100 | 0.36 | |
| Presslabs | 100 | 100 | 0.17 | |
| Seravo | 99.984 | 100 | 0.37 | |
| Servebolt.com | 99.581 | 100 | 0.4 | 99.99 |
| WordPress VIP | 100 | 100 | 0.06 |
Discussion
No companies had any uptime issues.
Servebolt also had a discrepancy between UptimeRobot and StatusCake uptime. One showed a very low 99.581 and the other 100. The third monitor I setup showed 99.99%, so I went with the StatusCake number.
WebPageTest.org Results
WebPageTest fully loads the homepage and records how long it takes from 11 different locations around the world.
Results Table
Results table can be referenced here. The radar chart does an excellent job without hiding any information.
Discussion
Flywheel and Seravo were neck and neck with Flywheel edging out Seravo by 31ms for fastest average load time. Pressable was the slowest in 7/12 locations.
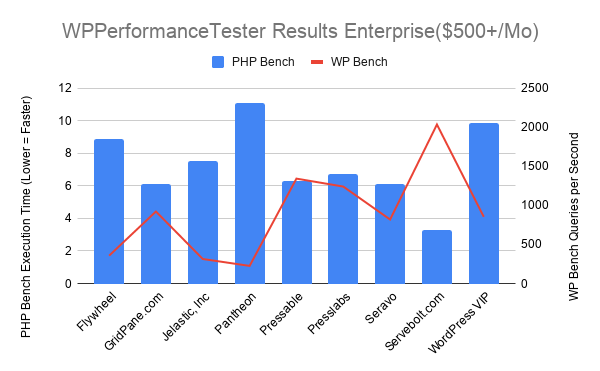
WPPerformanceTester Results
WPPerformanceTester performs two benchmarks. One is a WordPress (WP Bench) and the other a PHP benchmark. WP Bench measures how many WP queries per second and higher tends to be better (varies considerably by architecture). PHP Bench performs a lot of computational and some database operations which are measured in seconds to complete. Lower PHP Bench is better. WP Bench is blue in the chart, PHP Bench is red.
Results Table
| Company Name | PHP Bench | WP Bench |
| Flywheel | 8.852 | 357.1428571 |
| GridPane.com* | 6.093 | 923 |
| Jelastic, Inc | 7.524 | 314.861461 |
| Pantheon | 11.098 | 226.3980077 |
| Pressable | 6.284 | 1344.086022 |
| Presslabs | 6.712 | 1242.236025 |
| Seravo | 6.12 | 820.3445447 |
| Servebolt.com | 3.292 | 2037 |
| WordPress VIP | 9.875 | 854.7008547 |
Discussion
Servebolt stood out being the fastest PHP Bench and WP Bench. GridPane, Pressable, Presslabs and Seravo all had faster PHP bench scores than the second fastest company last year (Presslabs); so it's nice to see the whole field getting faster.
*GridPane.com couldn't run the WPPerformanceTester plugin because of the database layer they run wasn't compatible (LudicrousDB). The same commands were executed manually that the WPPerformanceTester does against the system to replicate the numbers.
Qualsys SSL Report Grade
The tool is available at https://www.ssllabs.com/ssltest/
Results Table
| Company Name | Qualys SSL Report |
| Flywheel | A |
| GridPane.com | A+ |
| Jelastic, Inc | A |
| Pantheon | A+ |
| Pressable | A |
| Presslabs | A+ |
| Seravo | A+ |
| Servebolt.com | B |
| WordPress VIP | A |
Discussion
GridPane, Pantheon, Presslabs and Seravo all earned A+ ratings. Every single B grade was for the following reason according to Qualsys: "This server supports TLS 1.0 and TLS 1.1. Grade capped to B."
Conclusion
Top Tier
Flywheel [Reviews], GridPane, Jelastic, Pantheon [Reviews], Pressable, Presslabs, Seravo, Servebolt and WPVIP all earned Top Tier status.
Honorable Mention
None.
Individual Host Analysis
Flywheel [Reviews]
Perfect uptime. The fastest WebPageTest average response time. Second and third fastest Load Impact and Load Storm average response speed respectively. A well deserved Top Tier performance.
GridPane
One of the new entrants in this years test, GridPane only competed at the Enterprise tier to likely send a message that says we're here and we're serious. Well the results say, welcome to the club. Perfect uptime and the second fastest Load Storm average response time combined with a miniscule 3 total errors on both load tests say GridPane is here to perform. The only improvement I would like to see is better scores on WebPageTest where outside of US/Europe it wasn't as fast as some of the competition. Overall, happy to see GridPane show us that another Top Tier Enterprise performer is here.
Jelastic
Jelastic competed in many tiers and I was excited to see them figure out a way to balance their slightly different billing scheme to fit into these tests. Their platform scaled all the way up to the Enterprise tier, showing that it can handle tremendous loads without struggling. It earned Top Tier recognition in yet another tier, well done.
Pantheon [Reviews]
Pantheon had perfect uptime and the third fastest Load Impact peak average response time. There isn't much to say other than they earned a Top Tier performance and had a nice improvement in the Load Storm test compared to last year with fewer errors and half the average response time.
Pressable
Pressable had perfect uptime and only 5 total errors on both load tests. I'd like to see faster response times globally but it was a Top Tier performance for sure.
Presslabs
This small company has participated many years and continues to impress with yet another Top Tier performance. Perfect uptime. 1 error total on the load tests was the lowest total of any company. The third fastest average response time on WebPageTest. Well done Presslabs.
Seravo
The third new Enterprise Tier entrant didn't disappoint. Seravo was neck and neck with Flywheel for the fastest average response time globally on WebPageTest. They had a total of 6 errors on excellent load tests. Welcome to the Top Tier Seravo.
Servebolt
Servebolt continued it's dominance in the WPPerformanceTester results into the Enterprise Tier being the fastest by a solid margin again on both PHP and WP Bench. They also managed the fastest average response time on Load Storm and kept a global average response time under 1000ms on WebPageTest which put them in 4th place. Another Top Tier performance by Servebolt.
WordPress.com VIP
Perfect uptime. 3 total errors across both load tests. The fastest peak average response time on Load Impact. WordPress VIP continues to deliver Top Tier performances.
Bonus Analysis
I also wondered if Load Storm tests were getting faster, so I looked against companies that participated this year and last year on the more in-depth measurements.
2020 Advanced Measurements
| Company Name | Average Response Time HTML MIME Type | Average Completion Time (accessing wp-login) |
Average Completion Time (Logging In)
|
| Flywheel | 247 | 662 | 797 |
| Pantheon | 239 | 369 | 1002 |
| Pressable | 375 | 578 | 1005 |
| Presslabs | 350 | 1093 | 1310 |
| Servebolt.com | 189 | 280 | 881 |
| WordPress VIP | 263 | 444 | 804 |
2019 Advanced Measurements
| Company | Average Response Time HTML MIME Type | Average Completion Time (accessing wp-login) |
Average Completion Time (Logging In)
|
| Flywheel | 800 | 1479 | 2881 |
| Pantheon | 739 | 870 | 2735 |
| Pressable | 940 | 1738 | 3452 |
| Presslabs | 372 | 571 | 1833 |
| Servebolt | 213 | 307 | 2068 |
| WPVIP | 262 | 297 | 703 |
2019 to 2020 Net Change in ms (Positive Numbers indicate speed increase, Negative indicate decrease)
| Company | Average Response Time HTML MIME Type | Average Completion Time (accessing wp-login) |
Average Completion Time (Logging In)
|
| Flywheel | 553 | 817 | 2084 |
| Pantheon | 500 | 501 | 1733 |
| Pressable | 565 | 1160 | 2447 |
| Presslabs | 22 | -522 | 523 |
| Servebolt | 24 | 27 | 1187 |
| WPVIP | -1 | -147 | -101 |
For the HTML MIME Type WPVIP had 1ms increase. Servebolt had 24ms decrease. Presslabs had 22ms decrease. Pressable had 565ms decrease. Pantheon had a 500ms decrease. Flywheel had a 553ms decrease. What we see is the field getting tighter, the fastest companies improved slightly (except WPVIP which had 1ms difference), but the slower companies improved dramatically to end up in the same range by 2020.
The page completion time for logging in is a huge difference. in 2019 with the exception of VPWIP, logging in took 1.8-3.4 seconds. By 2020 the slowest was 1.3 seconds. The entire field became faster than the second fastest score the previous year. I am not sure why or how this came to be, many hosts in 2019 results were probably still on PHP 7.2 and were likely on 7.4 for 2020 test. But I wouldn't expect that to account for that dramatic a difference in results.
Whatever the case may be, it's nice to see even at the highest end there are dramatic improvements being made to the performance which a little closer look could unveil.
Kevin Ohashi
Latest posts by Kevin Ohashi (see all)
- Analyzing Digital Ocean’s First Major Move with Cloudways - February 28, 2023
- Removing old companies - June 28, 2021
- WordPress & WooCommerce Hosting Performance Benchmarks 2021 - May 27, 2021
 WordPress & WooCommerce Hosting Performance Benchmarks 2021
 WooCommerce Hosting Performance Benchmarks 2020
 WordPress Hosting Performance Benchmarks (2020)
 The Case for Regulatory Capture at ICANN
 WordPress Hosting – Does Price Give Better Performance?
 Hostinger Review – 0 Stars for Lack of Ethics
 The Sinking of Site5 – Tracking EIG Brands Post Acquisition
 Dirty, Slimy, Shady Secrets of the Web Hosting Review (Under)World – Episode 1
 Free Web Hosting Offers for Startups