
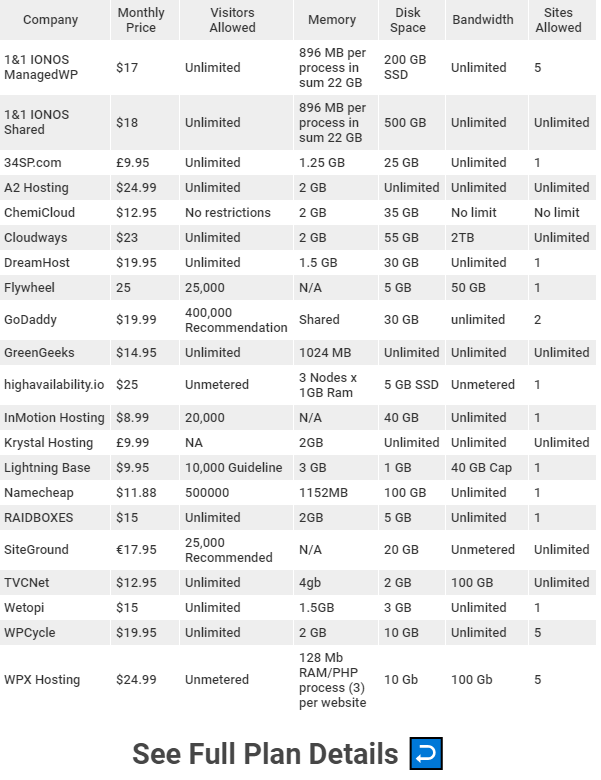
The full company list, product list, methodology, and notes can be found here.
This post focuses only on the results of the testing in the <$25/month price bracket for WordPress Hosting.
Contents
Other Price Tier Results
<$25/Month Tier$25-50/Month Tier$51-100/Month Tier$101-200/Month Tier$201-500/Month Tier$500+/Month (Enterprise) TierHosting Plan Details
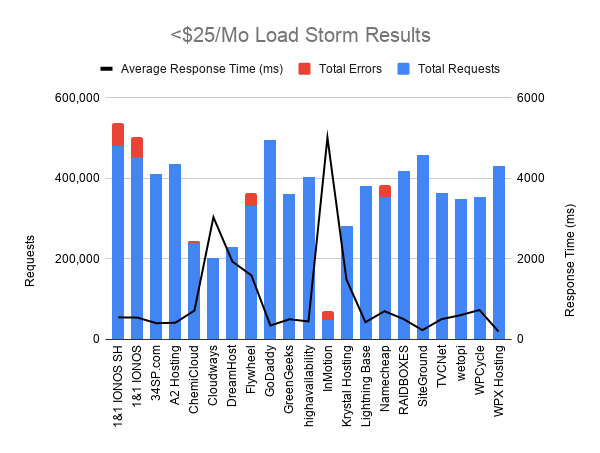
Load Storm Testing Results
Load Storm is designed to simulate real users visiting the site, logging in and browsing. It tests uncached performance.
Results Table
| Company Name | Total Requests | Total Errors | Peak RPS | Average RPS | Peak Response Time(ms) | Average Response Time (ms) | Total Data Transferred (GB) | Peak Throughput (MB/s) |
Average Throughput (MB/s)
|
| 1&1 IONOS SH | 481,654 | 56,401 (11.71%) | 358 | 268 | 15,364 | 550.00 | 18.53 | 14 | 10 |
| 1&1 IONOS WP | 452,544 | 50,290 (11.11%) | 340 | 251 | 15,403 | 545.00 | 20.14 | 15 | 11 |
| 34SP.com | 410,619 | 8 (0%) | 302 | 228 | 15,102.00 | 405.00 | 22 | 16 | 12 |
| A2 Hosting | 435,908 | 0 (0%) | 322 | 242 | 8,036 | 418.00 | 22.88 | 17 | 13 |
| ChemiCloud | 239,019 | 5,114 (2.14%) | 178 | 133 | 16,425 | 719.00 | 13.58 | 11 | 7.545 |
| Cloudways | 201,602 | 0 (0%) | 156 | 112 | 12,351 | 3,038.00 | 10.69 | 7.508 | 5.938 |
| DreamHost | 230,279 | 0 (0%) | 164 | 128 | 10,634 | 1,935.00 | 12.42 | 8 | 7 |
| Flywheel | 331,992 | 31,421 (9.46%) | 312 | 184 | 15,331 | 1,592.00 | 17.13 | 16 | 9.517 |
| GoDaddy | 495,189 | 151 (0.03%) | 370 | 275.11 | 15,156.00 | 348.00 | 32 | 24.43 | 18.02 |
| GreenGeeks | 361,071 | 2 (0%) | 268 | 201 | 13,667 | 503.00 | 21.65 | 16 | 12 |
| highavailability.io | 404,625 | 0 (0%) | 306 | 225 | 2,803 | 450.00 | 22.17 | 17 | 12 |
| InMotion Hosting | 47,156 | 22,448 (47.6%) | 43 | 26 | 15,100 | 5,017.00 | 1.048 | 1.839 | 582 |
| Krystal Hosting | 281,548 | 8 (0%) | 199.05 | 156.42 | 15,088.00 | 1,492 | 15.93 | 11.22 | 9 |
| Lightning Base | 381,503 | 15 (0%) | 283 | 212 | 2,128.00 | 430.00 | 23 | 17 | 13 |
| Namecheap | 352,979 | 29,498 (8.36%) | 256.60 | 196.10 | 15,647 | 704 | 19.01 | 13.65 | 10.56 |
| RAIDBOXES | 418,365 | 0 (0%) | 311 | 232 | 5,025 | 510.00 | 22.11 | 16 | 12 |
| SiteGround | 458,689 | 6 (0%) | 342 | 255 | 5,548 | 233.00 | 24.26 | 18 | 13 |
| TVCNet | 363,804 | 144 (0.04%) | 266 | 202 | 15,090 | 506.00 | 22.20 | 16 | 12 |
| wetopi | 348,065 | 1,303 (0.37%) | 255 | 193 | 4,093 | 604.00 | 21.18 | 16 | 12 |
| WPCycle | 353,996 | 155 (0.04%) | 245.53 | 196.66 | 10,649 | 734 | 19.12 | 13.51 | 10.62 |
| WPX Hosting | 431,846 | 94 (0.02%) | 331 | 240 | 15,103.00 | 200.00 | 24 | 18 | 13 |
Full interactive results can be referenced here.
Discussion
34SP, A2 Hosting [Reviews], DreamHost [Reviews], GoDaddy [Reviews], GreenGeeks, HighAvailability, Krystal Hosting, LightningBase, Raidboxes, SiteGround [Reviews], TVC.Net, WPCycle and WPX Hosting all handled the Load Storm test without any issues. Wetopi had a few errors but overall quite good at a minimal 0.37% error rate.
1&1 IONOS [Reviews] appeared to have security features that couldn't be worked around, they maintained a constant response time and error rate. ChemiCloud had some wp-login security issues and hit the limitations of the plan. Cloudways [Reviews] slowed down and response times increased. Flywheel [Reviews] was overwhelmed by the test. InMotion Hosting was overwhelmed by the test as well. NameCheap struggled to keep up with the test.
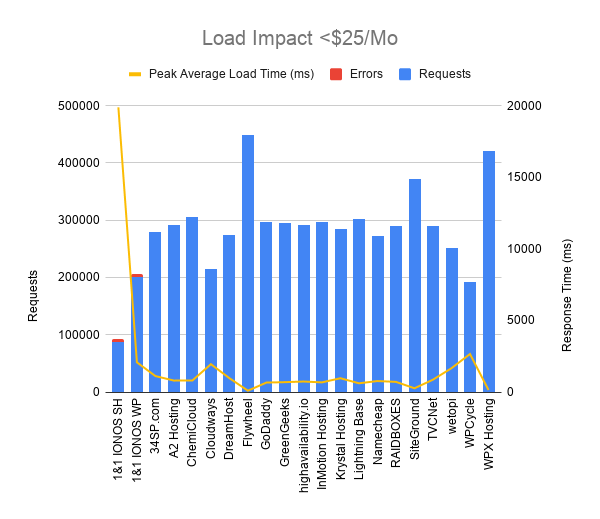
Load Impact Testing Results
Load Impact is designed to test cached performance by repeatedly requesting the homepage.
Results Table
| Company Name | Requests | Errors | Data Transferred (GB) | Peak Average Load Time (ms) | Peak Average Bandwidth (Mbps) | Peak Average Requests/Sec |
| 1&1 IONOS SH | 88122 | 5000+ | 2.82 | 19880 | 31.77 | 149 |
| 1&1 IONOS WP | 201426 | 5000+ | 3.26 | 2080 | 36.53 | 469 |
| 34SP.com | 279521 | 0 | 15.6 | 1120 | 255.15 | 558 |
| A2 Hosting | 292246 | 0 | 16.11 | 806 | 275.65 | 611 |
| ChemiCloud | 306073 | 0 | 17.18 | 811 | 291.44 | 634 |
| Cloudways | 214197 | 0 | 12.07 | 1950 | 148.96 | 323 |
| DreamHost | 274541 | 0 | 15.27 | 973 | 233.27 | 512 |
| Flywheel | 449336 | 0 | 25.14 | 98 | 373.07 | 814 |
| GoDaddy | 296631 | 45 | 17.17 | 667 | 282.93 | 597 |
| GreenGeeks | 295891 | 0 | 16.53 | 695 | 280.29 | 612 |
| highavailability.io | 292341 | 0 | 15.97 | 739 | 274.08 | 613 |
| InMotion Hosting | 296197 | 0 | 16.44 | 680 | 274.05 | 603 |
| Krystal Hosting | 283924 | 10 | 16.2 | 969 | 279.19 | 597 |
| Lightning Base | 301142 | 0 | 17.08 | 615 | 296.54 | 638 |
| Namecheap | 272882 | 1 | 15.47 | 773 | 266.92 | 575 |
| RAIDBOXES | 289123 | 0 | 16.01 | 715 | 244.69 | 540 |
| SiteGround | 371422 | 0 | 20.63 | 268 | 324.13 | 712 |
| TVCNet | 289373 | 0 | 16.1 | 868 | 277.08 | 608 |
| wetopi | 251680 | 0 | 14.07 | 1670 | 195.62 | 427 |
| WPCycle | 191512 | 0 | 10.64 | 2660 | 123.23 | 271 |
| WPX Hosting | 420843 | 3 | 23.58 | 151 | 393.27 | 857 |
Full interactive results can be referenced here.
Discussion
A2 Hosting, ChemiCloud, Flywheel, GoDaddy, GreenGeeks, High Availability, InMotion Hosting, LightningBase, Namecheap, Raidboxes, SiteGround, TVCNet, and WPX Hosting all handled the Load Impact test without any issues.
34SP had a couple spikes but overall did pretty well. DreamHost saw some small spikes and increased response times. Krystal generally handled it well except for a couple spikes.
Cloudways, Wetopi and WPCycle didn't error out but saw a substantial increase in response times.
1&1 IONOS had over 5000 errors on each test and slow response times which the company said was due to its webshield security features which couldn't be turned off.
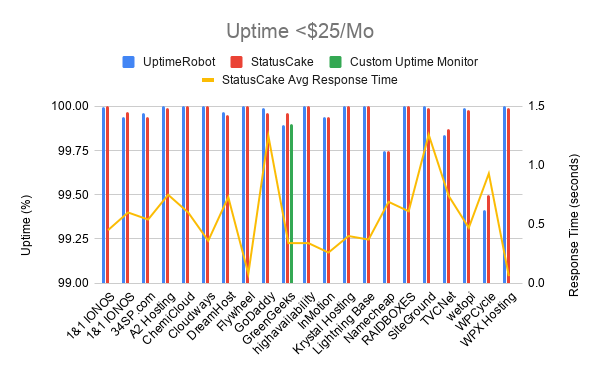
Uptime Monitoring Results
Uptime is monitored by two companies: Uptime Robot and StatusCake. A self hosted monitor was also run in case there was a major discrepancy between the two third party monitors.
Results Table
| Company Name | UptimeRobot | StatusCake | StatusCake Avg Response Time | Custom Uptime Monitor |
| 1&1 IONOS SH | 99.994 | 100 | 0.45 | |
| 1&1 IONOS WP | 99.94 | 99.97 | 0.6 | |
| 34SP.com | 99.963 | 99.94 | 0.54 | |
| A2 Hosting | 100 | 99.99 | 0.75 | |
| ChemiCloud | 100 | 100 | 0.6 | |
| Cloudways | 100 | 100 | 0.36 | |
| DreamHost | 99.97 | 99.95 | 0.73 | |
| Flywheel | 100 | 100 | 0.08 | |
| GoDaddy | 99.993 | 99.96 | 1.25 | |
| GreenGeeks | 99.894 | 99.96 | 0.34 | 99.9 |
| highavailability.io | 99.999 | 100 | 0.34 | |
| InMotion Hosting | 99.938 | 99.94 | 0.26 | |
| Krystal Hosting | 99.999 | 100 | 0.4 | |
| Lightning Base | 100 | 100 | 0.37 | |
| Namecheap | 99.748 | 99.75 | 0.69 | |
| RAIDBOXES | 99.999 | 100 | 0.61 | |
| SiteGround* | 100 | 99.99 | 1.26 | |
| TVCNet | 99.84 | 99.87 | 0.74 | |
| wetopi | 99.992 | 99.98 | 0.47 | |
| WPCycle | 99.414 | 99.5 | 0.93 | |
| WPX Hosting | 99.999 | 99.99 | 0.06 |
Discussion
Most companies did fine maintaining above 99.9% uptime.
GreenGeeks had conflicting monitors of 99.96% and 99.894%, so a tiebreak monitor was checked which showed 99.9% making it the most borderline result I've ever encountered.
Namecheap, TVCNet and WPCycle experienced downtime which kept them below 99.9% threshold.
*SiteGround had one downtime event which was caused by me not verifying the test domain which I discounted from the uptime monitoring.
WebPageTest.org Results
WebPageTest fully loads the homepage and records how long it takes from 11 different locations around the world.
Results Table
Results table can be referenced here. The radar chart does an excellent job without hiding any information.
Discussion
Flywheel is the obvious standout being the fastest from 9/12 testing locations. DreamHost also stands out as the second fastest in many locations and the fastest in a couple. No company stood out as obviously the slowest around the world which is a good sign.
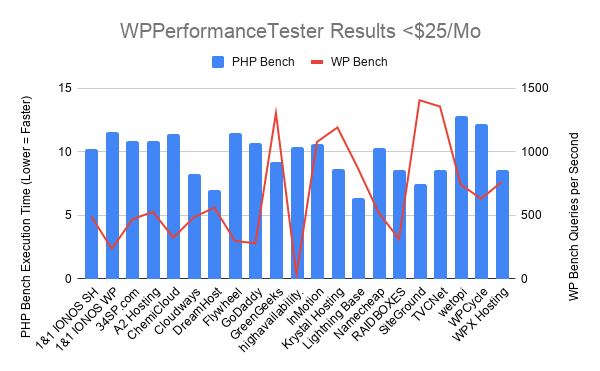
WPPerformanceTester Results
WPPerformanceTester performs two benchmarks. One is a WordPress (WP Bench) and the other a PHP benchmark. WP Bench measures how many WP queries per second and higher tends to be better (varies considerably by architecture). PHP Bench performs a lot of computational and some database operations which are measured in seconds to complete. Lower PHP Bench is better. WP Bench is blue in the chart, PHP Bench is red.
Results Table
| Company Name | PHP Bench | WP Bench |
| 1&1 IONOS SH | 10.238 | 490.6771344 |
| 1&1 IONOS WP | 11.52 | 235.349494 |
| 34SP.com | 10.868 | 468.164794 |
| A2 Hosting | 10.875 | 527.1481286 |
| ChemiCloud | 11.437 | 323.5198965 |
| Cloudways | 8.222 | 484.9660524 |
| DreamHost | 7.01 | 560.2240896 |
| Flywheel | 11.446 | 297.7963073 |
| GoDaddy | 10.712 | 279.173646 |
| GreenGeeks | 9.211 | 1305.483029 |
| highavailability.io | 10.396 | 30.6335008 |
| InMotion Hosting | 10.633 | 1077.586207 |
| Krystal Hosting | 8.636 | 1191.895113 |
| Lightning Base | 6.369 | 870.3220191 |
| Namecheap | 10.277 | 522.7391532 |
| RAIDBOXES | 8.546 | 312.1098627 |
| SiteGround | 7.43 | 1406.469761 |
| TVCNet | 8.592 | 1356.852103 |
| wetopi | 12.801 | 744.6016381 |
| WPCycle | 12.164 | 629.7229219 |
| WPX Hosting | 8.533 | 761.614623 |
Discussion
LightingBase and DreamHost stand out as the fastest PHP Bench scores. The WP Bench provides some interesting insight about why it may not correlate to performance at scale. High Availability has the slowest score by an order of magnitude but that's almost surely due to the high availability architecture which allowed it to handle all the load testing with ease.
Qualsys SSL Report Grade
The tool is available at https://www.ssllabs.com/ssltest/
Results Table
| Company Name | Qualys SSL Report |
| 1&1 IONOS SH | B |
| 1&1 IONOS WP | B |
| 34SP.com | A |
| A2 Hosting | A+ |
| ChemiCloud | A |
| Cloudways | B |
| DreamHost | B |
| Flywheel | A |
| GoDaddy | B |
| GreenGeeks | A+ |
| highavailability.io | B |
| InMotion Hosting | B |
| Krystal Hosting | A |
| Lightning Base | A |
| Namecheap | A+ |
| RAIDBOXES | A+ |
| SiteGround | A |
| TVCNet | A |
| wetopi | B |
| WPCycle | A+ |
| WPX Hosting | A |
Discussion
A2, GreenGeeks, Namecheap, Raidboxes and WPCycle all earned A+ ratings. Every single B grade was for the following reason according to Qualsys: "This server supports TLS 1.0 and TLS 1.1. Grade capped to B."
Conclusion
Top Tier
This year's top tier WordPress Hosting Performance in the <$25/month category go to the following companies who showed virtually no signs of struggle during the testing.
A2 Hosting [Reviews], GoDaddy [Reviews], HighAvailability, LightningBase, Raidboxes, SiteGround [Reviews] and WPX Hosting.
Honorable Mention
The following companies earned Honorable Mention status because they did very well and had a minor issue or two holding them back from earning Top Tier status.
34SP.com, DreamHost [Reviews], GreenGeeks, and Krystal Hosting.
Individual Host Analysis
1&1 IONOS Shared / WordPress [Reviews]
1&1's performance may have been marred by security measures which couldn't be disabled on both load tests. There may have been issues with handling the traffic too, it's hard to tell. But the problems on Load Storm and Load Impact tests held them back this year. The bright spot was the 99.99/100% uptime recorded by the shared plan.
34SP.com
This is the third year of participation for 34SP.com and it's fantastic to see them earn an honorable mention status this year. Last year they were almost there. A few spikes in the Load Impact testing kept them out of top tier status this time. Next year I hope to see them earning top tier status as they continue to improve.
A2 Hosting [Reviews]
A2 stepped up their game this year after struggling with Load Storm last year going from a 0.57% error rate to a perfect zero errors. With the uptime monitors showing 100 and 99.99% uptime, A2 earned Top Tier honors this year.
ChemiCloud
ChemiCloud is a first time participant and did an admirable job with perfect 100% uptime on both monitors. They handled the Load Impact test without issue but the Load Storm test proved to be a bit too much with a 2% error rate. I hope to see them return and make small improvements to do better next year.
Cloudways [Reviews] (Vultr 2GB)
Cloudways had perfect uptime at 100% on both monitors. The good news during the load tests were that they didn't have a single error. The bad news during the load tests was the response times increased substantially and the server slowed down under stress.
DreamHost [Reviews]
DreamHost did very well this year earning themselves an honorable mention. Their uptime exceeded the 99.9% threshold and their Load Storm test was excellent. The issue was Load Impact which slowed down and saw some small spikes as the test progressed but there were no errors. They also had some of the fastest response times on WebPageTest being first twice and second five times out of the 12 geographical locations.
Flywheel [Reviews]
Flywheel's smallest plan got knocked down by Load Storm again. The test may be too much for the plan. The good news was the perfect uptime and being one of the fastest response times around the world a whopping nine out of twelve times.
GoDaddy [Reviews]
A surprise from a company that is responsible for these tests ever being performed. GoDaddy recovered after last years less than ideal performance with a Top Tier performance this year. Their uptime was above 99.9% which was a problem last year. The load testing results didn't show much issue with the load this year once the security measures were worked around and they even handled the most total requests on Load Storm. Glad to see GoDaddy's engineering team doing well again.
GreenGeeks
GreenGeeks earned an honorable mention this year, a slight downgrade from last year's Top Tier honor. This was perhaps the most on the edge decision I've had to make. Their results on the load tests were good but the uptime monitors showed 99.96% and 99.894%. I added a third monitor this year in case something like this happened again to act as a tie breaker and it showed 99.9%, the exact threshold I keep between doing well enough and failure. Considering how borderline it was, I opted to give honorable mention status because the Top Tier companies unambiguously didn't struggle with any tests. Overall, it was a very good showing from GreenGeeks but they were kept out by the slimmest margin from earning Top Tier status this year.
HighAvailability
Formerly Incendia Web Works, this multiple time participant is back in the Top Tier. Their 99.999% and 100% uptimes combined with doing well on the load tests showed they are highly available. The one test which made it clear that they were doing something different at this tier is the WPPerformanceTester WP Bench test where they have a very low score. One reason I don't use it as a meaningful metric is because of how architectures might impact the results. Latency between the database(s) and the web server will cause dramatic differences in the results and the load tests made it clear how real world performance may not correlate strictly with the WP bench result against other architectures. Great job by HighAvailability this year earning Top Tier status.
InMotion Hosting
InMotion Hosting was brought down by Load Storm's test. Their uptime was above 99.9%. My contact there stopped responding and I wasn't ever able to get more details about any issues the server might have had security wise. Hopefully next time they will do better.
Krystal Hosting
A second year entrant that almost earned honorable mention status last year, got over the hump and earned honorable mention status this year. The struggle was the Load Impact test again where last year it seemed to cause a bit too much stress, this year it was nearly under control with a spike keeping it just out of Top Tier status. The continued improvement from Krystal is excellent to see and I hope to see them be Top Tier next year.
LightningBase
Another year, another Top Tier honor for LightningBase. Perfect uptime. Only 15 errors total on Load Storm and perfect on Load Impact. LightningBase continue to be a model of consistent top tier performance. Congratulations for the longest streak of Top Tier honors of any company that has participated in these tests.
NameCheap
It's nice to see a new entrant step into the ring. They almost participated last year, but finally bit the bullet in 2020. True to their name, they are one of the cheapest plans that competed in the cheapest price tier. They handled the Load Impact test well but sadly the uptime monitors were not kind where they experienced some network wide outages during the testing. The Load Storm test also proved to be too much for their containers but it failed gracefully with the requests that were making it through respond very quickly. I hope to see NameCheap return next year and deliver even better performance and value.
Raidboxes
It's always nice to see a first time entrant just do flawlessly. With a whopping 0 total errors on their load tests and 99.999% and 100% on their uptime monitors, it's hard to ask for a better performance. Welcome to the show Raidboxes and congratulations on earning your first Top Tier honor, may you earn many more in the years to come.
SiteGround [Reviews]
SiteGround earned itself Top Tier status again this year after earning Honorable Mention status last year. The small issues with Load Storm tests seem to have disappeared and the uptime was excellent. Congrats to SiteGround on returning to Top Tier status.
TVC.Net
TVC's second year participating. Last year they struggled with Load Impact, but they did excellent on both load tests this year. What held them back this year is they were just below the 99.9% uptime threshold at 99.87% and 99.84%. Hopefully it was just a little bit of bad luck and next year will see them earn Top Tier status.
Wetopi
Wetopi was another new entrant into the testing. As far as first performances go, Wetopi did pretty decently. Load Storm had a few errors. Load Impact had no errors but the response time elevated quite substantially by around 1s over the course of the test. The uptime was excellent. Handling Load Impact a little better would have earned them Honorable Mention status. Here's to hoping they improve earn some recognition next year.
WPCycle
The final new entrant in this years testing. Unfortunately WPCycle struggled with uptime and the Load Impact test. They did do very well on the Load Storm test which is a solid start considering it's often the most stressful load test. Hoping to see big improvements next year.
WPX Hosting
WPX Hosting earned another Top Tier award this year. There's not much to say, 99.999% uptime and almost perfect load tests will do that. Congrats on the repeat, keep up the excellent work.
Kevin Ohashi
Latest posts by Kevin Ohashi (see all)
- Analyzing Digital Ocean’s First Major Move with Cloudways - February 28, 2023
- Removing old companies - June 28, 2021
- WordPress & WooCommerce Hosting Performance Benchmarks 2021 - May 27, 2021
 WordPress & WooCommerce Hosting Performance Benchmarks 2021
 WooCommerce Hosting Performance Benchmarks 2020
 WordPress Hosting Performance Benchmarks (2020)
 The Case for Regulatory Capture at ICANN
 WordPress Hosting – Does Price Give Better Performance?
 Hostinger Review – 0 Stars for Lack of Ethics
 The Sinking of Site5 – Tracking EIG Brands Post Acquisition
 Dirty, Slimy, Shady Secrets of the Web Hosting Review (Under)World – Episode 1
 Free Web Hosting Offers for Startups
Hello Kevin, thanks for this analysis, can you please also analyze Bigscoots as well. Thank you
If they opt-in, sure 🙂