Tag Archives: a2

A2, CloudWays, Heart Internet, HostPapa, OVH, Pantheon, ScaleWay and TsoHost Added to Review Signal

Happy to announce a lot of new additions to Review Signal including our first UK companies (HeartInternet and TsoHost). UK companies are displayed with a UK flag in search results and on the company pages.

Overall score is in parentheses after the company.

A2 Hosting (49%)

CloudWays (65%)

HeartInternet (28%)

HostPapa (27%)

OVH (38%)

Pantheon (77%)

ScaleWay (62%)

Tsohost (70%)


$101-200/Month WordPress Hosting Performance Benchmarks (2016)

LoadStormLogo

Sponsored by LoadStorm. The easy and cost effective load testing tool for web and mobile applications.

The full company list, product list, methodology, and notes can be found here

This post focuses only on the results of the testing in the $101-200/month price bracket for WordPress Hosting.

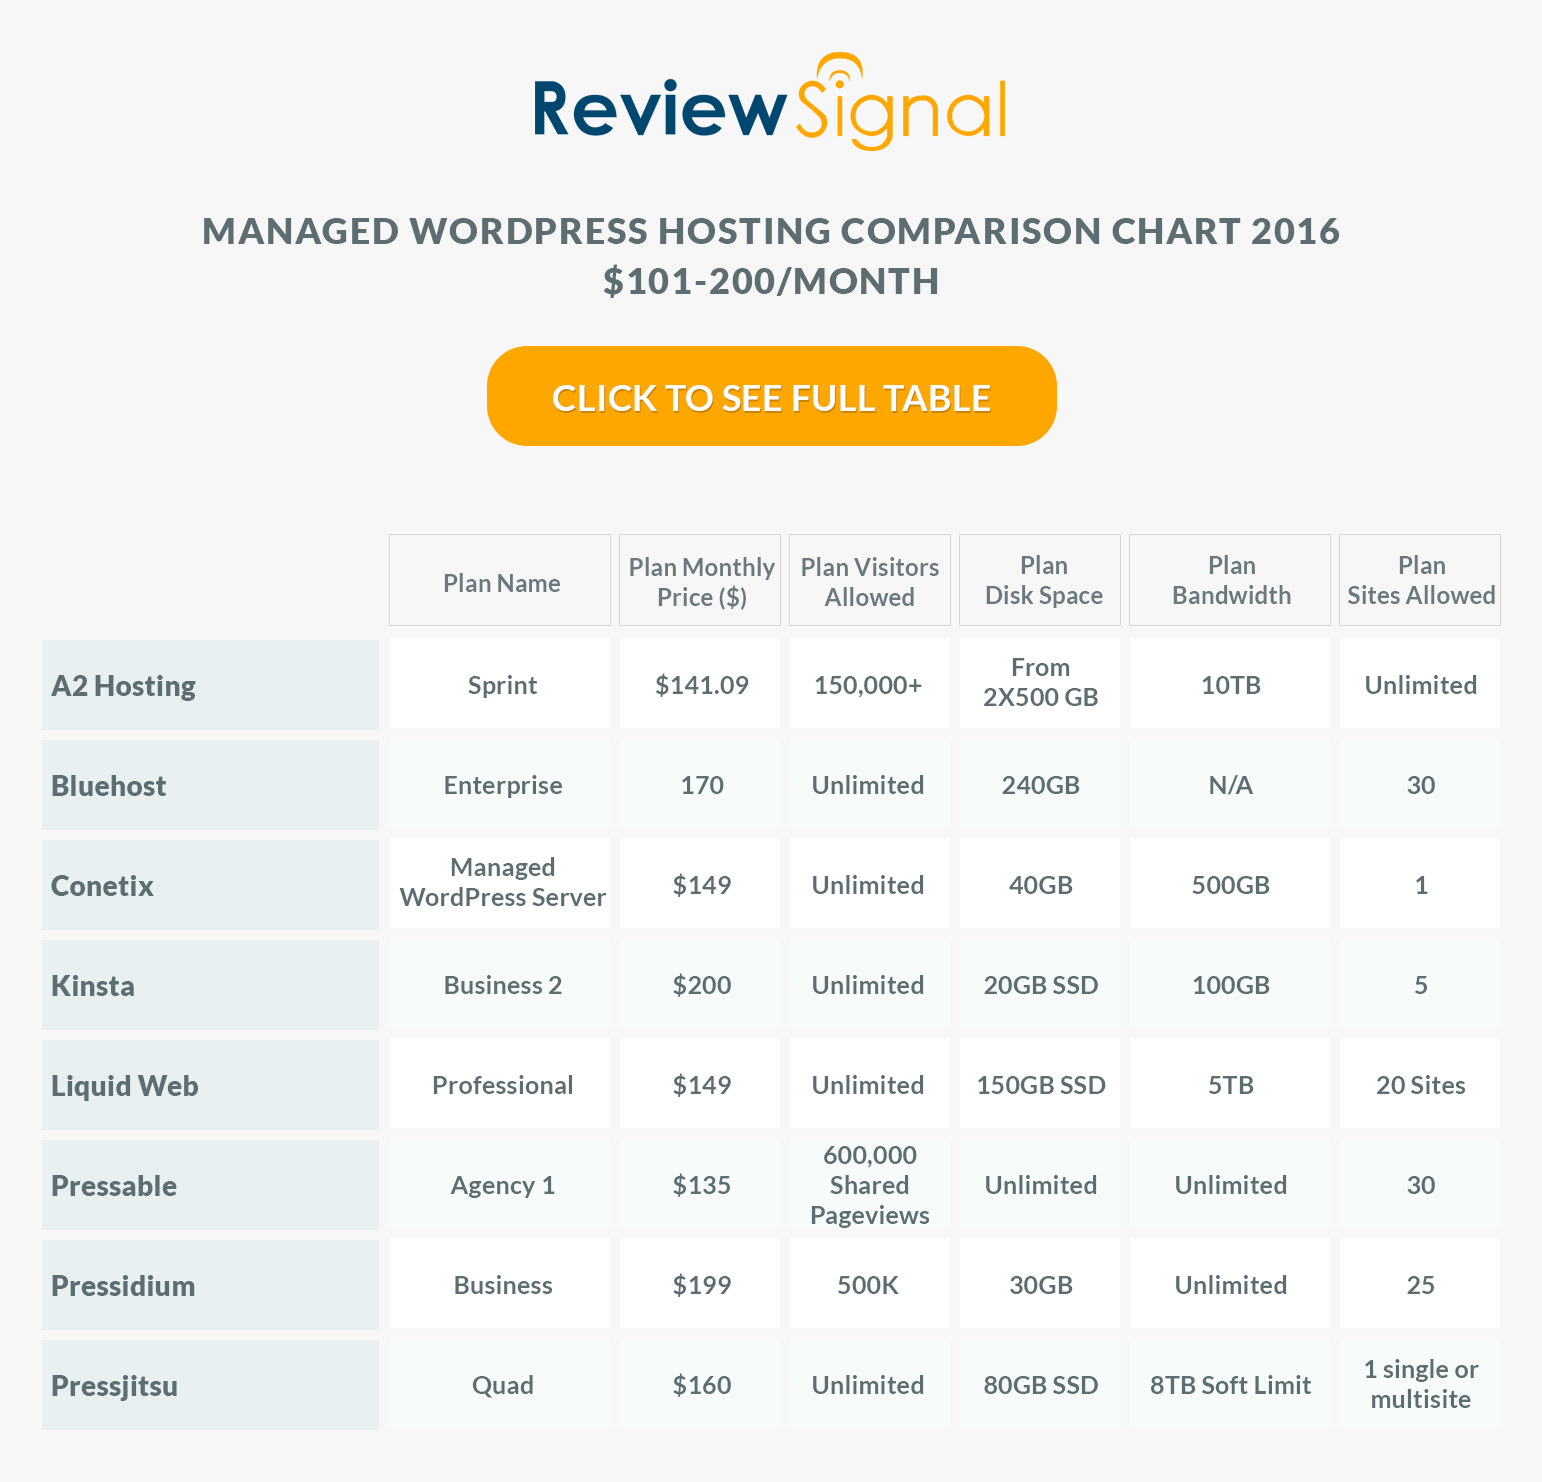
$101-200/Month WordPress Hosting Products

review_signal_table_200

$101-200/Month WordPress Hosting Performance Benchmarks Results

1. Load Storm

Test 500-4000 Concurrent Users over 30 Minutes, 10 Minutes at Peak

Company Total Requests Total Errors Peak RPS Average RPS Peak Response Time(ms) Average Response Time(ms) Total Data Transferred (GB) Peak Throughput (MB/s) Average Throughput (MB/s)
A2 363070 163790 264.15 201.71 15443 6857 11.75 13.88 6.528
BlueHost 322139 166336 267.9 178.97 20999 9268 9.42 7.09 5.24
Conetix 341733 145110 243.3 189.85 16202 7347 11.74 13.87 6.52
Kinsta 546252 0 425.67 303.47 9078 286 31.47 24.95 17.48
LiquidWeb 635893 76 490.78 353.27 15097 360 31.3 25.19 17.39
Pressable 724499 1090 562.12 402.5 15024 447 30.91 26.07 17.17
Pressidium 563624 0 435.43 313.12 3561 272 30.82 24.44 17.12
Pressjitsu 434368 41339 339.37 241.32 15605 3173 22.5 18.67 12.5

Discussion of Load Storm Test Results

KinstaLiquidWeb [Reviews], Pressable, and Pressidium had no problems with this test.

A2 Hosting [Reviews], BlueHost [Reviews], Conetix, and Pressjitsu struggled with this test. BlueHost struggled off the bat. A2 and Conetix struggled a couple minutes in. Pressjitsu made it about 12 minutes in before it started erroring, but it had increasing load times starting around 6 minutes in. They all lasted varying amounts of time, but none were ready to handle this sort of load.

2. Blitz.io

Test 1-3000 Concurrent Users over 60 seconds

Blitz Test Quick Results Table

Company Hits Errors Timeouts Average Hits/Second Average Response Time Fastest Response Slowest Response
A2 120 43508 21784 2 518 304 733
BlueHost 28568 11753 7945 476 929 192 1889
Conetix 155 16827 13990 3 1470 872 2184
Kinsta 81397 3 0 1357 84 83 85
LiquidWeb 81393 47 10 1357 80 76 118
Pressable 77652 0 4 1294 134 141 133
Pressidium 85916 6 0 1432 27 25 31
Pressjitsu 67297 5833 0 1122 208 205 236

Discussion of Blitz Test 1 Results

This test is just testing whether the company is caching the front page and how well whatever caching system they have setup is performing (generally this hits something like Varnish or Nginx).

Who performed without any major issues?

KinstaLiquidWeb [Reviews], Pressable, and Pressidium all handled this test without issue, again.

Who had some minor issues?

Pressjitsu kept a flat response time but had a lot of errors start to build as the test scaled up. Might have been a security measure blocking it.

Who had some major issues?

BlueHost [Reviews] managed to last about 22 seconds before it started to be impacted by the load.

A2 Hosting and Conetix were overloaded almost immediately.

3. Uptime Monitoring

Both uptime monitoring solutions were third party providers that offer free services. UptimeRobot was paid for and monitoring on a 1 minute interval. All the companies were monitored over approximately two months (May-June 2016).

Uptime Robot & StatusCake

Company StatusCake UptimeRobot
A2 99.64 100
BlueHost 100 99.99
Conetix 99.52 99.7
Kinsta 99.98 99.99
LiquidWeb 100 100
Pressable 99.96 99.94
Pressidium 99.97 99.99
Pressjitsu 99.99 99.99

Conetix had some uptime issues getting recorded for 99.52% and 99.7% on StatusCake and UptimeRobot respectively.

A2 had a very strange recording with UptimeRobot showing 100% and StatusCake recording 99.64%.

Everyone else maintained above 99.9% on both monitors.

4. WebPageTest.org

Every test was run with the settings: Chrome Browser, 9 Runs, native connection (no traffic shaping), first view only.

Company WPT Dulles WPT Denver WPT LA WPT London WPT Frankfurt WPT South Africa
A2 0.924 0.654 1.199 1.554 1.989 5.118
BlueHost 0.969 0.588 0.988 1.684 2.006 6.23
Conetix 2.703 2.026 2.194 3.372 3.339 6.964
Kinsta 0.817 0.577 0.982 1.15 1.721 5.081
LiquidWeb 0.887 0.578 1.059 1.179 1.748 4.227
Pressable 0.969 0.738 1.135 1.493 1.95 7.669
Pressidium 0.639 0.627 1.174 1.187 1.705 5.303
Pressjitsu 0.915 0.677 0.87 1.302 1.786 6.433
Company WPT Singapore WPT Shanghai WPT Japan WPT Sydney WPT Brazil
A2 2.618 22.224 2.114 2.592 2.162
BlueHost 2.247 22.406 1.937 1.755 2.22
Conetix 3.092 22.465 2.818 1.493 3.448
Kinsta 2.054 22.743 2.064 1.704 2.345
LiquidWeb 2.215 22.378 1.983 1.977 1.823
Pressable 2.476 22.395 2.146 2.879 2.479
Pressidium 2.08 22.461 2.053 1.893 1.803
Pressjitsu 2.172 22.317 1.701 1.871 2.19

Everyone was pretty fast around the world without huge red flags anywhere.

Conetix had slow scores to a lot of locations, but thankfully they were the fastest in Sydney (because they are focused on the Australian market and based there).

5. WPPerformanceTester

Company PHP Bench [Seconds] (lower=faster) WP Bench [Queries Per Second](higher=faster)
A2 9.336 1440.92
BlueHost 12.276 956.94
Conetix 12.019 418.76
Kinsta 11.458 330.58
LiquidWeb 7.122 1102.54
Pressable 10.788 514.13
Pressidium 10.739 281.14
Pressjitsu 12.3 574.38

At this mid-range tier we see pretty much only VPS/Dedicated and cloud/clustered solutions. LiquidWeb's VPS again got one of the fastest PHP Bench scores I've seen recorded. The VPS/Dedicateds also generally put up much faster WP Bench scores with A2 leading the way with their dedicated server. The Cloud/Clustered solutions were around 500 and below (Kinsta, Pressable, Pressidium). The only exception was Conetix which was a VPS.

Conclusion

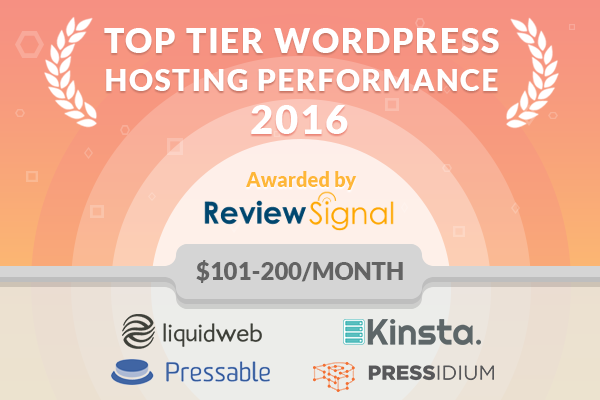
Top Tier WordPress Hosting Performance

review_signal_2016_trophy_200

KinstaLiquidWeb [Reviews], Pressable, and Pressidium were the top tier in the $101-200/month price range.

Individual Host Analysis

A2 Hosting [Reviews]

The bright spot in this test was the WP Bench test where this dedicated server was way faster than the competition. The raw power of a dedicated machine is nice, but unless it's got all the extra caching software that the top tier hosts were running, it unfortunately fell flat in the load tests.

BlueHost [Reviews]

Another disappointing performance in the load tests. The uptime and other tests were fine.

Conetix

Overall, they didn't perform that well. Uptime wasn't on par and the load test results were disappointing. The only bright spot was they were the fastest in Australia.

(9/19/2019 Update) Conetix have issued their own statement regarding Review Signal's test and why they believe this methodology doesn't accurately represent their performance and why a unique Australian perspective is required when evaluating them. I recommend reading the full details.

Kinsta

Kinsta continues to earn top tier status. I can't find anything to say beyond the fact they performed near perfectly, again.

LiquidWeb [Reviews]

LiquidWeb's lower priced plan performed spectacularly, their higher end product only continued that trend. They had a bracket leading PHP bench, perfect uptime, and aced the load tests. LiquidWeb has easily gone from brand new to top tier WordPress hosting status this year.

Pressable

Pressable continues its trend of excellent load tests, but at this tier they put everything together and earned themselves top tier status.

Pressidium

Another test, another top tier performance. Not much to say beyond, excellent.

Pressjitsu

Pressjitsu did better than the other companies that didn't earn top tier status, but found themselves clearly below the top tier with some struggles in the load tests. It seems like security may have messed up the blitz test but the same can't be said about the LoadStorm which showed real signs of stress. It seems like a good foundation but they need to just get everything running a bit better to earn themselves the top tier recognition; hopefully next year.

$25-50/Month WordPress Hosting Performance Benchmarks (2016)

LoadStormLogo

Sponsored by LoadStorm. The easy and cost effective load testing tool for web and mobile applications.

The full company list, product list, methodology, and notes can be found here

This post focuses only on the results of the testing in the $25-50/month price bracket for WordPress Hosting.

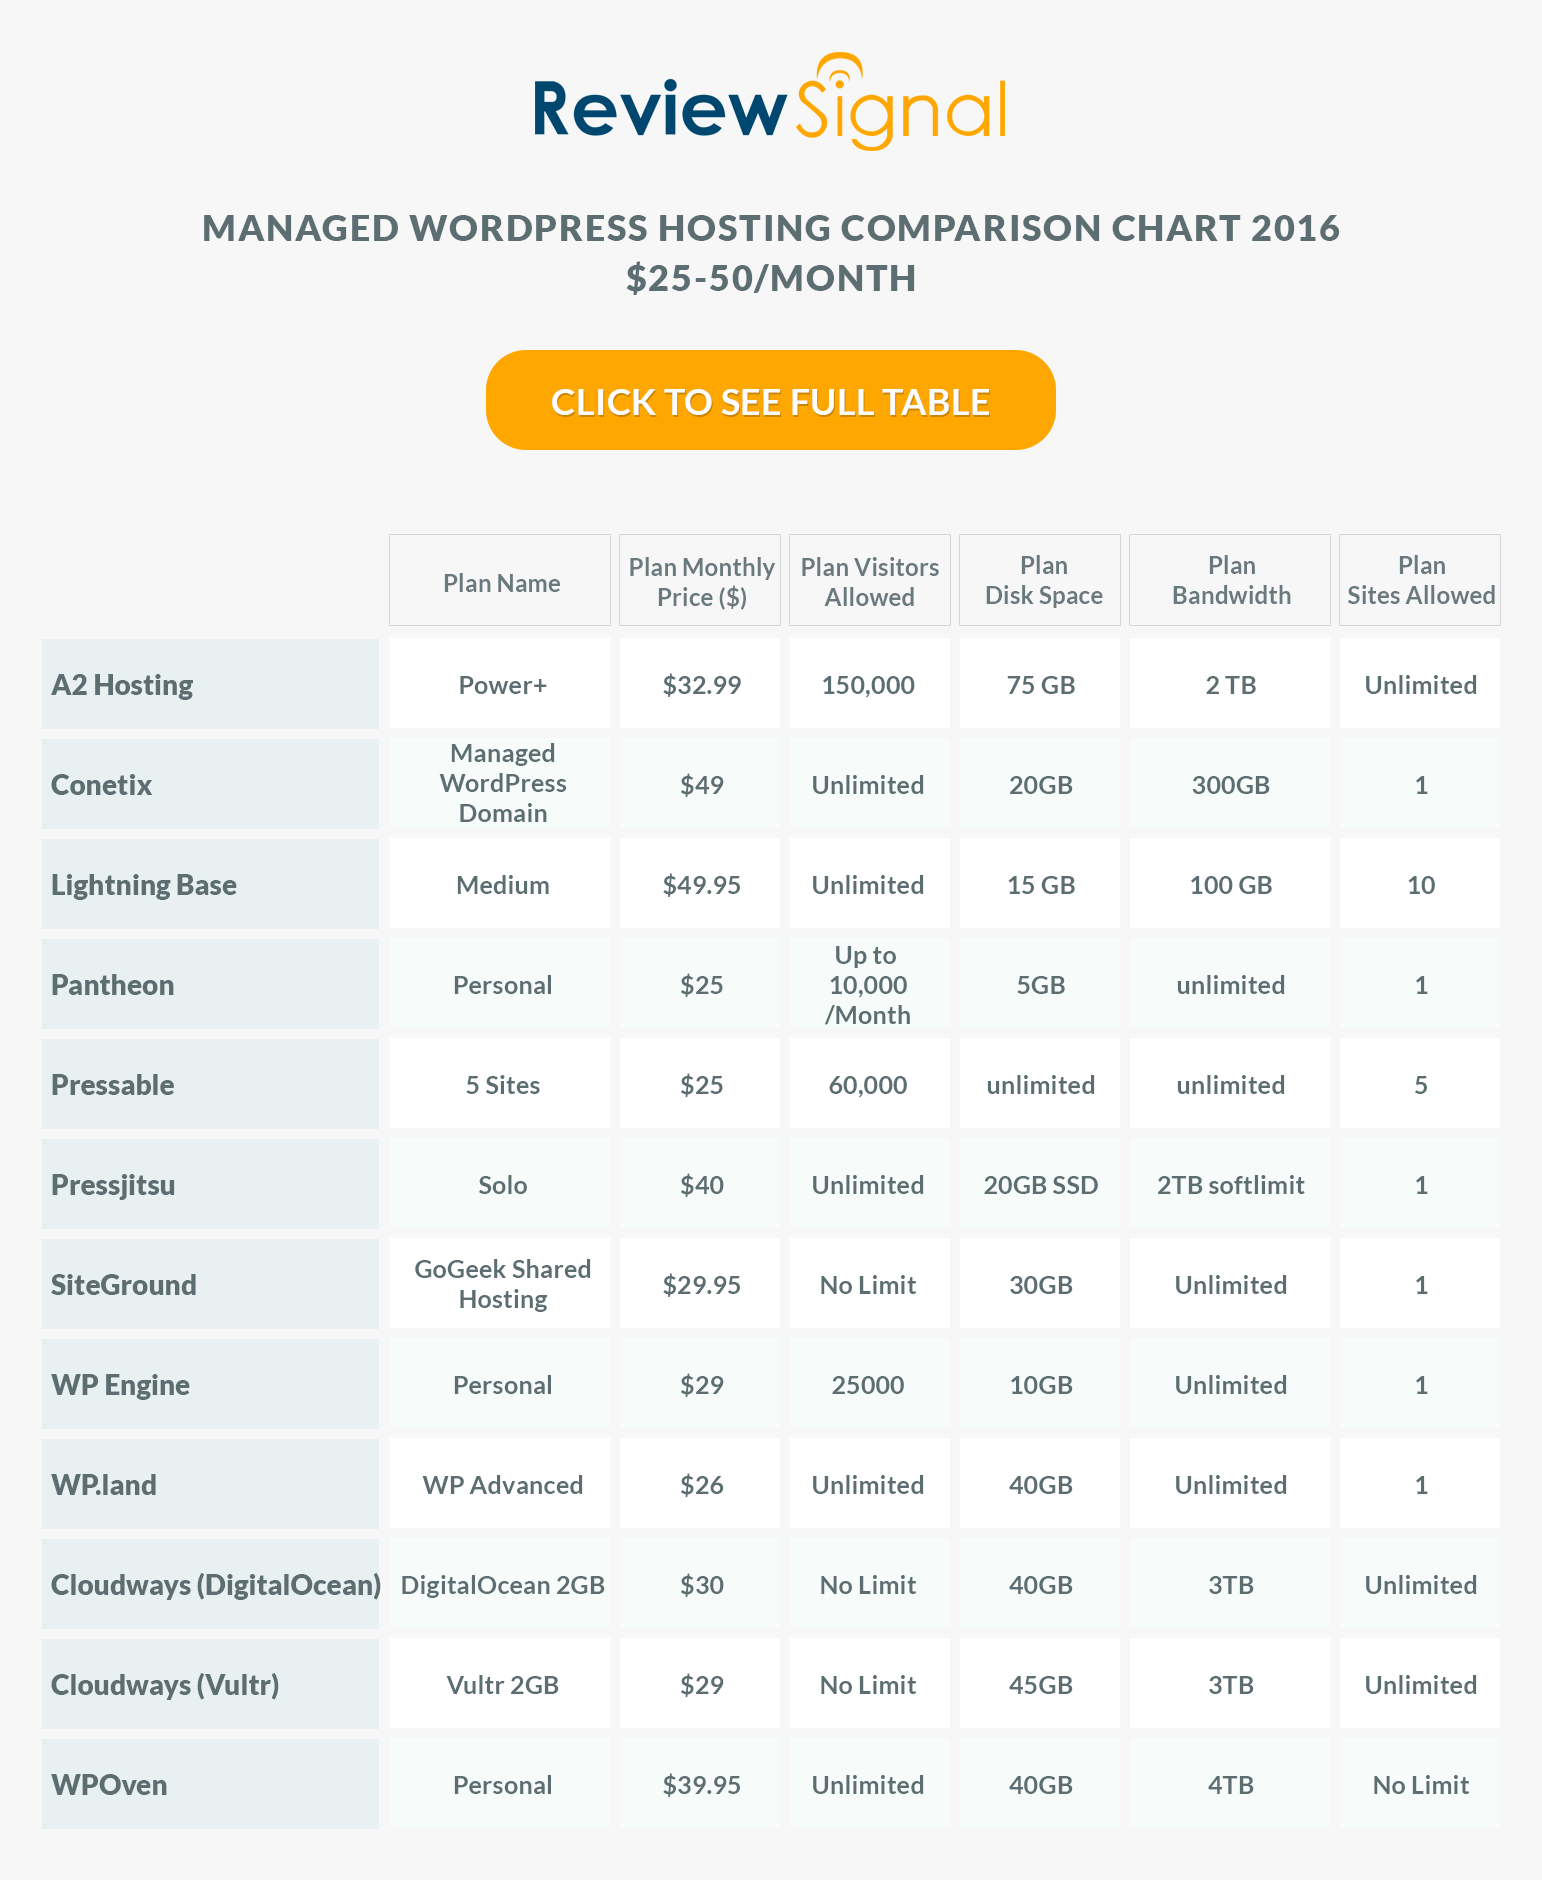
$25-50/Month WordPress Hosting Products

review_signal_table_50

$25-50/Month WordPress Hosting Performance Benchmarks Results

1. Load Storm

Test 500-2000 Concurrent Users over 30 Minutes, 10 Minutes at Peak

Company Total Requests Total Errors Peak RPS Average RPS Peak Response Time(ms) Average Response Time(ms) Total Data Transferred (GB) Peak Throughput (MB/s) Average Throughput (MB/s)
A2 193764 68658 148.28 107.65 17563 6541 7.647 11.37 4.248
CloudWays DO 196963 54589 148.48 109.42 15809 5841 8.474 7.384 4.708
CloudWays Vultr 207994 50049 144.13 115.55 16187 5339 9.439 8.398 5.244
Conetix 169625 116960 134.43 94.24 18510 8578 2.635 3.898 1.464
LightningBase 315348 1 238.4 175.19 3567 272 16.34 13.47 9.077
Pantheon 268164 866 205.5 148.98 14422 315 6466 4927 3592
Pressable 394405 26 294.6 219.11 15101 226 16.4 13.32 9.111
Pressjitsu 300931 3913 228.47 167.18 11121 502 16.86 14.29 9.365
SiteGround 300999 0 232.75 167.22 10926 462 15.83 14.35 8.972
WP Land 294459 14976 235.63 163.59 15422 864 15.15 14.04 8.417
WPEngine 348796 26572 270.23 193.78 15091 311 14.95 11.38 8.307
WPOven 288369 0 217.85 160.21 5815 283 16.64 13.63 9.245


Discussion of Load Storm Test Results

Many companies handled this test without any sort of struggle: LightningBasePantheon [Reviews], PressableSiteGround [Reviews], and WPOven.com. In fact, SiteGround and WPOven managed to have zero errors, while LightningBase had 1. Truly impressive performances put on by these companies.

Pressjitsu struggled a little bit. There were some errors and increased response times at the start of the test. It managed to stabilize for the last 22 minutes as load increased though.

WPEngine [Reviews] and WP.land struggled a bit more than Pressjitsu, but didn't completely fall apart. Both seemed to be having issues with the wp-login page, possibly security related.

A2 Hosting [Reviews], CloudWays [Reviews] (Digital Ocean & Vultr), and Conetix did not do well during this test. High error rates and slow response times show they were not equipped to handle this type of load.


2. Blitz.io

Test 1-1000 Concurrent Users over 60 seconds

Blitz Test Quick Results Table

Company Hits Errors Timeouts Average Hits/Second Average Response Time Fastest Response Slowest Response
A2 51 14265 7339 1 800 411 1047
CloudWays DO 28328 13 16 472 32 25 91
CloudWays Vultr 28763 3 0 479 24 24 25
Conetix 2359 1097 6070 39 1412 763 2410
LightningBase 27460 0 0 458 72 71 72
Pantheon 27755 0 0 463 61 60 67
Pressable 25914 0 2 432 134 134 136
Pressjitsu 23902 481 0 398 205 205 206
SiteGround 26623 1 26 444 86 71 255
WP Land 28352 0 1 473 39 38 40
WPEngine 26281 69 0 438 117 114 127
WPOven 26687 0 0 445 103 101 104

Discussion of Blitz Test 1 Results

This test is just testing whether the company is caching the front page and how well whatever caching system they have setup is performing (generally this hits something like Varnish or Nginx).

Who performed without any major issues?

CloudWays (Digital Ocean & Vultr), LightningBasePantheonPressableSiteGround [Reviews], WPEngine [Reviews], WP.land, and WPOven.com all handled the blitz test without any significant issues.

Who had some minor issues?

Pressjitsu again had what seems to be security related issues. A perfect flat response time but some timeouts at the end of the test.

Who had some major issues?

A2 Hosting and Conetix both failed the Blitz test.

3. Uptime Monitoring

Both uptime monitoring solutions were third party providers that offer free services. UptimeRobot was paid for and monitoring on a 1 minute interval. All the companies were monitored over approximately two months (May-June 2016).

Uptime Robot & StatusCake

Company StatusCake UptimeRobot
A2 97.91 99.35
CloudWays DO 100 100
CloudWays Vultr 99.95 99.87
Conetix 99.92 99.93
LightningBase 100 100
Pantheon 100 100
Pressable 99.91 99.92
Pressjitsu 99.78 99.65
SiteGround 99.99 100
WP Land 99.92 100
WPEngine 100 99.99
WPOven 100 100

A2 had significant downtime issues with StatusCake recording 97.91% and UptimeRobot recording 99.35% uptime. The CloudWays Vultr server had some issues with UptimeRobot recording 99.87%. Pressjitsu also had some uptime problems with StatusCake recording 99.78% and UptimeRobot 99.65%.

Everyone else was above 99.9% on both monitors including CloudWays Digital Ocean, LightningBase, Pantheon, WPOven all recording perfect 100%/100% scores.

4. WebPageTest.org

Every test was run with the settings: Chrome Browser, 9 Runs, native connection (no traffic shaping), first view only.

Company WPT Dulles WPT Denver WPT LA WPT London WPT Frankfurt WPT South Africa
A2 0.879 0.747 1.237 1.61 2.029 5.657
CloudWays DO 0.836 0.58 1.031 1.221 1.668 7.08
CloudWays Vultr 0.713 0.676 1.087 1.109 1.636 7.643
Conetix 2.328 2.078 2.242 3.845 3.497 8.69
LightningBase 0.567 0.563 1.054 1.067 1.511 4.199
Pantheon 0.86 0.583 1.024 1.259 1.649 7.625
Pressable 0.945 0.715 1.162 1.533 2.013 9.377
Pressjitsu 0.94 0.549 0.93 1.33 1.912 6.288
SiteGround 0.838 0.655 1.043 1.063 1.693 6.927
WP Land 0.816 0.622 1.002 1.189 1.693 3.307
WPEngine 0.872 0.523 0.939 1.199 1.796 4.434
WPOven 0.85 0.534 1.093 1.452 1.79 4.844
Company WPT Singapore WPT Shanghai WPT Japan WPT Sydney WPT Brazil
A2 2.956 22.788 2.231 2.609 2.342
CloudWays DO 2.123 22.42 1.898 1.713 1.755
CloudWays Vultr 2.223 22.573 1.832 1.7 1.797
Conetix 2.027 23.425 2.63 1.308 3.56
LightningBase 2.041 23.977 1.717 1.848 1.667
Pantheon 2.194 22.605 1.769 1.661 1.784
Pressable 2.451 22.258 2.194 3.079 2.049
Pressjitsu 2.046 22.352 1.73 1.416 2.055
SiteGround 2.245 23.087 1.806 2.27 1.855
WP Land 2.157 22.428 1.872 1.658 1.784
WPEngine 2.121 24.584 1.87 2.051 1.863
WPOven 2.089 2.82 1.796 1.712 1.859

What I learned was getting traffic into China is terrible. Nobody really did well on the Shanghai location except WPOven which somehow didn't get the delay that every other company experienced. South Africa is also really slow. Most servers were US based but were delivering content to most corners of the world in about 2 seconds or less which is impressive.

Conetix is an Australian focused company and they delivered to Sydney faster than anyone which is a relief that the geographic advantage is real. Beyond the Australian market the connectivity seemed slower to just about every other location. Australia has notoriously bad connectivity though, so I can see the advantage of having a company specializing in the local market.

I wish I could compare averages against last year except they removed one of the testing locations (Miami) and I did a global test instead because that was something people wanted to see.

The US connectivity is very fast though, with everyone delivering to Dulles(VA) and Denver (CO) in under a second (minus the Australian server) with LA at about one second exactly for everyone.

5. WPPerformanceTester

Company PHP Bench [Seconds] (lower=faster) WP Bench [Queries Per Second](higher=faster)
A2 18.456 592.77
CloudWays DO 15.028 353.98
CloudWays Vultr 13.145 392.62
Conetix 12.833 410.51
LightningBase 10.795 1353.18
Pantheon 12.292 189.54
Pressable 11.062 525.21
Pressjitsu 12.771 648.09
SiteGround 11.414 1109.88
WP Land 13.491 1094.09
WPEngine 13.494 406.17
WPOven 9.412 690.61

In this tier, there was a lot more normalized spread on the PHP Bench with most people being within the 10-14 second range we saw last year. WPOven lead the pack at 9.4. A2 was the slowest at 18.456.

The WP Bench scores varied a lot, again. LightningBase had another blazingly fast score of 1353.18. Siteground and WPLand also broke the 1000 barrier, whereas last year's fastest was 889. At the bottom of the pack was Pantheon with 189.54, which I am sure they would say infrastructure plays a large role in. Anyone with a distributed/non-local SQL database will be slower by a lot. They would probably argue that's one of the trade-offs of scalability and based on their load testing performance, it would be hard to argue against.

Conclusion

A very crowded bracket with lots of competition. This range is still pretty entry level, not the cheapest stuff like the <$25/month plans I compared. But with increased price came better performances. Although two of the top tier companies in this bracket make up two of the three top tier performers in the cheapest bracket. But it is nice to see some loose price to performance correlation in the market. Many of these plans are the entry level for their respective companies.

One of the interesting things to watch was the VPSs in this range (A2, CloudWays, Pressjitsu). They were outperformed by the Shared/Cloud providers who can presumably burst more shared resources for any given site. So for spikey sites that expect to get a Reddit/Slashdot effect, there may be some advantage in being in that sort of environment (if you cant easily scale the VPS, which some providers make quite easy). But since these are dummy sites not really tested heavily over the two months, there is the potential for bad neighbors negatively impacting you too during such a spike, and then you might want your own isolated VPS. I can see arguments for for both sides.

Without further ado, I will tell you who had the best performance, who deserved an honorable mention and then analyze each host individually. I still don't believe in ranking in any particular order, only grouping companies by how well they performed.

Top Tier WordPress Hosting Performance

review_signal_2016_trophy_50

LightningBasePantheonPressableSiteGround [Reviews] and WPOven.com.

Honorable Mentions

Unfortunately, no company deserves honorable mention status which I give to companies that came close but weren't quite perfect or they looked like they were good but something external (generally security measures) interfered with the tests but from all other indications they seemed to be doing well.

The closest in this bracket would have been Pressjitsu, except they had uptime issues which I give no leeway for being under 99.9%.

Individual Host Analysis

A2 Hosting [Reviews]

I try to find bright spots in a company's performance, but A2 really didn't have one in this test. If you buy a VPS there is also no default way to install WordPress beyond the old fashioned DIY. You have to pay extra for Softaculous installer from the admin panel.

CloudWays [Reviews] Digital Ocean / Vultr

The most interesting part of CloudWays is being able to see the same stack tested on multiple providers. It's a small sample, but it looks like Vultr marginally outperforms Digital Ocean in performance. Although, Digital Ocean was more stable (again, small sample size to compare head to head). It was nice to see CloudWays do well with the Blitz tests and keep very good uptime, especially the Digital Ocean machine which was perfect.

Conetix

Conetix had good uptime and connection to Australia, their target market. They strongly using W3TC but it didn't come fully installed and I don't test anything beyond the default configuration because it gets into too much minutia and conflict with hosts about what could be done to improve scores. I also believe most people just stick with the default based on all the user testing I've seen across various fields. So the unfortunate results were the load test performances didn't look very good for them.

(9/19/2019 Update) Conetix have issued their own statement regarding Review Signal's test and why they believe this methodology doesn't accurately represent their performance and why a unique Australian perspective is required when evaluating them. I recommend reading the full details.

LightningBase

LightningBase put on basically a perfect performance. 100% uptime on both monitors. 0 errors on blitz, 1 error on loadstorm. Unequivocally, a top tier performance.

Pantheon [Reviews]

Pantheon showed up again, in a good way. They earned themselves a top tier performance accolade. They had a few errors at the start of the LoadStorm test, but beyond that aced everything.

Pressable

Pressable is back for the first time since my first testing in 2013, with new ownership (WordPress.com). They had had some good tech back then but it wasn't perfect and had some minor issues. I can happily say that has changed as they delivered a top tier performance this year with no issues in any test.

Pressjitsu

Pressjitsu felt like 2013 Pressable, the foundations of a really good company but just didn't get it all put together. The biggest problem was the sub 99.9% uptime. They had what appeared to be security measures mar the blitz test and had some errors at the start of the LoadStorm test but managed to stabilize for the duration and put on a good showing.

SiteGround [Reviews]

SiteGround got even better this year. They jumped up from honorable mention to top tier status. Their Blitz and LoadStorm tests both improved while everything else remained at a high level. An all around fantastic performance which deserved top tier status.

WPEngine [Reviews]

WPEngine fell slightly this year, it could have been a security issue with wp-login during the LoadStorm test, but there were too many errors to give it honorable mention status for this plan which it earned last year. Everything else looked good though.

WP.land

WP Land like WPEngine had too many problems during the LoadStorm test that it didn't earn honorable mention status. Everything else looked very good for them and it's great to see a strong new entrant.

WPOven.com

The knock on WPOven last year was their LoadStorm test. Everything else was perfect. I'm glad they maintained everything else, but this time they managed a perfect LoadStorm test to boot. A huge improvement and a very well deserved entry in the top tier of WordPress Hosts in the $25-50 range.

Under $25/Month WordPress Hosting Performance Benchmarks (2016)

LoadStormLogo

Sponsored by LoadStorm. The easy and cost effective load testing tool for web and mobile applications.

The full company list, product list, methodology, and notes can be found here

This post focuses only on the results of the testing in the <$25/month price bracket for WordPress Hosting.


<$25/Month WordPress Hosting Products
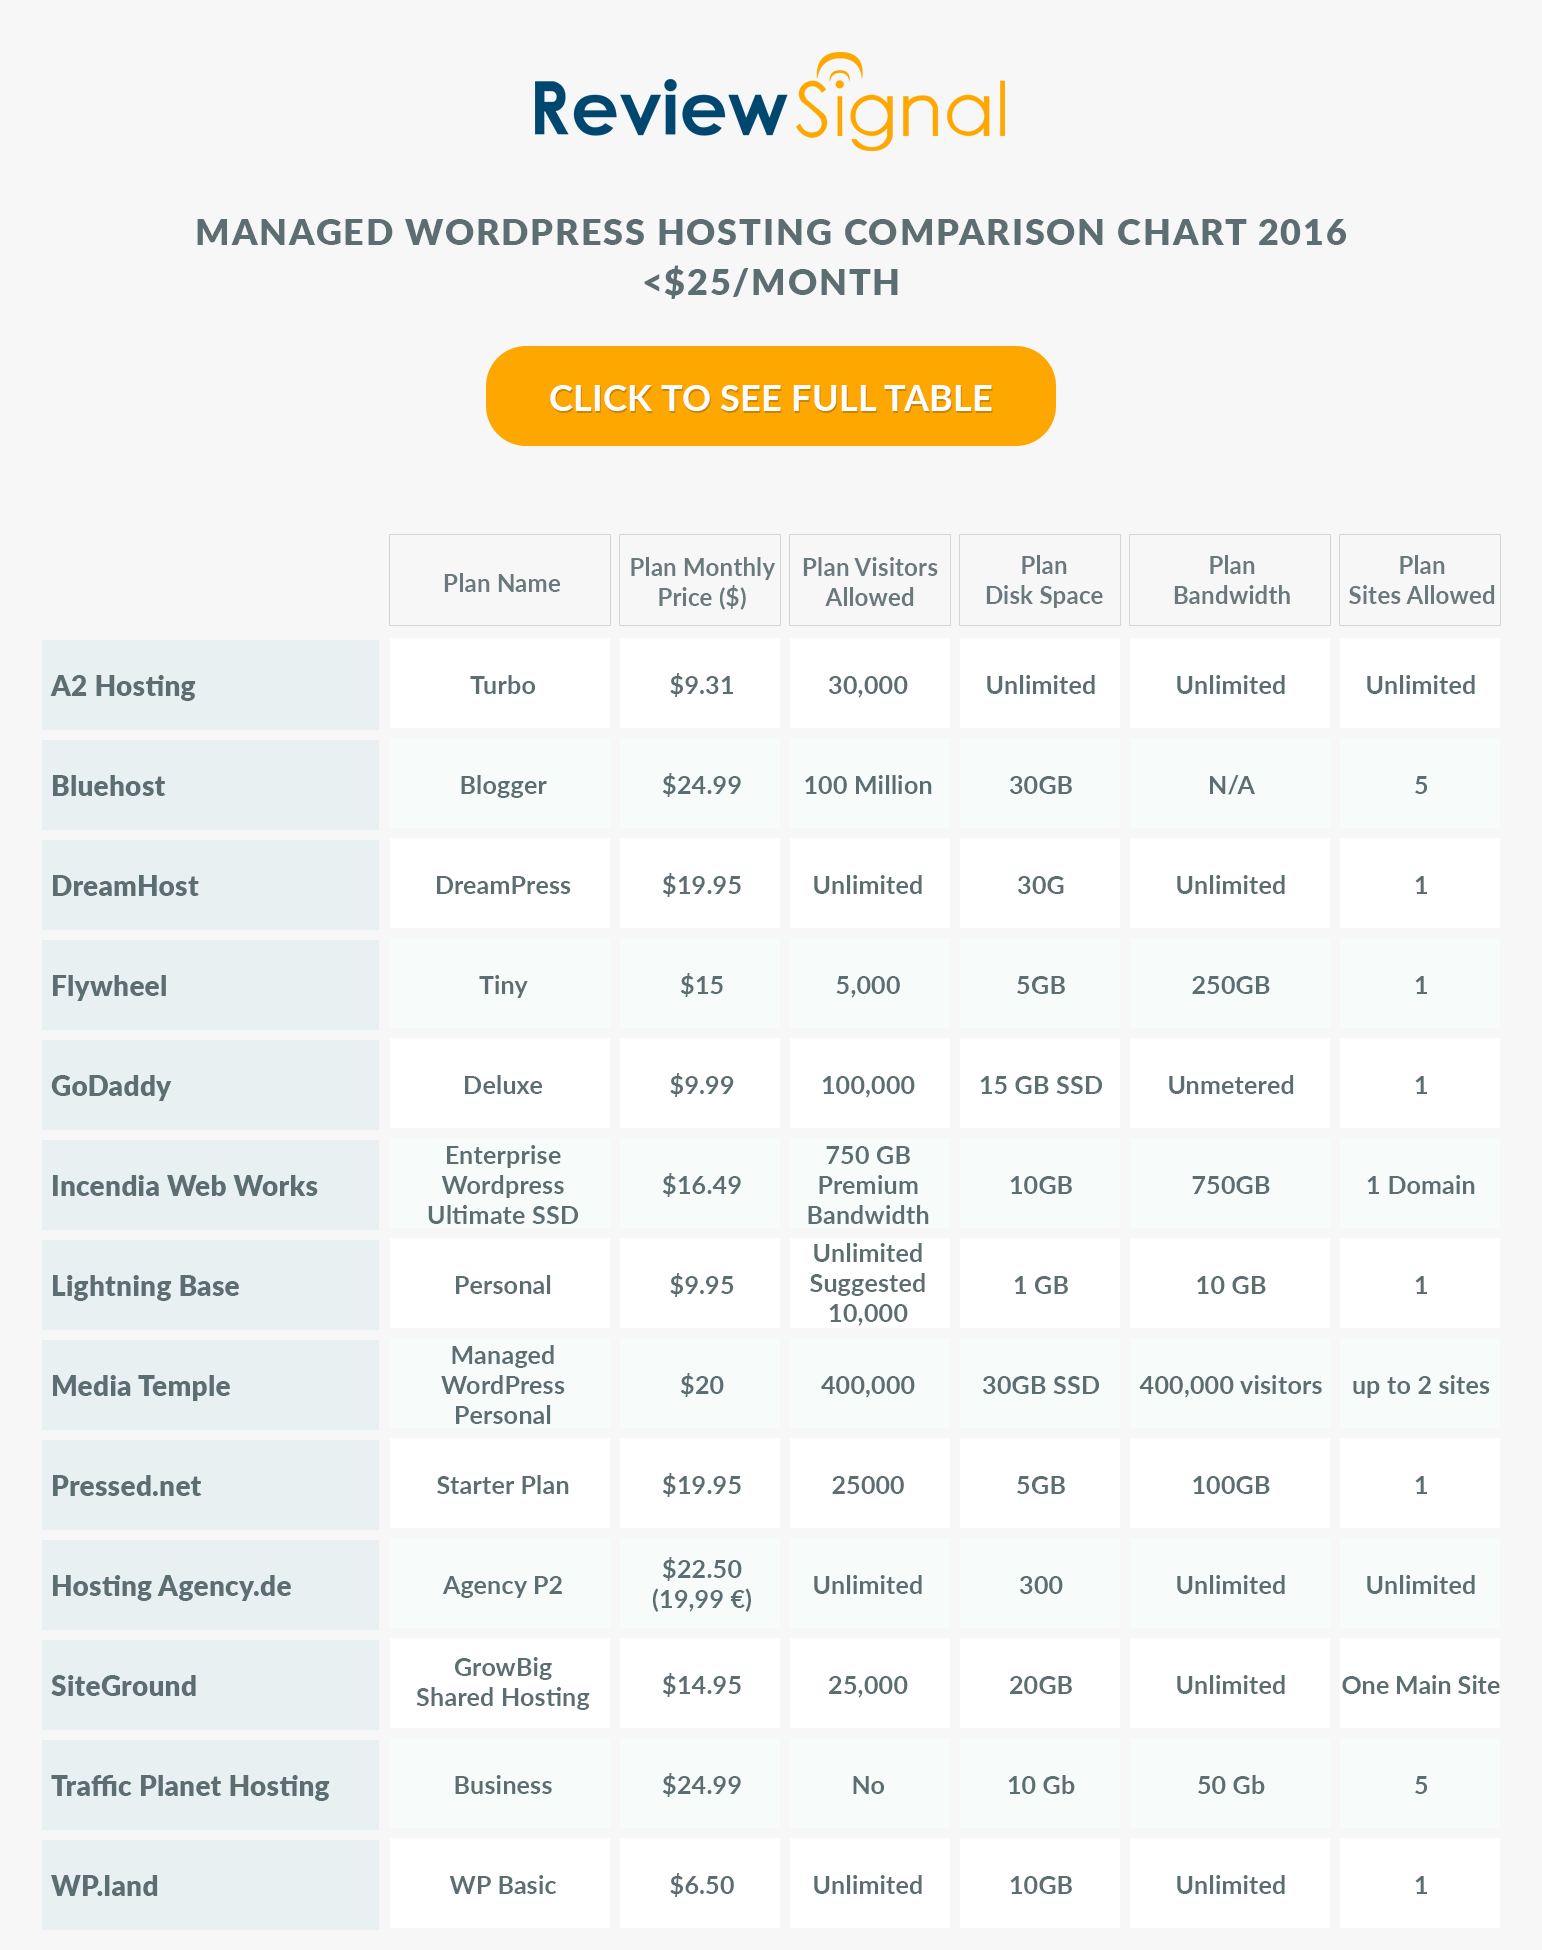
review_signal_table_25_updated


<$25/Month WordPress Hosting Performance Benchmarks Results

1. Load Storm

Test 500-2000 Concurrent Users over 30 Minutes, 10 Minutes at Peak

Company Total Requests Total Errors Peak RPS Average RPS Peak Response Time(ms) Average Response Time(ms) Total Data Transferred (GB) Peak Throughput (MB/s) Average Throughput (MB/s)
A2 310069 203981 249.08 172.26 15138 549 4.639 8.853 2.577
BlueHost 181995 153234 147.47 101.11 16000 7634 1.066 3.677 0.592
DreamHost 295685 43 224.1 164.27 15063 339 16.06 13.5 8.922
FlyWheel 265618 81491 205.22 147.57 15101 1154 11.5 9.361 6.391
GoDaddy 311172 1363 238.68 172.87 10100 340 16.07 13.31 8.927
Hosting Agency (DE) 182424 117939 132.65 101.35 15991 6743 3.823 10.53 2.124
IWW 272657 84 217.92 151.48 10096 266 14.93 13.77 8.293
LightningBase 314439 5 238.68 174.69 8989 255 16.24 13.24 9.023
Media Temple 327662 1466 258.45 182.03 10628 381 12.55 10.54 6.972
Pressed 289318 61 214.05 160.73 15029 266 16.25 13.01 9.03
SiteGround 301722 1 230.45 167.62 9374 447 15.9 13.76 8.833
TrafficPlanetHosting 289335 476 217.63 160.74 15216 570 16.15 14.08 8.974
WP Land 293166 11596 228.4 162.87 15608 644 15.47 13.3 8.594

Discussion of Load Storm Test Results

The companies that clearly didn't struggle at all with LoadStorm were DreamHost [Reviews], Incendia Web Works (IWW), LightningBase, Pressed, SiteGround [Reviews]. GoDaddy [Reviews], MediaTemple [Reviews] and Traffic Planet Hosting had minor spikes at the start, but they seem nearly inconsequential in the grand scheme of the test.

WP.land seemed to have some security measures which struggled with wp-login being hit so frequently.

A2 Hosting [Reviews], BlueHost [Reviews], FlyWheel [Reviews] and Hosting Agency did not do well on this test. FlyWheel explicitly stated this was too much load for that size plan and recommended upgrading if this was the expected load.

2. Blitz.io

Test 1-1000 Concurrent Users over 60 seconds

Blitz Test Quick Results Table

Company Hits Errors Timeouts Average Hits/Second Average Response Time Fastest Response Slowest Response
A2 590 27255 390 10 92 55 167
BlueHost 23340 71 274 389 214 155 604
DreamHost 29337 0 1 489 4 3 7
FlyWheel 28530 0 0 476 28 21 146
GoDaddy 15222 11093 28 254 196 190 229
Hosting Agency (DE) 662 20862 3649 11 630 400 1556
IWW 28786 9 0 480 23 21 24
LightningBase 27488 0 0 458 71 71 72
Media Temple 15255 11260 5 254 200 188 318
Pressed 26228 0 0 437 80 5 389
SiteGround 26055 1 21 434 100 72 346
TrafficPlanetHosting 1018 8344 9718 17 266 102 843
WP Land 28344 0 0 472 39 38 39

Discussion of Blitz Test 1 Results

This test is just testing whether the company is caching the front page and how well whatever caching system they have setup is performing (generally this hits something like Varnish or Nginx).

Who performed without any major issues?

DreamHost, IWW, LightningBase, SiteGround, WP Land all handled the test without any issues.

Who had some minor issues?

BlueHost had a couple spikes during the test which caused some errors and timeouts, but they weren't substantial.

FlyWheel had a spike at the very end of the test which caused a large increase in response times.

Pressed started to have a ramp up in response times but it never errored or timed out during the test.

Who had some major issues?

GoDaddy, MediaTemple and TrafficPlanetHosting seemed to pretty clearly hit security measures which couldn't be worked around. The response times were relatively stable, but errors shot up which is symptomatic of a security measure kicking in rather than the server being taxed. It's hard to know how they would have performed sans security measures.

A2 and Hosting Agency did not take kindly to the Blitz test and crashed almost immediately under load.

3. Uptime Monitoring

Both uptime monitoring solutions were third party providers that offer free services. UptimeRobot was paid for and monitoring on a 1 minute interval. All the companies were monitored over approximately two months (May-June 2016).

Uptime Robot & StatusCake

Company StatusCake UptimeRobot
A2 99.92 99.91
BlueHost 30.22 18.06
DreamHost 99.97 99.97
FlyWheel 99.96 99.98
GoDaddy 99.96 99.98
Hosting Agency (DE) - 100
IWW 99.73 99.88
LightningBase 99.99 100
Media Temple 99.96 99.95
Pressed 100 99.87
SiteGround 99.97 99.98
TrafficPlanetHosting 99.98 99.98
WP Land 99.92 100

BlueHost screwed up and cancelled this account mid-testing causing the uptime to look horrific. Their other two plans which were not cancelled had measurements of 99.98, 99.98, 100 and 99.99 uptime. I'm upset that it happened and there was a struggle to restore the account and have to take credit away for this type of screw up. But, they were able to keep the other servers up with near perfect uptime which I think should be stated here as well.

Hosting Agency for some reason couldn't be monitored by StatusCake (http/2 issue they still haven't fixed for nearly 9 months, which UptimeRobot fixed within 24 hours when I notified them). But they had 100% on UptimeRobot, so it looks good.

IWW had a bunch of short outages and one longer one (2hr 33m) which brought it's uptime down.

Pressed had a 1hr 51m downtime (502 error) recorded by UptimeRobot but StatusCake never picked it up. I'm not sure what to make of that, it might be something wrong with UptimeRobot's servers connecting properly since StatusCake never picked it up over an interval that long.

Everyone else had above 99.9% uptime.

4. WebPageTest.org

Every test was run with the settings: Chrome Browser, 9 Runs, native connection (no traffic shaping), first view only.

Company WPT Dulles WPT Denver WPT LA WPT London WPT Frankfurt WPT South Africa
A2 0.819 0.638 1.109 1.181 1.687 5.054
BlueHost 0.902 0.521 0.878 1.532 1.874 3.483
DreamHost 0.769 0.777 1.444 1.107 1.64 4.33
FlyWheel 0.74 0.722 1.077 1.082 1.649 5.241
GoDaddy 0.939 0.728 0.834 1.376 1.992 6.909
Hosting Agency (DE) 1.299 1.258 2.17 0.985 1.55 4.905
IWW 0.544 0.658 0.864 0.929 1.416 4.105
LightningBase 0.62 0.598 1.078 0.95 1.471 5.764
Media Temple 0.86 0.667 0.811 1.313 1.945 4.645
Pressed 0.773 0.902 1.276 1.176 1.691 4.845
SiteGround 0.741 0.64 1.048 1.06 1.721 4.94
TrafficPlanetHosting 0.793 0.562 1.26 1.212 1.723 3.522
WP Land 0.719 0.689 1.154 1.099 1.709 4.8


Company WPT Singapore WPT Shanghai WPT Japan WPT Sydney WPT Brazil
A2 2.244 22.287 1.974 2.003 1.895
BlueHost 2.255 22.728 1.809 1.467 2.274
DreamHost 1.93 22.186 2.028 1.954 1.747
FlyWheel 1.765 12.549 1.845 1.816 1.758
GoDaddy 2.173 22.373 1.826 1.959 2.103
Hosting Agency (DE) 2.311 22.406 2.651 2.772 2.596
IWW 1.98 22.547 1.615 1.96 1.535
LightningBase 1.999 19.731 1.708 1.913 1.661
Media Temple 2.113 22.141 1.802 1.959 2.135
Pressed 2.233 23.691 1.997 2.037 1.894
SiteGround 2.131 22.718 1.843 2.079 1.788
TrafficPlanetHosting 2.081 22.74 1.872 1.595 1.816
WP Land 2.25 22.305 1.852 1.959 1.752

What I learned was getting traffic into China is terrible. Nobody really did well on the Shanghai location. South Africa is also really slow. Most servers were US based but were delivering content to most corners of the world in about 2 seconds or less which is impressive. Hosting Agency based in Germany was a bit disappointing. Very slow relatively speaking to the US. But it wasn't even the fastest to London or Frankfurt. LightningBase and IWW were able to beat the German company in the US by a large margin and to Europe which reinforces that geographic location isn't everything in terms of speed.

I wish I could compare averages against last year except they removed one of the testing locations (Miami) and I did a global test instead because that was something people wanted to see.

5. WPPerformanceTester

Company PHP Bench [Seconds] (lower=faster) WP Bench [Queries Per Second](higher=faster)
A2 12.626 570.78
BlueHost 13.089 1083.42
DreamHost 17.104 446.23
FlyWheel 11.761 387.3
GoDaddy 13.804 278.47
Hosting Agency (DE) 6.501 45.28
IWW 7.637 1869.16
LightningBase 10 1315.79
Media Temple 12.241 339.79
Pressed 11.036 217.2
SiteGround 11.497 733.14
TrafficPlanetHosting 8.666 918.27
WP Land 14.485 684.93

What was enormously interesting about WPPerformanceTester results this year was the much larger spread and faster results. Last year, almost everyone was around 10-14 seconds for PHP Bench with the outlier of PressLabs doing 8.9 and DreamHost at 27. DreamHost again has the dubious honor of the slowest PHP Bench but it improved by a whopping 10 seconds down to 17. The fastest was Hosting Agency with 6.5, more than a full 2 seconds faster than last year's fastest speed. IWW, TrafficPlanetHosting also managed sub 10 second speeds.

Last year's fastest WP Bench was 889 queries per second. That was blown away by this years testing with IWW leading the group at more than double the speed (1869). BlueHost, LightningBase and TrafficPlanetHosting all managed to be faster than last year's fastest benchmark as well. Unfortunately, Hosting Agency's incredibly fast PHP bench is somewhat cancelled out by their slowest WP Bench score, which is slower than last year's slowest. It should be noted that transaction speed isn't always a great measured on distributed/clustered/cloud systems that may be running databases on different machines, but at the entry level that's less of an issue. Generally the incredibly fast scores you see are local databases with no network latency overhead.

Conclusion

It is nice to get back to a real entry level analysis with a much more level playing field. Having 13 different companies available to choose from in the <$25/month range is fantastic. Despite the change in this years format, the lower end plans still outperformed the fastest competitors from last year's tests which had plans up to ~$300/month.

Despite the hard price cap in this bracket of testing, there were still some companies that handled all the tests without any serious issue. Many more did very well but ran into minor issues.

The amount of companies jumping into the space is a fantastic win for consumers. In this tier we saw A2, Pressed, WP Land, Hosting Agency, IWW and Traffic Planet Hosting all enter for the first time. They target a variety of different niches within the space and overall it's a win for us, the consumer to have more good choices and options. From a performance standpoint, you can still get amazing performance value for the money even at the lowest tier.

Without further ado, I will tell you who had the best performance, who deserved an honorable mention and then analyze each host individually. I still don't believe in ranking in any particular order, only grouping companies by how well they performed.

Top Tier WordPress Hosting Performance
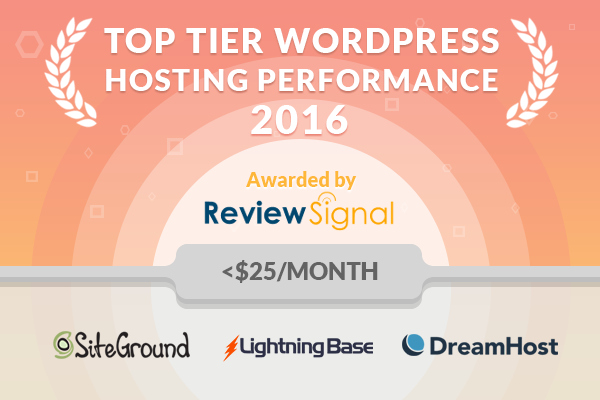
review_signal_2016_trophy_25

DreamHost [Reviews], LightningBase, and  SiteGround [Reviews],

All three of these companies went through the full testing without any meaningful issues.

Honorable Mentions

Pressed had an odd uptime issue but also showed some signs of server stress during the blitz test. For a brand new company they performed admirably, but I'm not quite comfortable awarding them the top tier status quite yet when you compare their results against the three top tier companies, but they put on a very good showing.

WP.land did well in every test except LoadStorm where it had a roughly 4% error rate. It looked like a security issue with wp-login which isn't uncommon. But there were also some spikes/delays as well. It could just be security acting up, but again, a minor issue that kept it out of the top tier, but it was worthy of an honorable mention from yet another new comer to this year's testing.

GoDaddy [Reviews]/MediaTemple [Reviews], I combine this one because it's running on the same tech and the results look very similar and experienced the same security issues. You can pretty clearly see when the security measures kick in on Blitz and I wasn't able to work with their tech team to come up with a way to responsibly bypass their security measures. LoadStorm had a spike at the start with wp-login issues but resolved itself out quickly and had a flat response time graph. It's possible their tech is just as good as the top tier hosts, but I wasn't able to accurately measure it because of security measures but it looks very good and at least deserves the honorable mention.

Traffic Planet Hosting is another new entrant and had similar issues to GoDaddy/MediaTemple. Security issues caused some problems on the Blitz test, but it did start to show some load too. Not perfect, but it did well on LoadStorm as well.  (no honorable mention?)

Individual Host Analysis

A2 Hosting [Reviews]

A2 Hosting was a new entrant to this test and as much as I love the competition in the space, A2 fell short. Other than their uptime monitoring which was good, they struggled in all the load testing experiments.

BlueHost [Reviews]

BlueHost specifically messed up with my account in this test and the uptime was terrible because of it. That alone ruined the uptime test, although as I stated in the section, the other servers all maintained excellent uptime which were on different accounts. They did ok in the blitz test, but not in the LoadStorm test. They also surprisingly managed the fastest individual WebPageTest score of any host in this price range. Compared to last year I don't see any huge signs of improvement with regards to performance.

DreamHost [Reviews]

Last year DreamHost's DreamPress product almost made the top tier except for some major downtime issues. This year, they had no such downtime issues and the performance remained top notch. DreamHost earned the top tier status for the <$25/month price bracket. It appears to be an excellent product priced very competitively.

FlyWheel [Reviews]

FlyWheel only entered one product this year and it was less powerful than last year's. It struggled a bit more on the LoadStorm test but the Blitz was perfect (although for this price tier, it was a weaker test than last year's test). They explicitly stated for LoadStorm that the plan was inappropriate for that level of traffic. They can probably handle bigger sites, but if we're comparing dollars to performance, they fell short in this price bracket on that metric. But they are still rated as the most well liked company that we track at Review Signal, so they are clearly doing something right in terms of product and customer service.

GoDaddy [Reviews]

GoDaddy had a stalwart performance marred by what appeared to be security measures. They very well could have a top notch product but we couldn't work out a responsible way to bypass the security measures for the Blitz load test. LoadStorm looked pretty good, one small spike to start and steady up to 2000 users. GoDaddy earned an honorable mention status because the product didn't seem to encounter any non-artificial problems.

Incendia Web Works

IWW did a great job in both load tests. The only concern was uptime, where IWW had 99.73% and 99.88% as recorded by each service. The performance component is definitely there, but a little more consistency and we have another serious competitor in the space. The only reason they didn't earn honorable mention while Pressed did is that there were conflicting uptime reports for Pressed where one showed 100% and the other recorded sub 99.9% uptime. Two independent services showed IWW below 99.9%, so there isn't much doubt about it in my mind. Like DreamHost last year, they put on a great performance showing and I hope next year the servers are a bit more stable and I can award top tier status.

LightningBase

LightningBase continues to impress. The last two years they've put on consistently near perfect tests. Their Blitz result was perfect and their LoadStorm had only 5 errors out of 314439 requests. Combined with 100/99.99% uptime monitors, LightningBase is unquestionably in the top tier for the <$25/month WordPress hosting bracket.

MediaTemple [Reviews]

MediaTemple's results basically mirrored GoDaddy's results. It would be even hard to tell the graphs apart if you removed the names. The MediaTemple/GoDaddy platform appears to be very solid but we couldn't responsibly get by some security measures, so I couldn't award it top tier status, but MT earned an honorable mention.

Pressed

Pressed earned itself an honorable mention. It had a weird uptime issue but more importantly it started to show some signs of load during the Blitz test where I would expect a flat response time from a static cache test like Blitz. It's a very new product and I'm sure we'll continue to see tremendous improvements as time goes on, a very good performance from possibly the newest company in this year's testing.

Hosting Agency

Hosting Agency performed as expected, it appears to have no special WordPress optimizations. If you were to install a basic lamp stack, this is the performance I expect out of the box. They had perfect uptime and oddly found themselves on both ends of the spectrum on my WPPerformanceTester. They weren't faster to England or Germany on WebPageTest, which I suspect is because there was no special caching technologies to accelerate delivery of pages despite being geographically closer. And it just collapsed during the load tests, especially Blitz which is essentially a static cache test (where they have none). Another important note is that their entire system is in German only.

SiteGround [Reviews]

SiteGround got even better this year. They jumped up from honorable mention to top tier status. Their Blitz and LoadStorm tests both improved while everything else remained at a high level. An all around fantastic performance which deserved top tier status.

Traffic Planet Hosting

Another new comer to this years testing. TPH put on a good show, there seemed to be some security measures which ruined the Blitz testing, but the LoadStorm test looked very solid. They earned an honorable mention because the only issue seemed artificial. I'm less confident about the quality of the product than GoDaddy/MediaTemple, but it still seemed to warrant recognition.

WP.land

WPLand was the final new entrant and they put on a fantastic showing. Everything went near perfect except the LoadStorm test which seemed to have an issue with wp-login triggering some security measures. But the response rate was pretty stable and quick despite the ramp up to 2000 users. They also had a perfect blitz test with no errors and a 1ms spread in fastest to slowest response times. WP Land earned honorable mention status because overall it was a very good performance with a small issue that might be security related.

 

WordPress Hosting Performance Benchmarks (2016)

LoadStormLogo

Sponsored by LoadStorm. The easy and cost effective load testing tool for web and mobile applications.

2018 WordPress Hosting Performance Benchmarks is now live.

This is the fourth round of managed WordPress web hosting performance testing. You can see the original, 2014 version , and 2015 version.

Companies Tested

A2 Hosting [Reviews]
BlueHost [Reviews]
CloudWays [Reviews]
Conetix
DreamHost [Reviews]
FlyWheel [Reviews]
GoDaddy [Reviews]
Incendia Web Works
Kinsta
LightningBase
LiquidWeb [Reviews]
MediaTemple [Reviews]
Pagely [Reviews]
Pantheon [Reviews]
Pressable (Formerly ZippyKid)
Pressed.net
Pressidium
Pressjitsu
PressLabs
Hosting Agency (German)
SiteGround [Reviews]
Traffic Planet Hosting
WordPress.com VIP
WPEngine [Reviews]
WP.land
WPOven.com

Companies that didn't participate this round but did on previous rounds: WebHostingBuzzWPProntoNexcessA Small Orange [Reviews] and  WebSynthesis [Reviews].

Every plan was donated by the company for testing purposes with the strict stipulation that it would be the same as if any normal user signed up. There is a notes section at the bottom that details the minutiae of changes made to plans at the end of this post. Nearly every single company had security issues that I had to get around, so they worked to make sure my testing went through properly. Load testing often looks like an attack and it's the only way I can do these tests.

The Products

This year is a bit different than years past where every company and plan competed against one another. When I started the price gap was from $5/month to $29/month. Last year the gap was $5.95 to $299. I was only testing entry level plans but the market has dramatically changed since I first got started. Today, there is demand at many different price points and lots of companies have gone upscale with WordPress.com VIP at the top of the price bracket starting at $5,000/month. The only logical way to break things up was by price brackets. So below you will see the brackets and which companies participated. Specific details will be included on each bracket's write up.


<$25/m $25-50/m $51-100/m $101-200/m $201-500/m $500+/m
A2 Hosting A2 Hosting LiquidWeb A2 Hosting Kinsta Kinsta
Bluehost Conetix Bluehost Bluehost Media Temple Pagely
DreamHost LLC Lightning Base Cloudways (AWS ) Conetix Pagley Pantheon
Flywheel Pantheon Cloudways (Google) Kinsta Pantheon Pressable
GoDaddy Pressable Kinsta Liquid Web Pressable Pressidium
Incendia Web Works Pressjitsu Lightning Base Pressable Pressidium WordPress.com VIP
Lightning Base SiteGround Media Temple Pressidium Presslabs WP Engine
Media Temple WP Engine Pagely Pressjitsu SiteGround
Pressed WP.land Pantheon
Hosting Agency.de Cloudways (DigitalOcean) Pressable
SiteGround Cloudways (Vultr) Pressidium
Traffic Planet Hosting WPOven SiteGround
WP.land


Methodology

The question I tried to answer is how well do these WordPress hosting services perform? I tested each company on two distinct measures of performance: peak performance and consistency. I've also included a compute and database benchmark based on a WordPress plugin.

All tests were performed on an identical WordPress dummy website with the same plugins except in cases where hosts added extra plugins. Each site was monitored for approximately two months for consistency.

1. LoadStorm

LoadStorm was kind enough to give me resources to perform load testing on their platform and multiple staff members were involved in designing and testing these WordPress hosts. I created identical scripts for each host to load a site, login to the site and browse the site. Logged in users were designed to break some of the caching and better simulate real user load. The amount of users varies by cost.

2. Blitz.io

I used Blitz again to compare against previous results. This tests the static caching of the homepage. I increased the number of users based on monthly cost this time.

3. Uptime (UptimeRobot and StatusCake)

Consistency matters. I wanted to see how well these companies performed over a longer period of time. I used two separate uptime monitoring services over the course of a month to test consistency.

4. WebPageTest.org

WebPageTest with 9 runs, first view only, native connection. I tested from Dulles, Denver, Los Angeles, London, Frankfurt, South Africa, Singapore, Shanghai, Japan, Sydney, Brazil.

5. WPPerformanceTester (free plugin on WordPress.org)

I created a WordPress plugin to benchmark CPU, MySql and WordPress DB performance. The CPU/MySql benchmarks are testing the compute power. The WordPress component tests actually calling $wpdb and executing insert, select, update and delete queries.


Notes - Changes made to Hosting Plans

A2 - VPS Servers can't install WordPress out of the box without extra payment for Softaculous. Disabled recaptcha.

Conetix - disabled WordFence and Stream plugins.

SiteGround - fully enable SuperCacher plugin

GoDaddy - 24 database connection limit increased if you notify them of heavy load

CloudWays - disabled WordFence