This post is based off WordPress Hosting Performance Benchmarks (2014).
Overview
Kinsta is yet another new comer in our testing with something to prove. Kinsta easily shot to the top of our performance charts. Kinsta's plans have changed quite a bit since we tested them. When our testing was done they offered a $27/month plan. However, they've gone up-market and their cheapest plan is now $157/month. It seems they're targeting people who want serious performance.
The Plan
All testing was done on a shared account, which is no longer available. This plan tested had 1 WordPress site, 1GB SSD disk space, 50GB bandwidth and costs $27/month.
Performance
LoadStorm
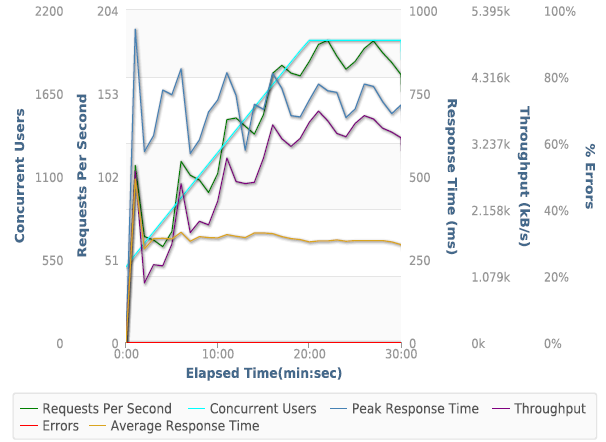
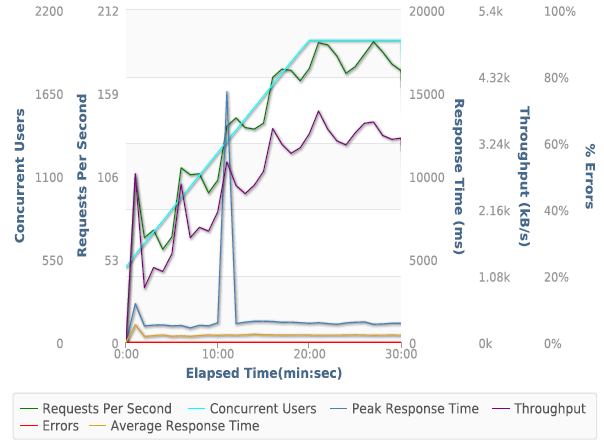
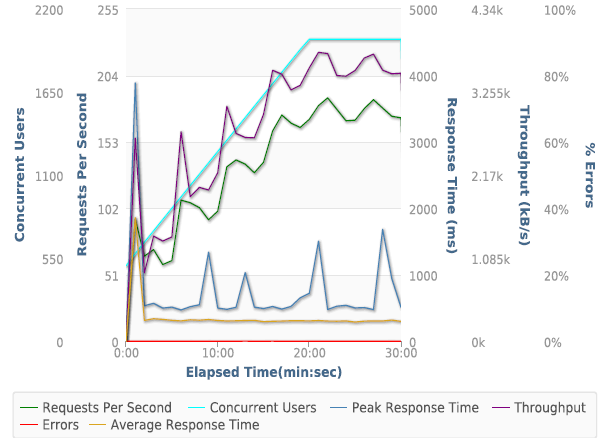
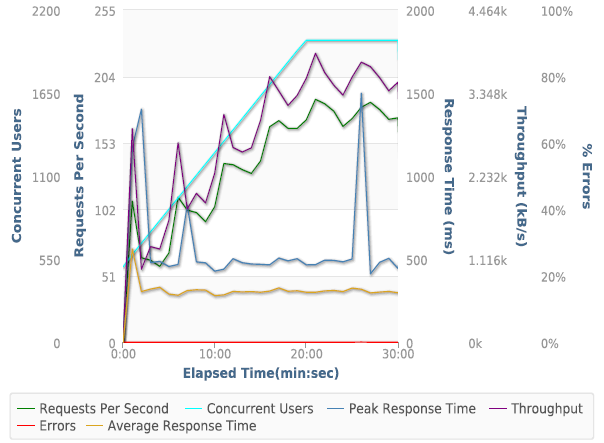
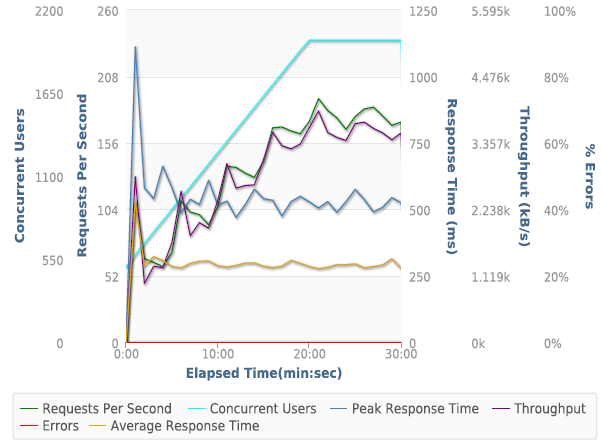
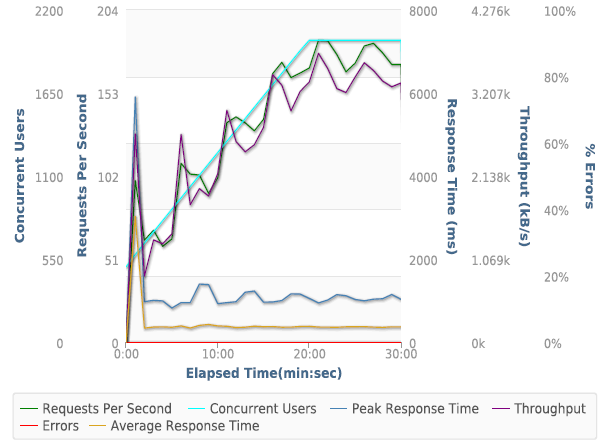
The first performance test was done with LoadStorm. Kinsta made it to the final round of testing where 2000 concurrent users were logging into WordPress and browsing the test site. The test was designed to test non-cached performance by logging users into WordPress. It caused many hosting setups to crumble. You can see Kinsta's result in this graph (click on it to play with the interactive results):
Kinsta aced the LoadStorm test. It had zero errors and one of the fastest average response times at 316ms. Kinsta also had the absolute lowest peak response time at 942ms. That's an astonishing feat, that over 30 minutes Kinsta served nearly 250,000 requests and not a single one took over a second to be delivered. Amazing.
Blitz
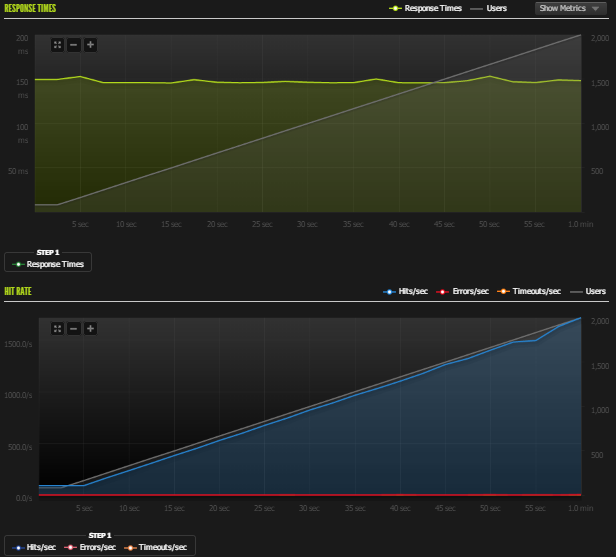
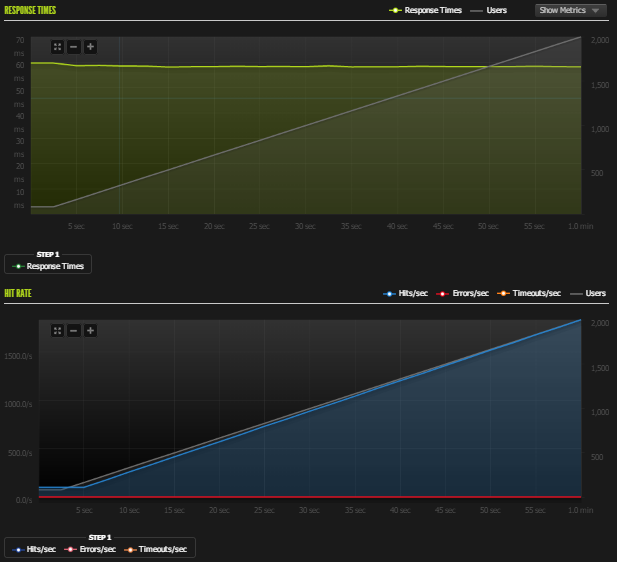
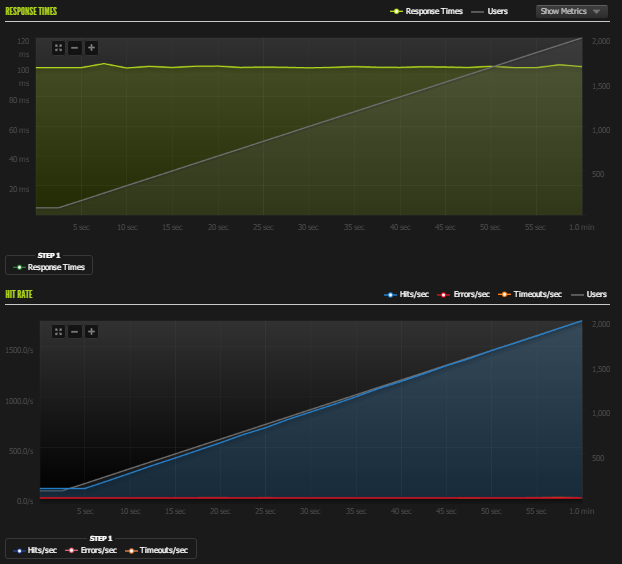
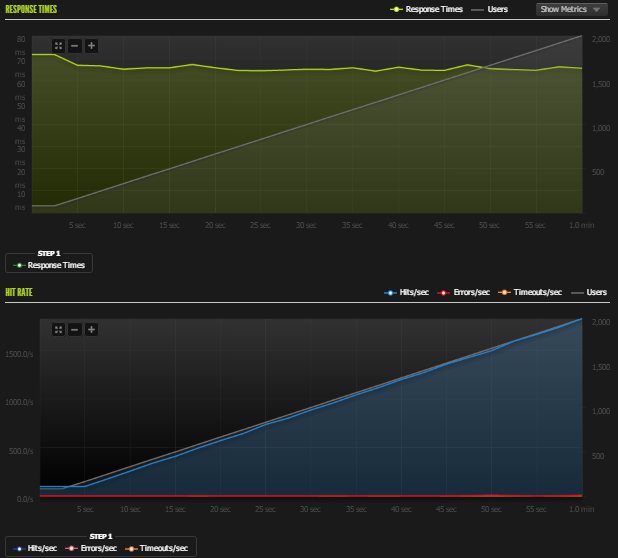
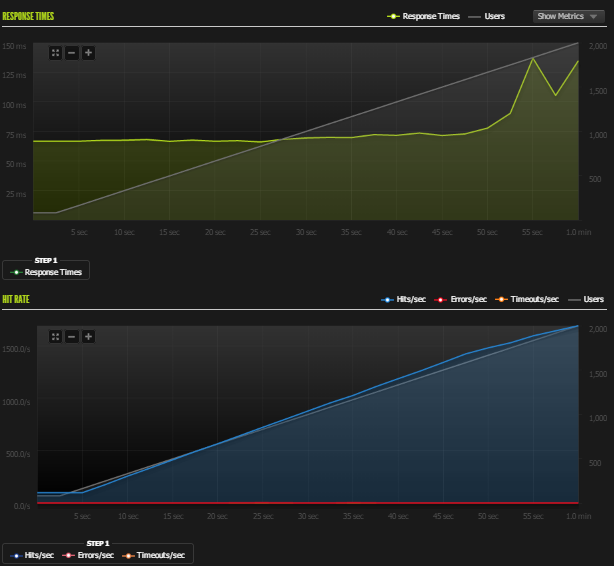
The second load test that was run on Kinsta was Blitz. Blitz was used to test cached performance. It simply requested the home page from 1-2000 times per second.
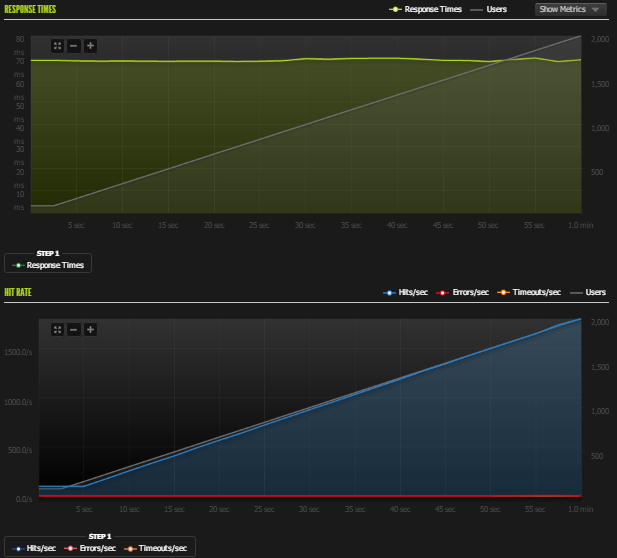
I can't draw lines this straight. The response time was flat. As you would expect from a company that aced the cache busting test, they didn't struggle in the slightest. Full Blitz Results (PDF)
Uptime
Two third-party uptime monitoring services (StatusCake and UptimeRobot) tracked the test site for a month. The results for Kinsta were perfect. 100% uptime according to both sources.
WebPageTest
“WebPagetest is an open source project that is primarily being developed and supported by Google as part of our efforts to make the web faster.” WebPageTest grades performance and allows you to run tests from multiple locations simulating real users. Kinsta was tested from Dulles, VA, Miami, FL, Denver, CO, and Los Angeles, CA.
| Company | Dulles,VA | Miami, FL | Denver, CO | Los Angeles, CA | Average |
| Kinsta | 0.759 | 0.752 | 0.947 | 0.592 | 0.7625 |
Kinsta had the second fastest average response time of all the companies we tested. No issues with this test in the slightest.
Conclusion
Kinsta, a new-comer to our testing, jumped straight to the top of the performance tiers. Kinsta’s performance was amazing in the Load Storm 2000 logged in user test. They had the lowest peak response time and zero errors over a 30 minute test. They didn’t struggle with any tests whatsoever and showed zero downtime. Kinsta’s performance was undoubtedly top tier.
Visit Kinsta









 WordPress & WooCommerce Hosting Performance Benchmarks 2021
 WooCommerce Hosting Performance Benchmarks 2020
 WordPress Hosting Performance Benchmarks (2020)
 The Case for Regulatory Capture at ICANN
 WordPress Hosting – Does Price Give Better Performance?
 Hostinger Review – 0 Stars for Lack of Ethics
 The Sinking of Site5 – Tracking EIG Brands Post Acquisition
 Dirty, Slimy, Shady Secrets of the Web Hosting Review (Under)World – Episode 1
 Free Web Hosting Offers for Startups