
Sponsored by LoadStorm. The easy and cost effective load testing tool for web and mobile applications.
The full company list, product list, methodology, and notes can be found here
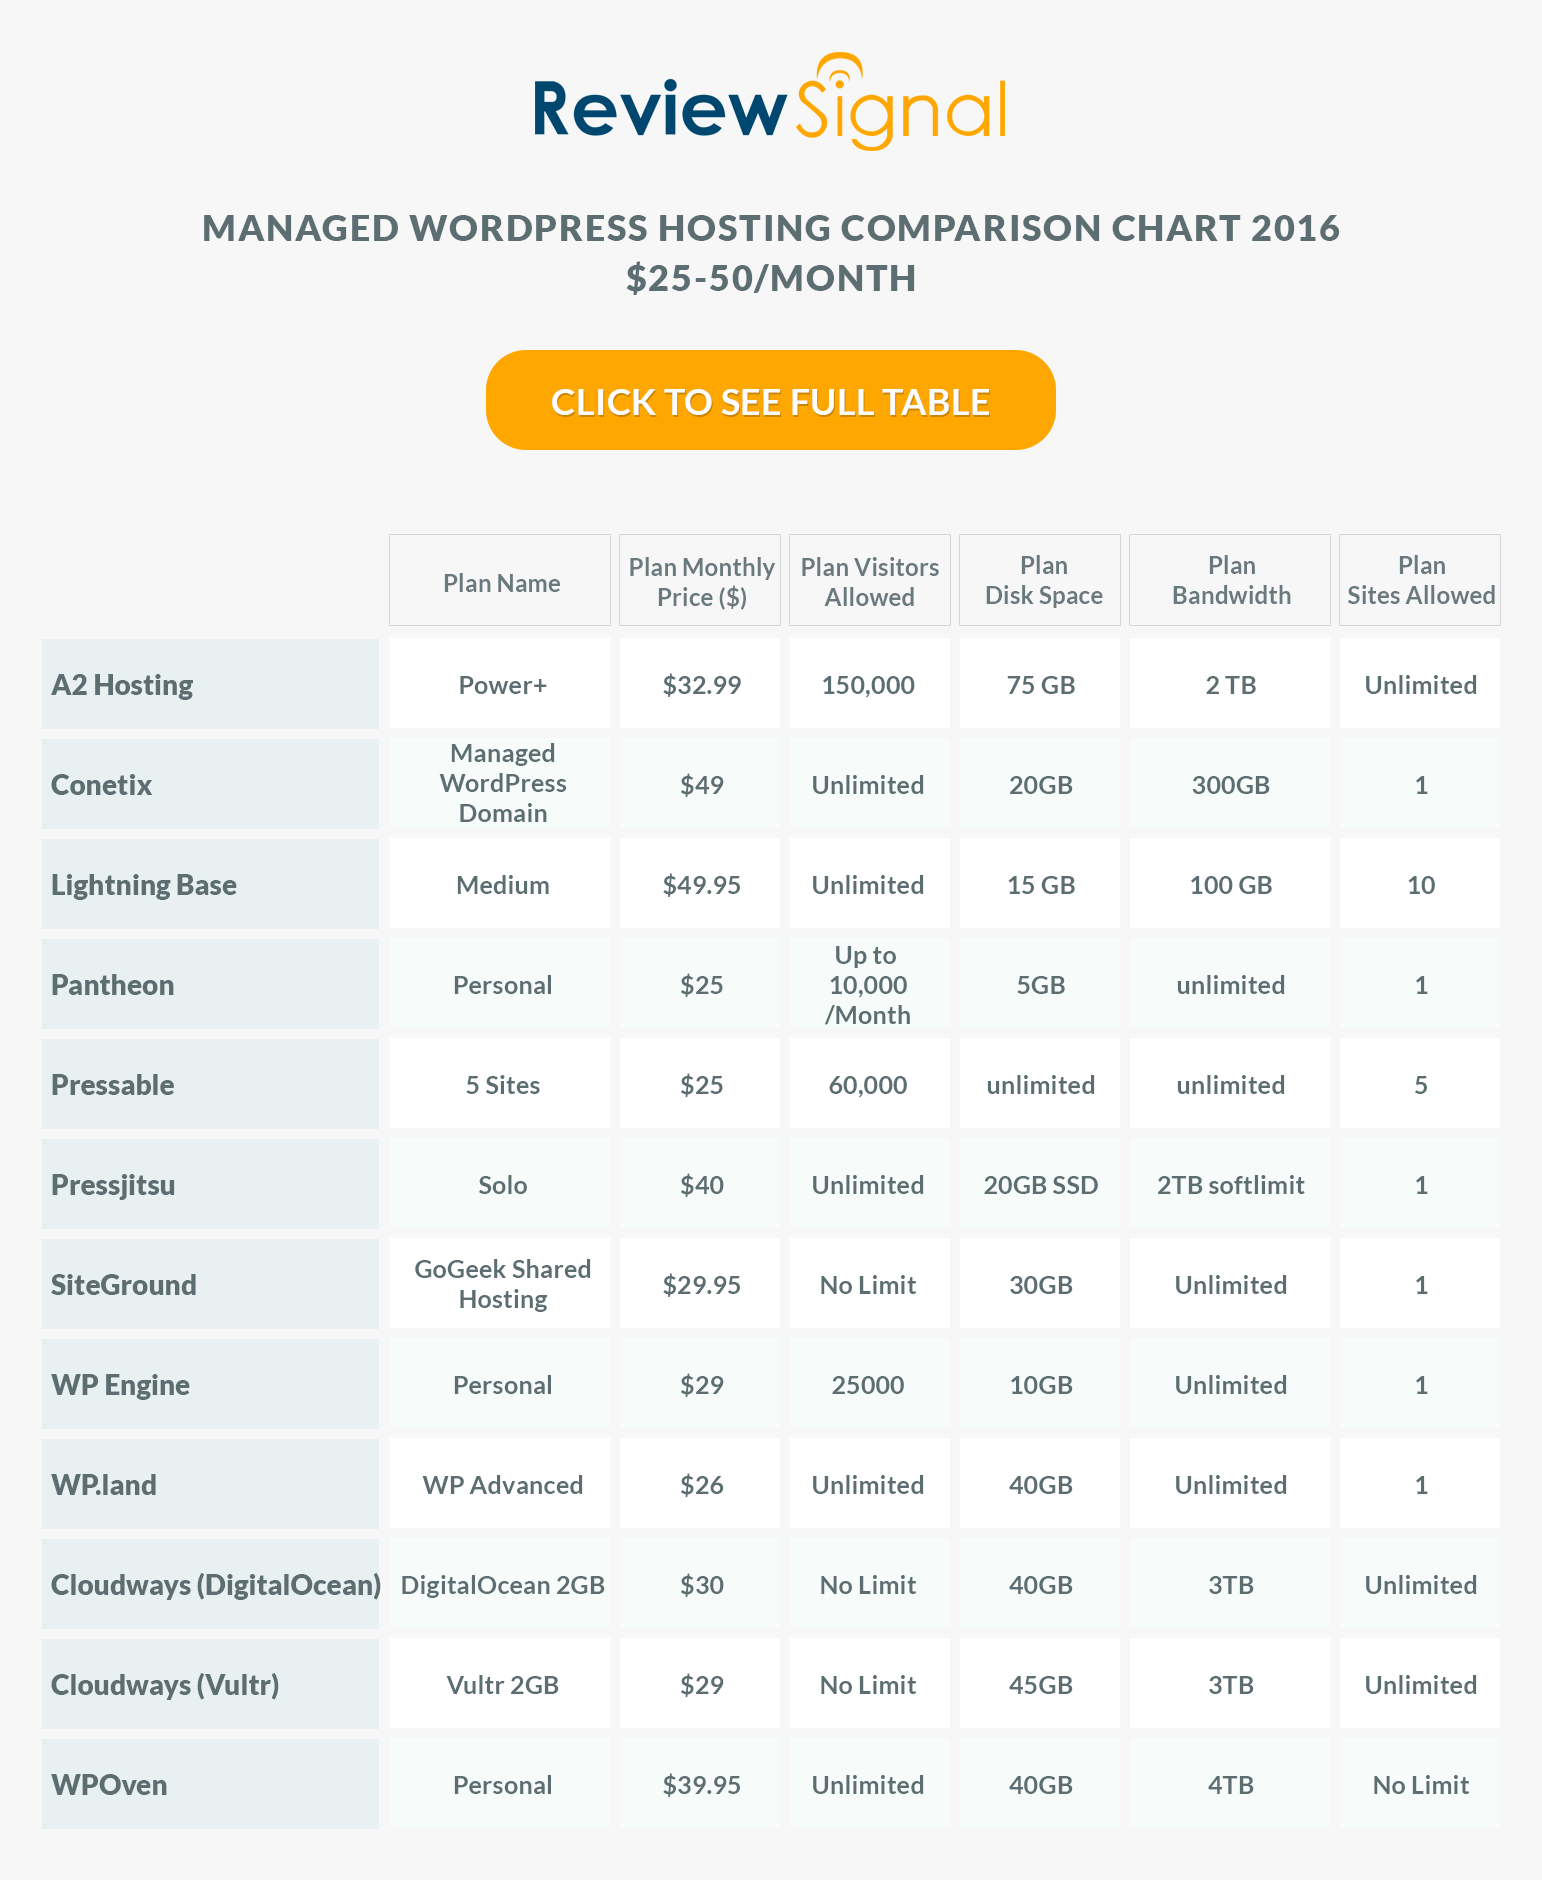
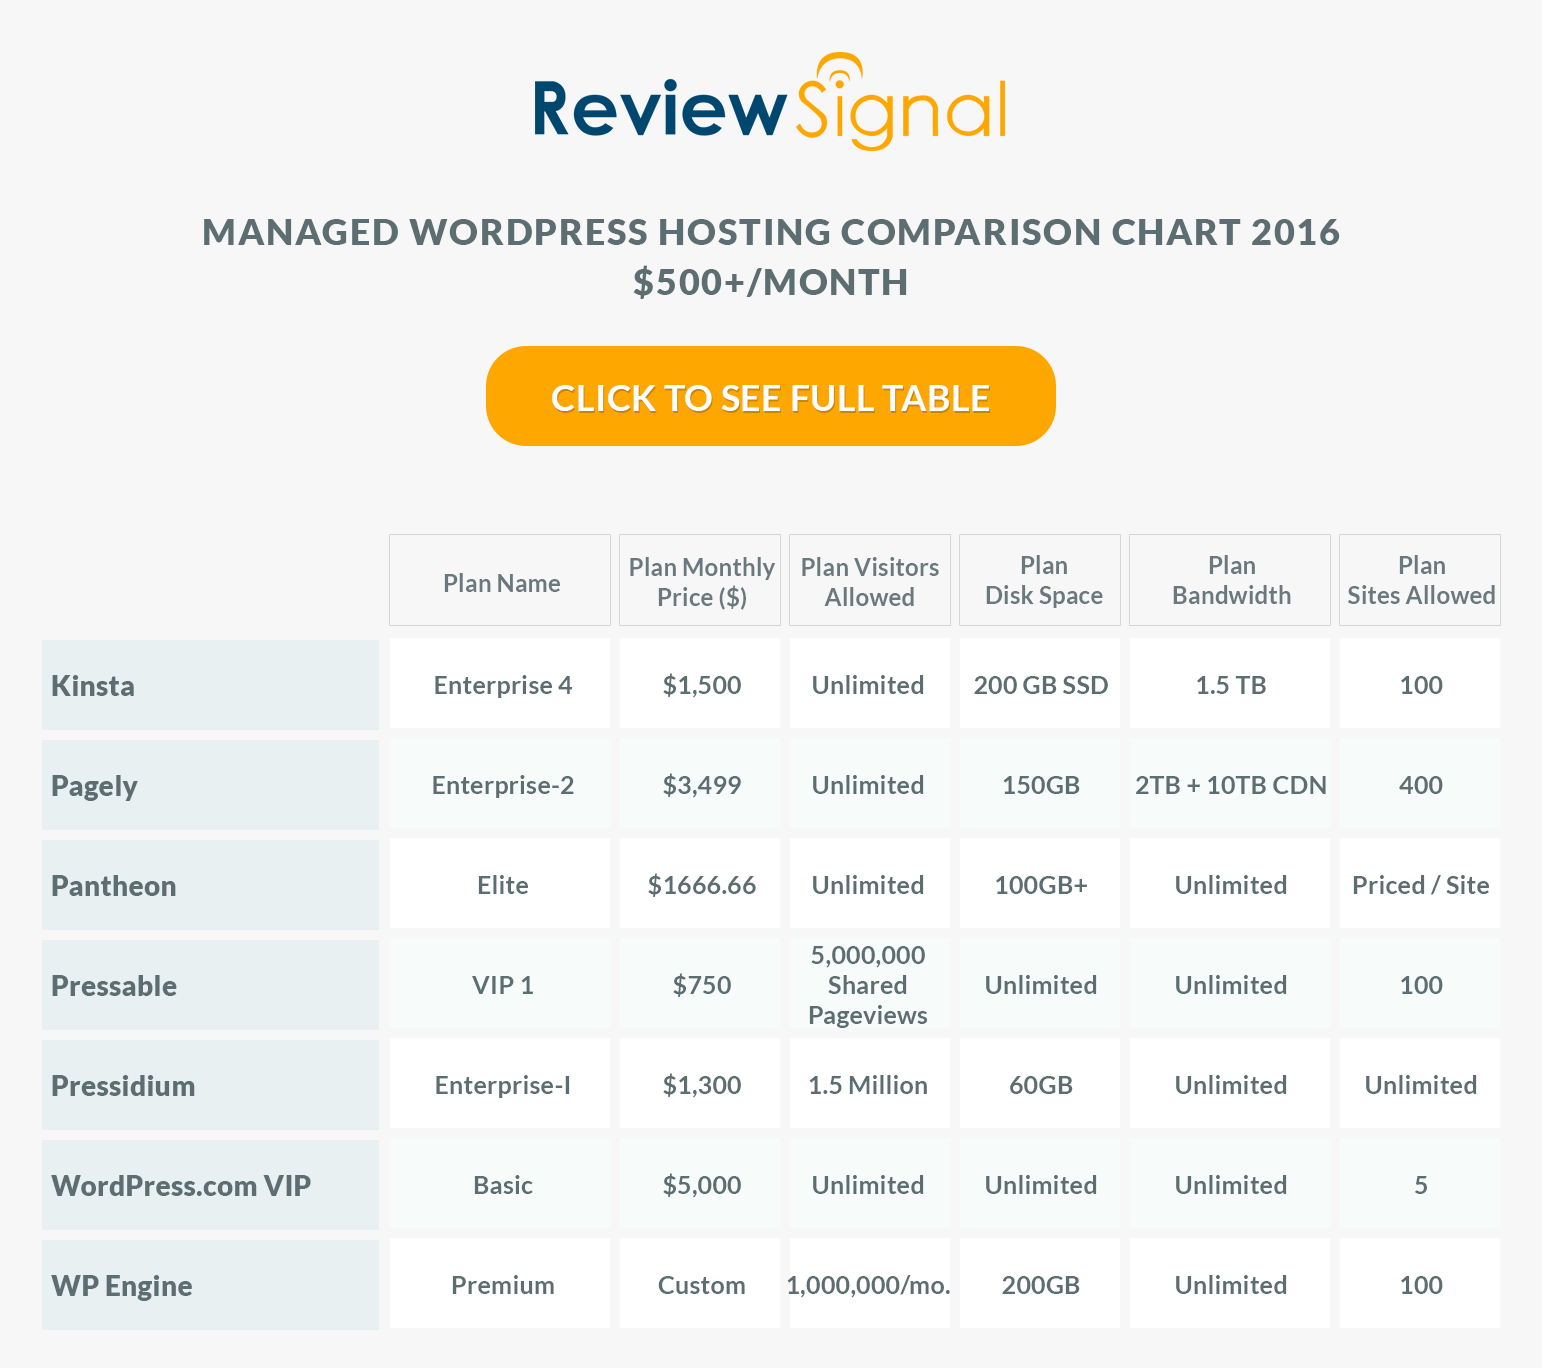
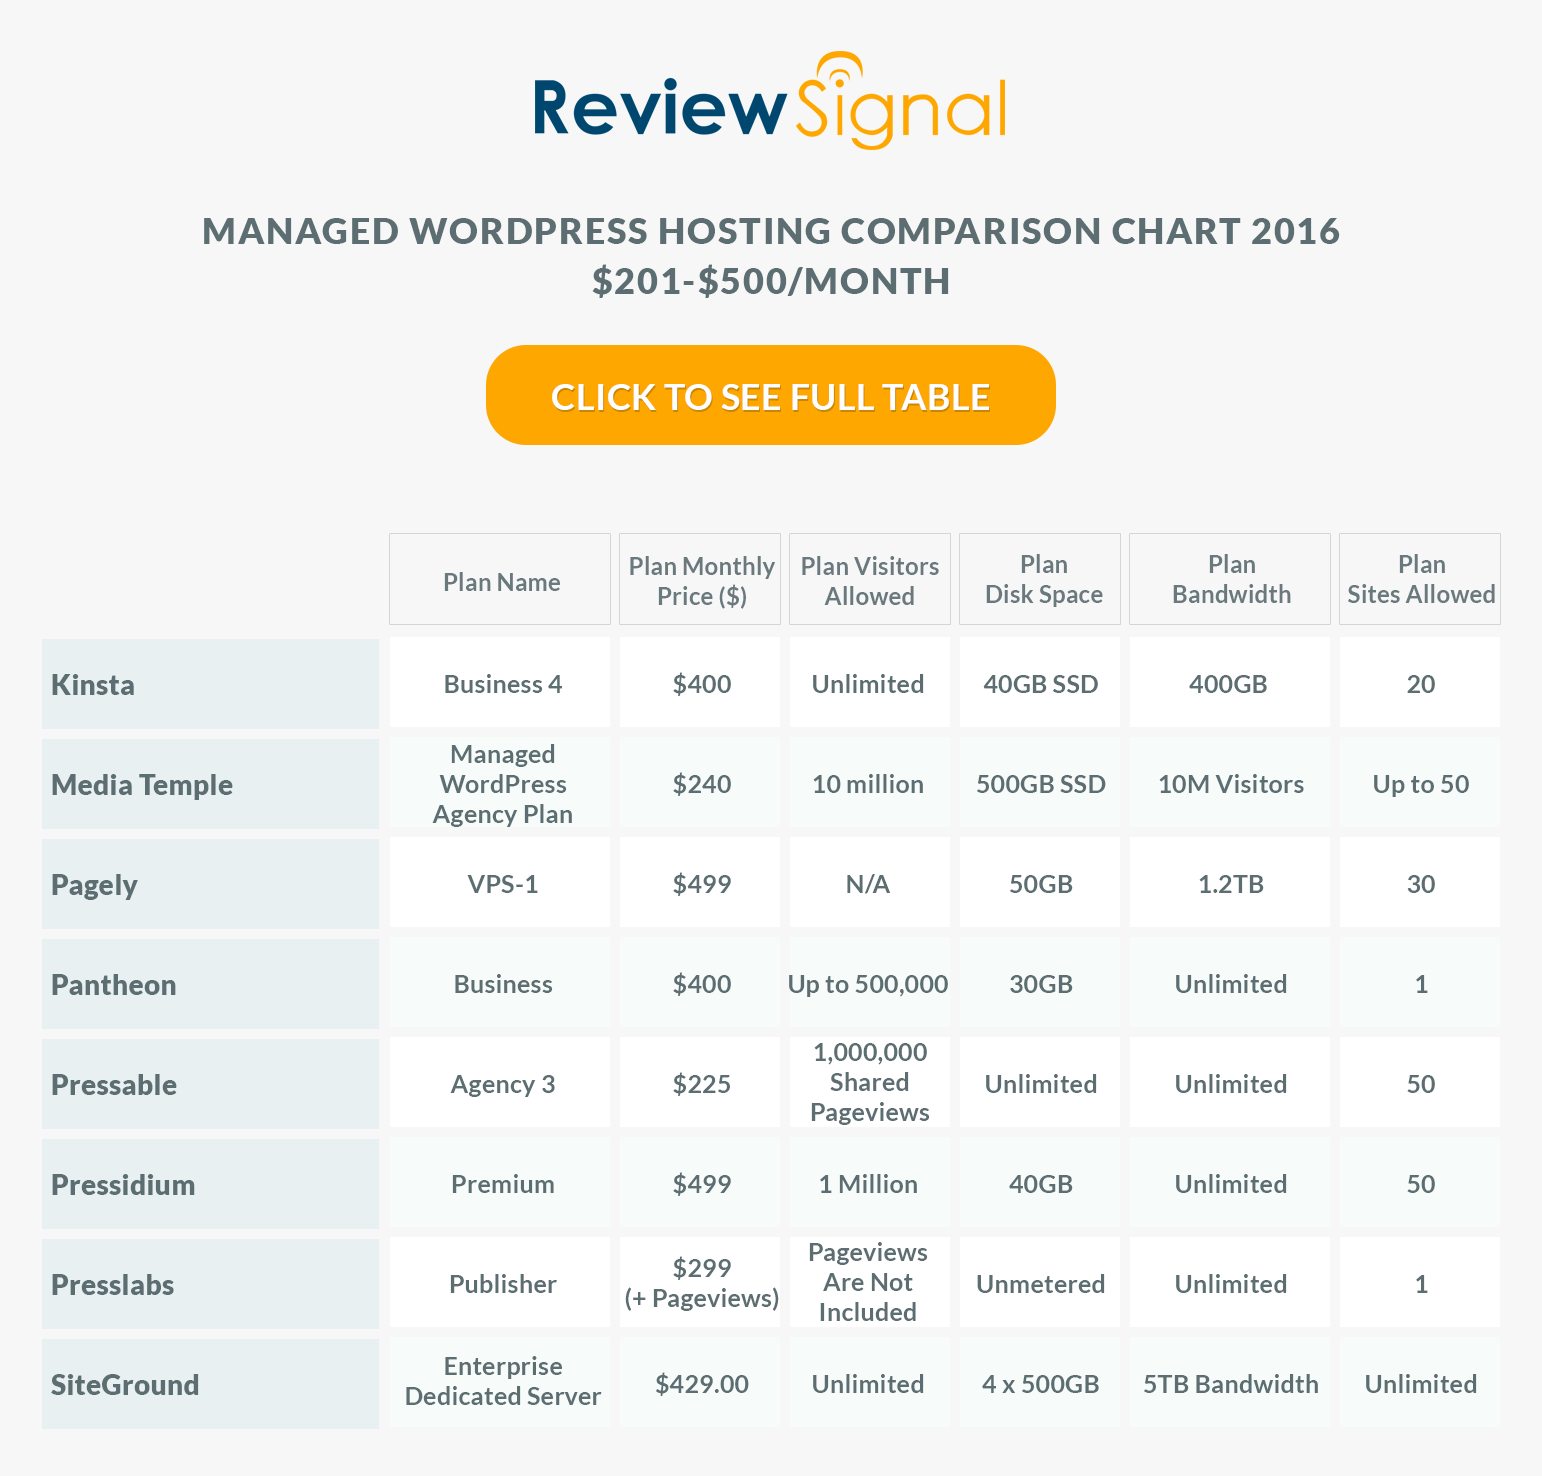
This post focuses only on the results of the testing in the $25-50/month price bracket for WordPress Hosting.
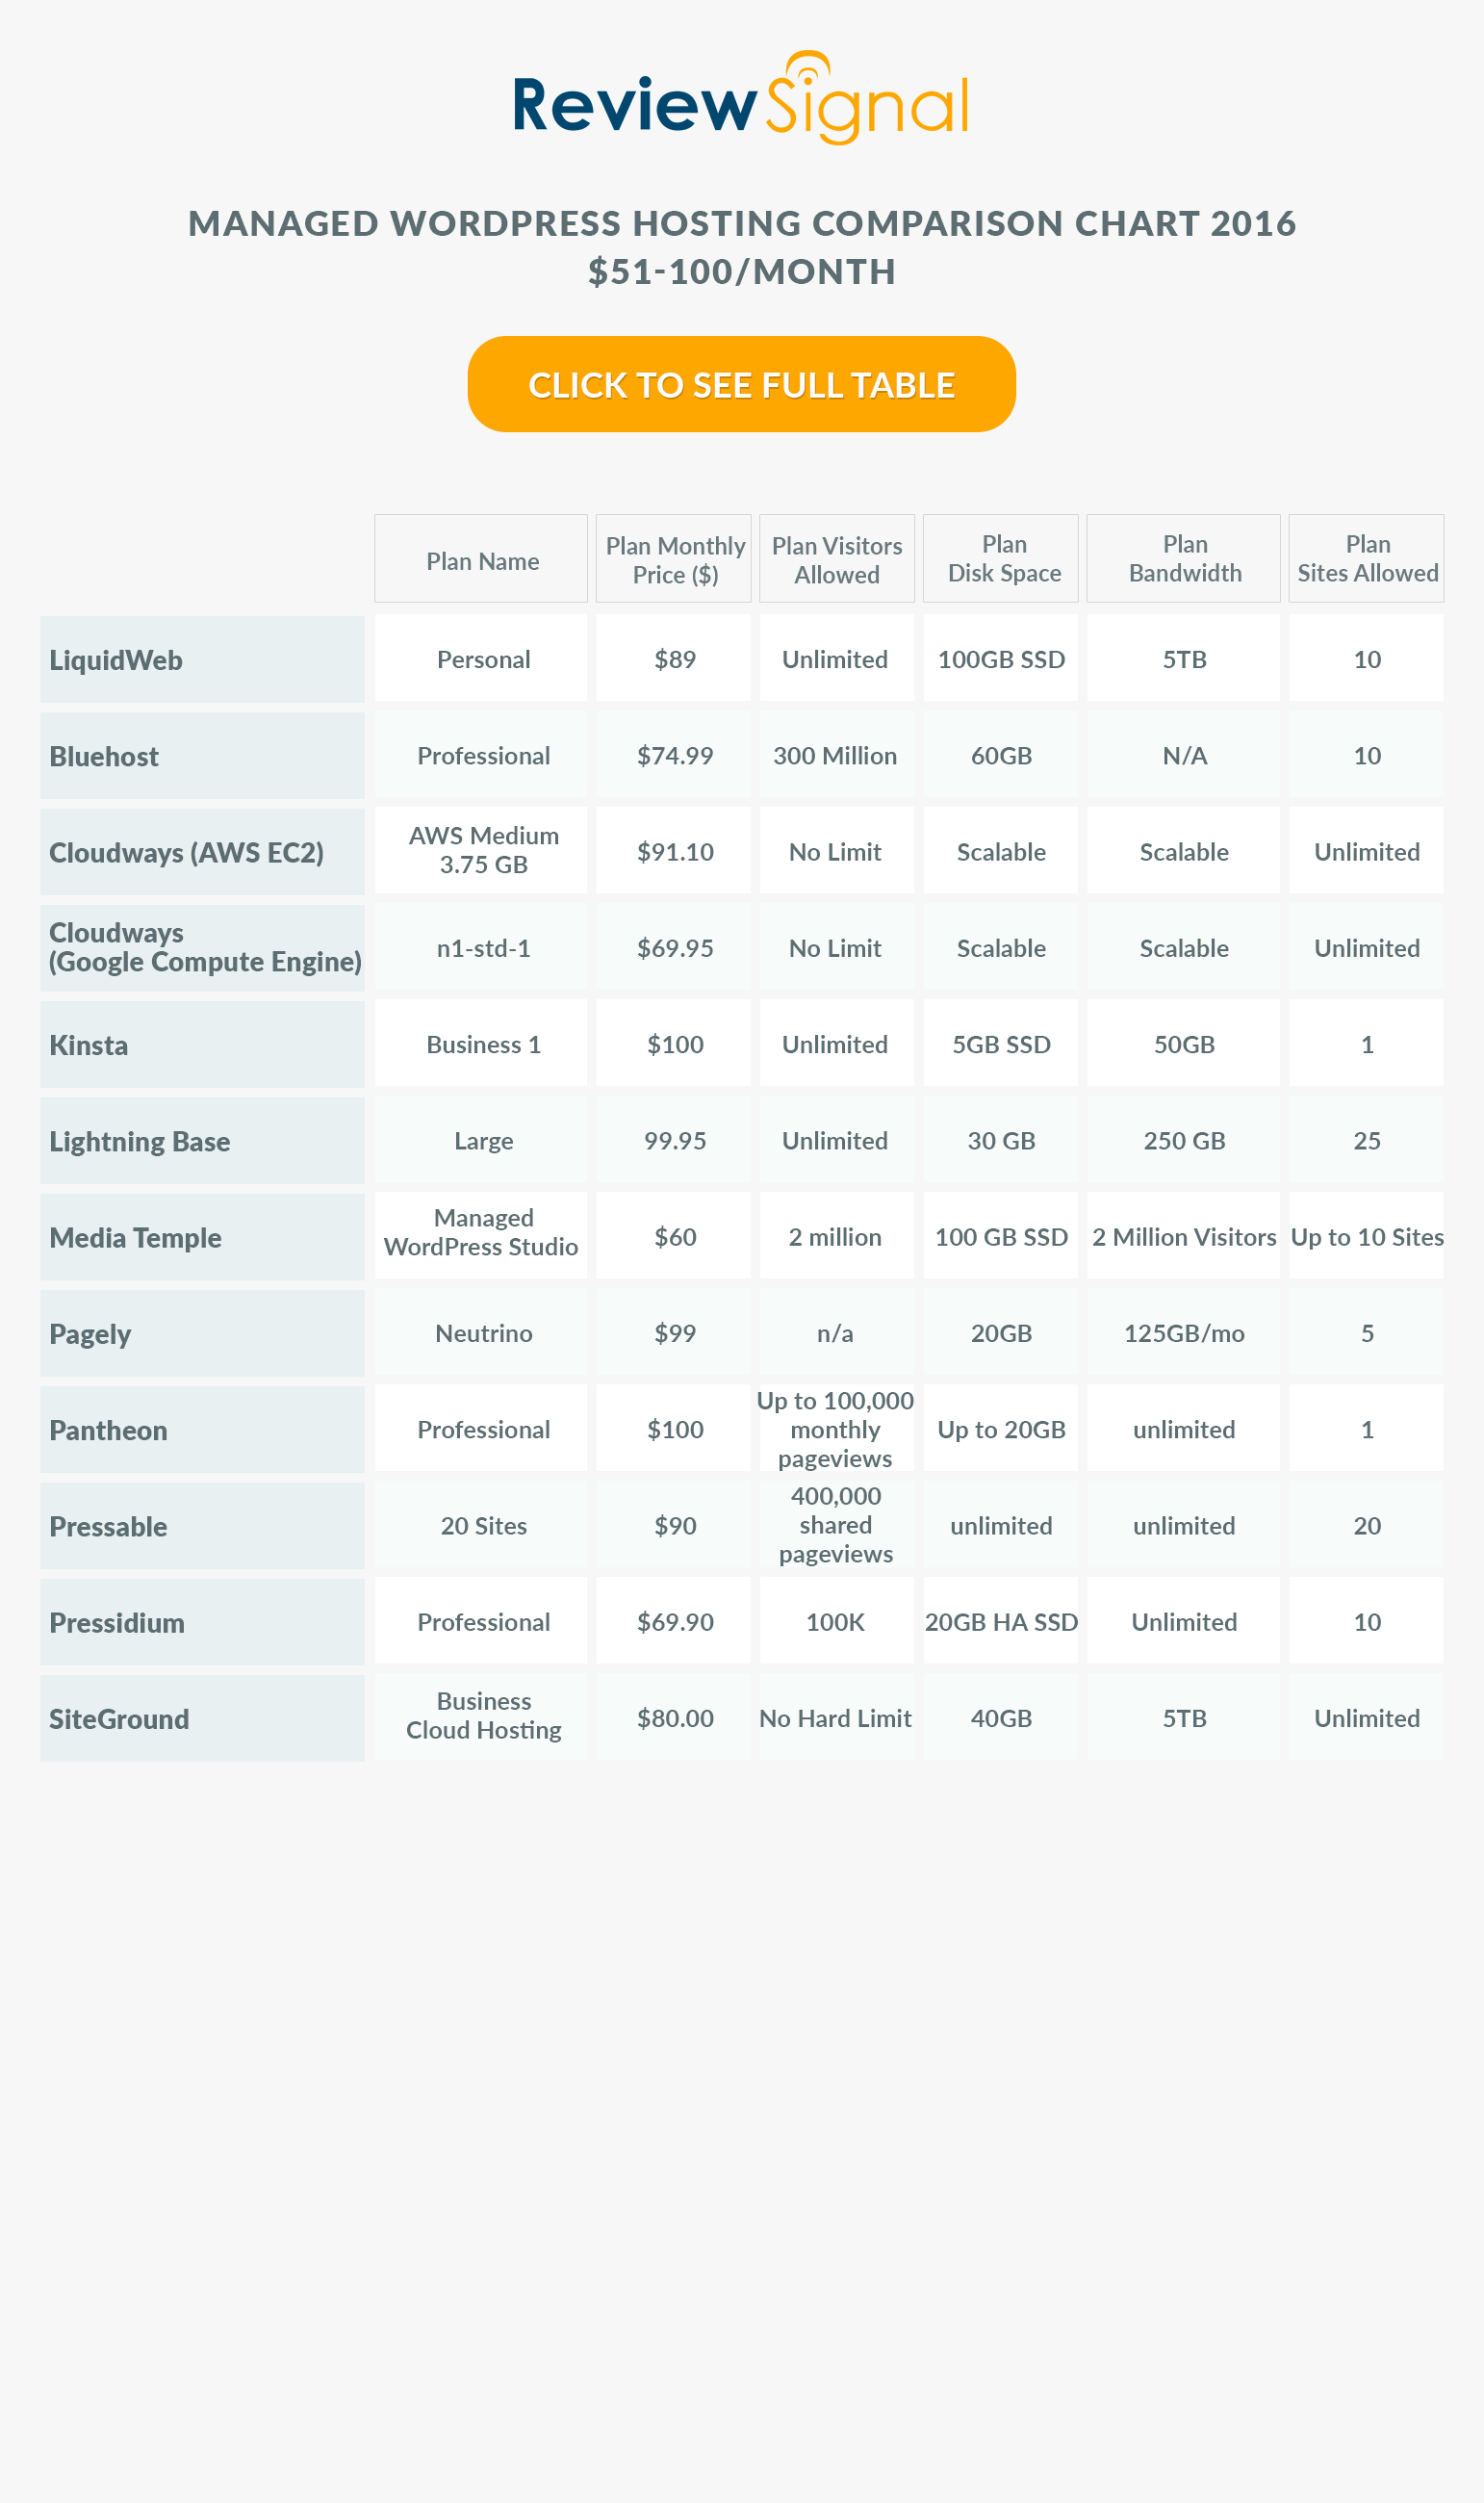
$25-50/Month WordPress Hosting Products
$25-50/Month WordPress Hosting Performance Benchmarks Results
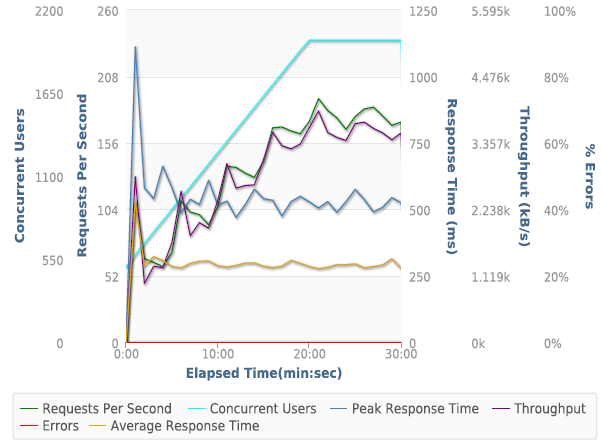
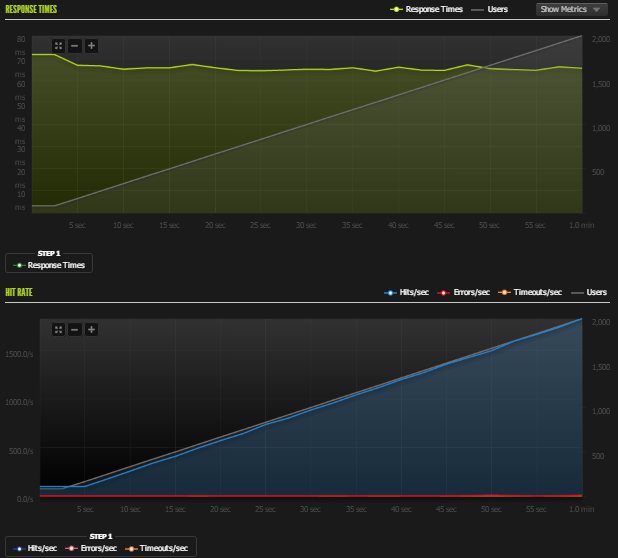
Test 500-2000 Concurrent Users over 30 Minutes, 10 Minutes at Peak
| Company |
Total Requests |
Total Errors |
Peak RPS |
Average RPS |
Peak Response Time(ms) |
Average Response Time(ms) |
Total Data Transferred (GB) |
Peak Throughput (MB/s) |
Average Throughput (MB/s) |
| A2 |
193764 |
68658 |
148.28 |
107.65 |
17563 |
6541 |
7.647 |
11.37 |
4.248 |
| CloudWays DO |
196963 |
54589 |
148.48 |
109.42 |
15809 |
5841 |
8.474 |
7.384 |
4.708 |
| CloudWays Vultr |
207994 |
50049 |
144.13 |
115.55 |
16187 |
5339 |
9.439 |
8.398 |
5.244 |
| Conetix |
169625 |
116960 |
134.43 |
94.24 |
18510 |
8578 |
2.635 |
3.898 |
1.464 |
| LightningBase |
315348 |
1 |
238.4 |
175.19 |
3567 |
272 |
16.34 |
13.47 |
9.077 |
| Pantheon |
268164 |
866 |
205.5 |
148.98 |
14422 |
315 |
6466 |
4927 |
3592 |
| Pressable |
394405 |
26 |
294.6 |
219.11 |
15101 |
226 |
16.4 |
13.32 |
9.111 |
| Pressjitsu |
300931 |
3913 |
228.47 |
167.18 |
11121 |
502 |
16.86 |
14.29 |
9.365 |
| SiteGround |
300999 |
0 |
232.75 |
167.22 |
10926 |
462 |
15.83 |
14.35 |
8.972 |
| WP Land |
294459 |
14976 |
235.63 |
163.59 |
15422 |
864 |
15.15 |
14.04 |
8.417 |
| WPEngine |
348796 |
26572 |
270.23 |
193.78 |
15091 |
311 |
14.95 |
11.38 |
8.307 |
| WPOven |
288369 |
0 |
217.85 |
160.21 |
5815 |
283 |
16.64 |
13.63 |
9.245 |
Discussion of Load Storm Test Results
Many companies handled this test without any sort of struggle: LightningBase, Pantheon [Reviews], Pressable, SiteGround [Reviews], and WPOven.com. In fact, SiteGround and WPOven managed to have zero errors, while LightningBase had 1. Truly impressive performances put on by these companies.
Pressjitsu struggled a little bit. There were some errors and increased response times at the start of the test. It managed to stabilize for the last 22 minutes as load increased though.
WPEngine [Reviews] and WP.land struggled a bit more than Pressjitsu, but didn't completely fall apart. Both seemed to be having issues with the wp-login page, possibly security related.
A2 Hosting [Reviews], CloudWays [Reviews] (Digital Ocean & Vultr), and Conetix did not do well during this test. High error rates and slow response times show they were not equipped to handle this type of load.
Test 1-1000 Concurrent Users over 60 seconds
Blitz Test Quick Results Table
Discussion of Blitz Test 1 Results
This test is just testing whether the company is caching the front page and how well whatever caching system they have setup is performing (generally this hits something like Varnish or Nginx).
Who performed without any major issues?
CloudWays (Digital Ocean & Vultr), LightningBase, Pantheon, Pressable, SiteGround [Reviews], WPEngine [Reviews], WP.land, and WPOven.com all handled the blitz test without any significant issues.
Who had some minor issues?
Pressjitsu again had what seems to be security related issues. A perfect flat response time but some timeouts at the end of the test.
Who had some major issues?
A2 Hosting and Conetix both failed the Blitz test.
3. Uptime Monitoring
Both uptime monitoring solutions were third party providers that offer free services. UptimeRobot was paid for and monitoring on a 1 minute interval. All the companies were monitored over approximately two months (May-June 2016).
Uptime Robot & StatusCake
| Company |
StatusCake |
UptimeRobot |
| A2 |
97.91 |
99.35 |
| CloudWays DO |
100 |
100 |
| CloudWays Vultr |
99.95 |
99.87 |
| Conetix |
99.92 |
99.93 |
| LightningBase |
100 |
100 |
| Pantheon |
100 |
100 |
| Pressable |
99.91 |
99.92 |
| Pressjitsu |
99.78 |
99.65 |
| SiteGround |
99.99 |
100 |
| WP Land |
99.92 |
100 |
| WPEngine |
100 |
99.99 |
| WPOven |
100 |
100 |
A2 had significant downtime issues with StatusCake recording 97.91% and UptimeRobot recording 99.35% uptime. The CloudWays Vultr server had some issues with UptimeRobot recording 99.87%. Pressjitsu also had some uptime problems with StatusCake recording 99.78% and UptimeRobot 99.65%.
Everyone else was above 99.9% on both monitors including CloudWays Digital Ocean, LightningBase, Pantheon, WPOven all recording perfect 100%/100% scores.
4. WebPageTest.org
Every test was run with the settings: Chrome Browser, 9 Runs, native connection (no traffic shaping), first view only.
| Company |
WPT Dulles |
WPT Denver |
WPT LA |
WPT London |
WPT Frankfurt |
WPT South Africa |
| A2 |
0.879 |
0.747 |
1.237 |
1.61 |
2.029 |
5.657 |
| CloudWays DO |
0.836 |
0.58 |
1.031 |
1.221 |
1.668 |
7.08 |
| CloudWays Vultr |
0.713 |
0.676 |
1.087 |
1.109 |
1.636 |
7.643 |
| Conetix |
2.328 |
2.078 |
2.242 |
3.845 |
3.497 |
8.69 |
| LightningBase |
0.567 |
0.563 |
1.054 |
1.067 |
1.511 |
4.199 |
| Pantheon |
0.86 |
0.583 |
1.024 |
1.259 |
1.649 |
7.625 |
| Pressable |
0.945 |
0.715 |
1.162 |
1.533 |
2.013 |
9.377 |
| Pressjitsu |
0.94 |
0.549 |
0.93 |
1.33 |
1.912 |
6.288 |
| SiteGround |
0.838 |
0.655 |
1.043 |
1.063 |
1.693 |
6.927 |
| WP Land |
0.816 |
0.622 |
1.002 |
1.189 |
1.693 |
3.307 |
| WPEngine |
0.872 |
0.523 |
0.939 |
1.199 |
1.796 |
4.434 |
| WPOven |
0.85 |
0.534 |
1.093 |
1.452 |
1.79 |
4.844 |
| Company |
WPT Singapore |
WPT Shanghai |
WPT Japan |
WPT Sydney |
WPT Brazil |
| A2 |
2.956 |
22.788 |
2.231 |
2.609 |
2.342 |
| CloudWays DO |
2.123 |
22.42 |
1.898 |
1.713 |
1.755 |
| CloudWays Vultr |
2.223 |
22.573 |
1.832 |
1.7 |
1.797 |
| Conetix |
2.027 |
23.425 |
2.63 |
1.308 |
3.56 |
| LightningBase |
2.041 |
23.977 |
1.717 |
1.848 |
1.667 |
| Pantheon |
2.194 |
22.605 |
1.769 |
1.661 |
1.784 |
| Pressable |
2.451 |
22.258 |
2.194 |
3.079 |
2.049 |
| Pressjitsu |
2.046 |
22.352 |
1.73 |
1.416 |
2.055 |
| SiteGround |
2.245 |
23.087 |
1.806 |
2.27 |
1.855 |
| WP Land |
2.157 |
22.428 |
1.872 |
1.658 |
1.784 |
| WPEngine |
2.121 |
24.584 |
1.87 |
2.051 |
1.863 |
| WPOven |
2.089 |
2.82 |
1.796 |
1.712 |
1.859 |
What I learned was getting traffic into China is terrible. Nobody really did well on the Shanghai location except WPOven which somehow didn't get the delay that every other company experienced. South Africa is also really slow. Most servers were US based but were delivering content to most corners of the world in about 2 seconds or less which is impressive.
Conetix is an Australian focused company and they delivered to Sydney faster than anyone which is a relief that the geographic advantage is real. Beyond the Australian market the connectivity seemed slower to just about every other location. Australia has notoriously bad connectivity though, so I can see the advantage of having a company specializing in the local market.
I wish I could compare averages against last year except they removed one of the testing locations (Miami) and I did a global test instead because that was something people wanted to see.
The US connectivity is very fast though, with everyone delivering to Dulles(VA) and Denver (CO) in under a second (minus the Australian server) with LA at about one second exactly for everyone.
| Company |
PHP Bench [Seconds] (lower=faster) |
WP Bench [Queries Per Second](higher=faster) |
| A2 |
18.456 |
592.77 |
| CloudWays DO |
15.028 |
353.98 |
| CloudWays Vultr |
13.145 |
392.62 |
| Conetix |
12.833 |
410.51 |
| LightningBase |
10.795 |
1353.18 |
| Pantheon |
12.292 |
189.54 |
| Pressable |
11.062 |
525.21 |
| Pressjitsu |
12.771 |
648.09 |
| SiteGround |
11.414 |
1109.88 |
| WP Land |
13.491 |
1094.09 |
| WPEngine |
13.494 |
406.17 |
| WPOven |
9.412 |
690.61 |
In this tier, there was a lot more normalized spread on the PHP Bench with most people being within the 10-14 second range we saw last year. WPOven lead the pack at 9.4. A2 was the slowest at 18.456.
The WP Bench scores varied a lot, again. LightningBase had another blazingly fast score of 1353.18. Siteground and WPLand also broke the 1000 barrier, whereas last year's fastest was 889. At the bottom of the pack was Pantheon with 189.54, which I am sure they would say infrastructure plays a large role in. Anyone with a distributed/non-local SQL database will be slower by a lot. They would probably argue that's one of the trade-offs of scalability and based on their load testing performance, it would be hard to argue against.
Conclusion
A very crowded bracket with lots of competition. This range is still pretty entry level, not the cheapest stuff like the <$25/month plans I compared. But with increased price came better performances. Although two of the top tier companies in this bracket make up two of the three top tier performers in the cheapest bracket. But it is nice to see some loose price to performance correlation in the market. Many of these plans are the entry level for their respective companies.
One of the interesting things to watch was the VPSs in this range (A2, CloudWays, Pressjitsu). They were outperformed by the Shared/Cloud providers who can presumably burst more shared resources for any given site. So for spikey sites that expect to get a Reddit/Slashdot effect, there may be some advantage in being in that sort of environment (if you cant easily scale the VPS, which some providers make quite easy). But since these are dummy sites not really tested heavily over the two months, there is the potential for bad neighbors negatively impacting you too during such a spike, and then you might want your own isolated VPS. I can see arguments for for both sides.
Without further ado, I will tell you who had the best performance, who deserved an honorable mention and then analyze each host individually. I still don't believe in ranking in any particular order, only grouping companies by how well they performed.
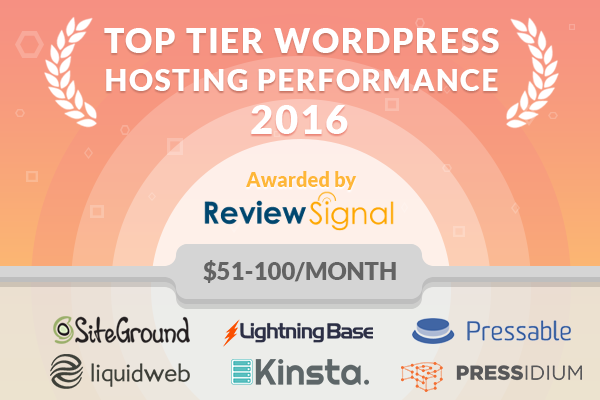
Top Tier WordPress Hosting Performance
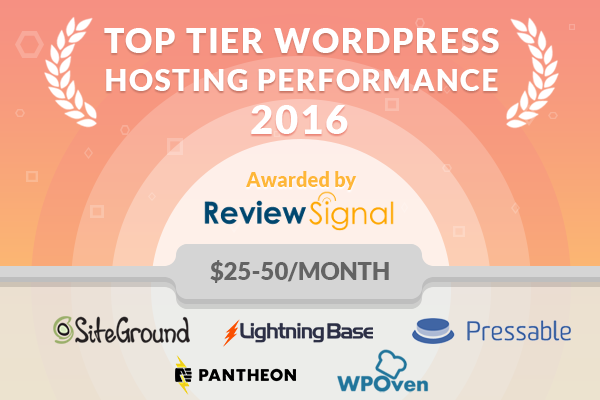
LightningBase, Pantheon, Pressable, SiteGround [Reviews] and WPOven.com.
Honorable Mentions
Unfortunately, no company deserves honorable mention status which I give to companies that came close but weren't quite perfect or they looked like they were good but something external (generally security measures) interfered with the tests but from all other indications they seemed to be doing well.
The closest in this bracket would have been Pressjitsu, except they had uptime issues which I give no leeway for being under 99.9%.
Individual Host Analysis
A2 Hosting [Reviews]
I try to find bright spots in a company's performance, but A2 really didn't have one in this test. If you buy a VPS there is also no default way to install WordPress beyond the old fashioned DIY. You have to pay extra for Softaculous installer from the admin panel.
CloudWays [Reviews] Digital Ocean / Vultr
The most interesting part of CloudWays is being able to see the same stack tested on multiple providers. It's a small sample, but it looks like Vultr marginally outperforms Digital Ocean in performance. Although, Digital Ocean was more stable (again, small sample size to compare head to head). It was nice to see CloudWays do well with the Blitz tests and keep very good uptime, especially the Digital Ocean machine which was perfect.
Conetix
Conetix had good uptime and connection to Australia, their target market. They strongly using W3TC but it didn't come fully installed and I don't test anything beyond the default configuration because it gets into too much minutia and conflict with hosts about what could be done to improve scores. I also believe most people just stick with the default based on all the user testing I've seen across various fields. So the unfortunate results were the load test performances didn't look very good for them.
(9/19/2019 Update) Conetix have issued their own statement regarding Review Signal's test and why they believe this methodology doesn't accurately represent their performance and why a unique Australian perspective is required when evaluating them. I recommend reading the full details.
LightningBase
LightningBase put on basically a perfect performance. 100% uptime on both monitors. 0 errors on blitz, 1 error on loadstorm. Unequivocally, a top tier performance.
Pantheon [Reviews]
Pantheon showed up again, in a good way. They earned themselves a top tier performance accolade. They had a few errors at the start of the LoadStorm test, but beyond that aced everything.
Pressable
Pressable is back for the first time since my first testing in 2013, with new ownership (WordPress.com). They had had some good tech back then but it wasn't perfect and had some minor issues. I can happily say that has changed as they delivered a top tier performance this year with no issues in any test.
Pressjitsu
Pressjitsu felt like 2013 Pressable, the foundations of a really good company but just didn't get it all put together. The biggest problem was the sub 99.9% uptime. They had what appeared to be security measures mar the blitz test and had some errors at the start of the LoadStorm test but managed to stabilize for the duration and put on a good showing.
SiteGround [Reviews]
SiteGround got even better this year. They jumped up from honorable mention to top tier status. Their Blitz and LoadStorm tests both improved while everything else remained at a high level. An all around fantastic performance which deserved top tier status.
WPEngine [Reviews]
WPEngine fell slightly this year, it could have been a security issue with wp-login during the LoadStorm test, but there were too many errors to give it honorable mention status for this plan which it earned last year. Everything else looked good though.
WP.land
WP Land like WPEngine had too many problems during the LoadStorm test that it didn't earn honorable mention status. Everything else looked very good for them and it's great to see a strong new entrant.
WPOven.com
The knock on WPOven last year was their LoadStorm test. Everything else was perfect. I'm glad they maintained everything else, but this time they managed a perfect LoadStorm test to boot. A huge improvement and a very well deserved entry in the top tier of WordPress Hosts in the $25-50 range.

 WordPress & WooCommerce Hosting Performance Benchmarks 2021
 WooCommerce Hosting Performance Benchmarks 2020
 WordPress Hosting Performance Benchmarks (2020)
 The Case for Regulatory Capture at ICANN
 WordPress Hosting – Does Price Give Better Performance?
 Hostinger Review – 0 Stars for Lack of Ethics
 The Sinking of Site5 – Tracking EIG Brands Post Acquisition
 Dirty, Slimy, Shady Secrets of the Web Hosting Review (Under)World – Episode 1
 Free Web Hosting Offers for Startups