
Sponsored by LoadStorm. The easy and cost effective load testing tool for web and mobile applications.
This is the second round of managed WordPress web hosting performance testing. You can see the original here. The latest (2015 Edition) can be found here.
Companies Tested
A Small Orange* [Reviews]
BlueHost [Reviews]
CloudWays* [Reviews]
DreamHost [Reviews]
FlyWheel* [Reviews]
GoDaddy* [Reviews]
Kinsta*
LightningBase*
MediaTemple* [Reviews]
Nexcess*
Pagely* [Reviews]
Pantheon* [Reviews]
PressLabs*
SiteGround*† [Reviews]
WebSynthesis* [Reviews]
WPEngine* [Reviews]
Note: Digital Ocean and Pressable were removed from testing.
*Company donated an account to test on. I checked to make sure I was on what appeared to be a normal server.
†Tests were performed with SiteGround's proprietary SuperCacher module turned on fully.
The Products (Click for Interactive Table)

Methodology
The question I tried to answer is how well do these WordPress hosting services perform? I tested each company on two distinct measures of performance: peak performance and consistency.
All tests were performed on an identical WordPress dummy website with the same plugins except in cases where hosts added extra plugins. Each site was monitored for one month (July 2014) for consistency.
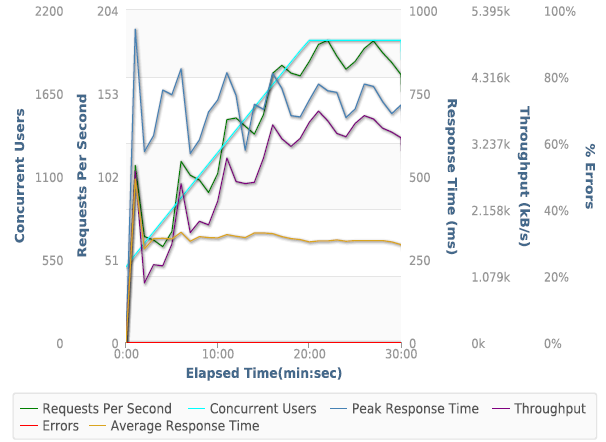
1. LoadStorm
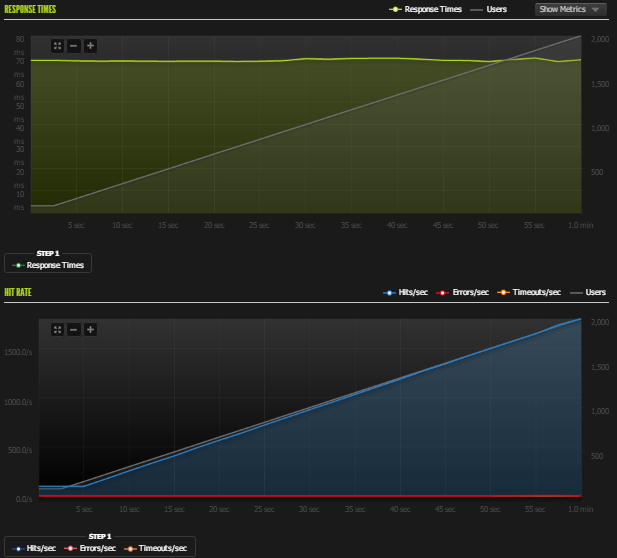
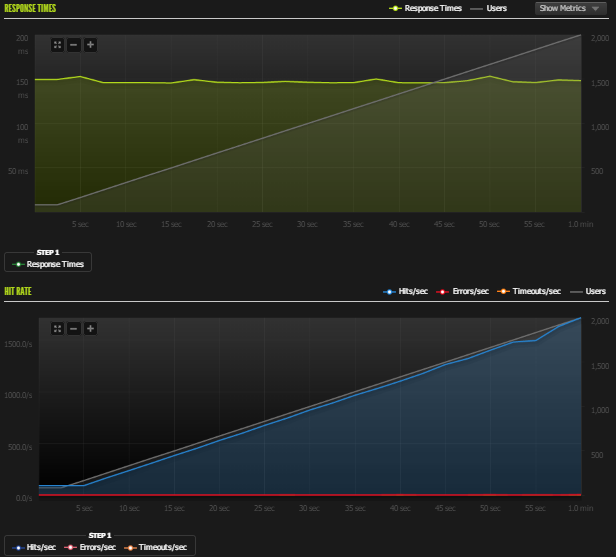
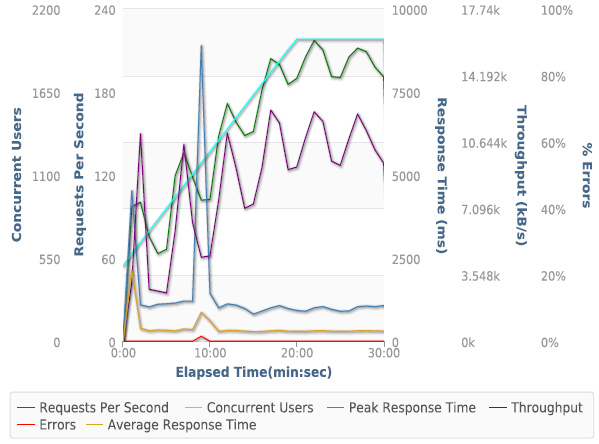
LoadStorm was kind enough to give me unlimited resources to perform load testing on their platform and multiple staff members were involved in designing and testing these WordPress hosts. I created identical scripts for each host to load a site, login to the site and browse the site. Then I increased the user load until a web host started to fail. I stopped at 2000 concurrent users for the web hosts that were left unscathed by load testing. Logged in users were designed to break some of the caching and better simulate real user load which a lot of people (both readers and hosting companies) requested after the first round of testing.
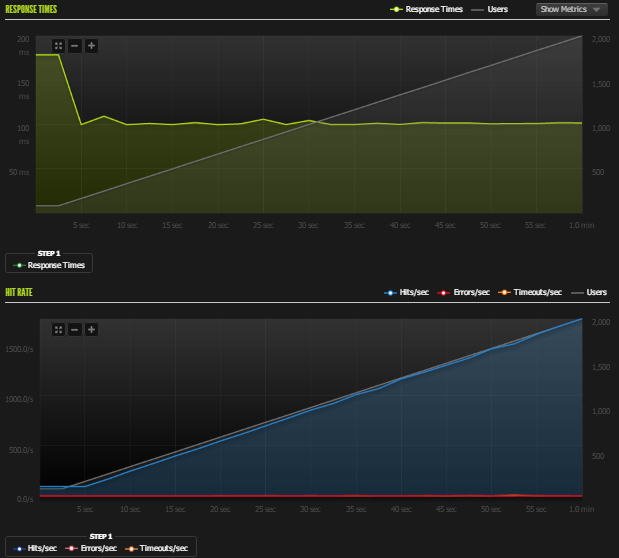
2. Blitz.io
I used Blitz again to compare against previous results. First test was 60 seconds, scaling from 1-1000 users. The second test was 60 seconds, scaling from 1-2000.
3. Uptime (UptimeRobot and StatusCake)
Consistency matters. I wanted to see how well these companies performed over a longer period of time. I used two separate uptime monitoring services over the course of a month to test consistency.
4. WebPageTest.org
"WebPagetest is an open source project that is primarily being developed and supported by Google as part of our efforts to make the web faster." WebPageTest grades performance and allows you to run tests from multiple locations simulating real users. I tested from Dulles, VA, Miami, FL, Denver, CO, and Los Angeles, CA.
Background Information
Before I go over the results I wanted to explain and discuss a few things. Every provider I tested had the latest version of WordPress installed. I had to ask a lot of companies to disable some security features to perform accurate load tests. Those companies were: GoDaddy, LightningBase, MediaTemple, SiteGround and WebSynthesis. I also asked DreamHost and WPEngine, but they refused my request.
Some companies were more cooperative than others. SiteGround spent hours with me customizing their security features to let the load testing tools bypass their security measures. PressLabs ran into an issue we were never able to resolve to get Load Storm to work properly on their servers. We spent hours trying to fix it, but couldn't find a solution. That's why they are missing some test data.
CloudWays is an interesting platform that let's you deploy your WordPress stack to either Digital Ocean or Amazon's EC2 servers. I was given a server on each platform of near comparable specs (EC2 Small 1.7GB vs Digital Ocean 2GB). So CloudWays is listed as CloudWays AWS and CloudWays DO to indicate which provider the stack was running on.
Pantheon was tested on their free development environment which I was told is identical to their production environment.
Results
I ran multiple Load Storm tests to get a sense of where to start testing. The first was 1-100 users, which not a single company struggled with. The second was 50-500 users, which again nobody struggled with. So the first meaningful test was 100-1000 users. For the companies that didn't struggle there, I did a 500-2000 user test. I ran these tests with an immense amount of help from Scott Price at LoadStorm. He spent hours with me, teaching me how to use LoadStorm, build tests and offering guidance/feedback on the tests themselves.
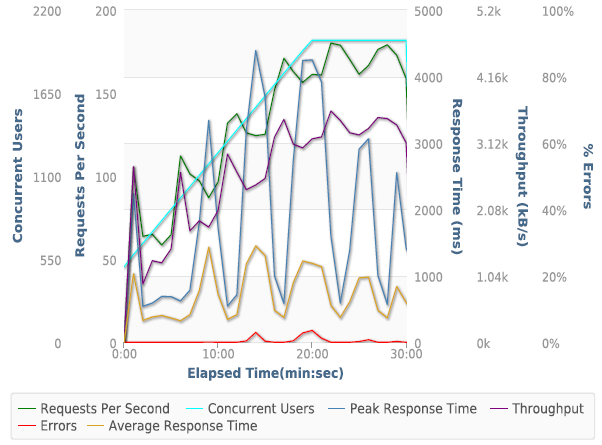
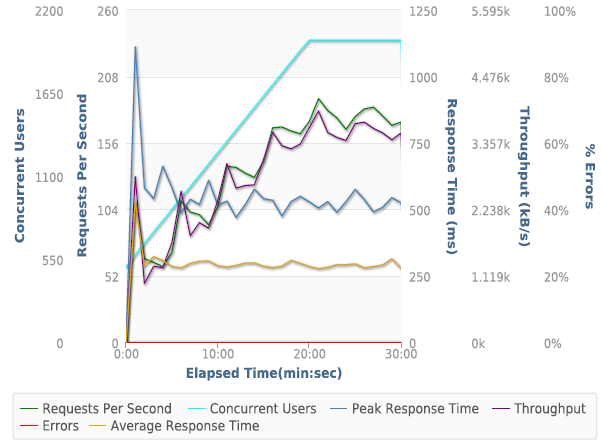
Test 1. 100-1000 Concurrent Users over 30 minutes
|
Request Count |
Average RPS |
Peak Response Time (ms) |
Average Response Time (ms) |
Average Throughput (kB/s) |
Errors |
| A Small Orange |
116127 |
64.52 |
2752 |
356 |
1318.55 |
41 |
| BlueHost |
107427 |
59.68 |
16727 |
1306 |
1159.55 |
13351 |
| Cloudways DO |
103359 |
55.57 |
16983 |
1807 |
1169.28 |
2255 |
| Cloudways AWS |
87447 |
47.01 |
16286 |
5436 |
821.75 |
18530 |
| DreamHost |
115634 |
62.17 |
15514 |
441 |
1244.31 |
4327 |
| FlyWheel |
116027 |
62.38 |
775 |
368 |
1287.86 |
0 |
| GoDaddy |
133133 |
71.58 |
1905 |
434 |
3883.42 |
0 |
| Kinsta |
116661 |
62.72 |
552 |
309 |
1294.77 |
0 |
| LightningBase |
117062 |
62.94 |
1319 |
256 |
1324.89 |
12 |
| MediaTemple |
116120 |
62.43 |
793 |
403 |
1304.27 |
0 |
| Nexcess |
116634 |
62.71 |
15085 |
294 |
1299.85 |
8 |
| Pagely |
119768 |
64.39 |
1548 |
461 |
1227.06 |
0 |
| Pantheon |
117333 |
63.08 |
528 |
264 |
1316.41 |
0 |
| SiteGround |
117961 |
63.42 |
939 |
165 |
180.09 |
0 |
| WebSynthesis |
116327 |
62.54 |
1101 |
332 |
1285.83 |
0 |
| WPEngine |
123901 |
68.83 |
10111 |
416 |
1302.44 |
2956 |
Discussion of Load Storm Test 1 Results
There was a pretty clear division of good and bad performance in this test. Most companies didn't struggle at all. A few collapsed: BlueHost, CloudWays AWS, CloudWays DO, and DreamHost. BlueHost started spewing 500 errors almost as soon as we started. CloudWays AWS started timing out immediately. CloudWays DO started having issues around 800 users and then started timing out. DreamHost started giving 503 Service Unavailable almost right away. It looks like our script triggered a security mechanism but they refused to work with me to test any further.
SiteGround ran into a security measure we weren't able to get around in time for publishing this article. The server seemed to just throttle the connection again.
PressLabs isn't listed because we couldn't get LoadStorm to work on their system. I am not sure what was different about their backend, but I tried to work with PressLabs and LoadStorm to get it working to no avail.
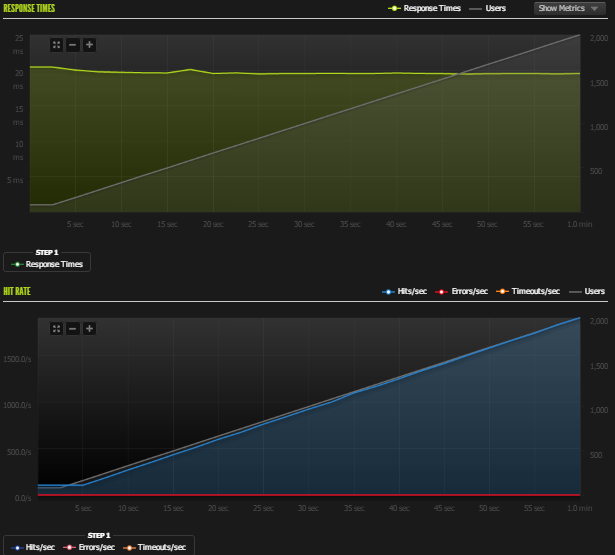
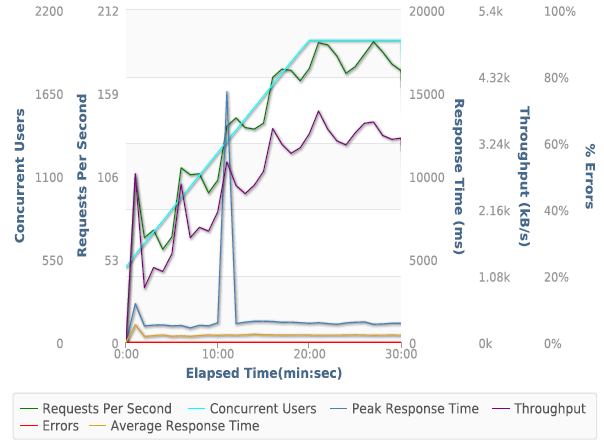
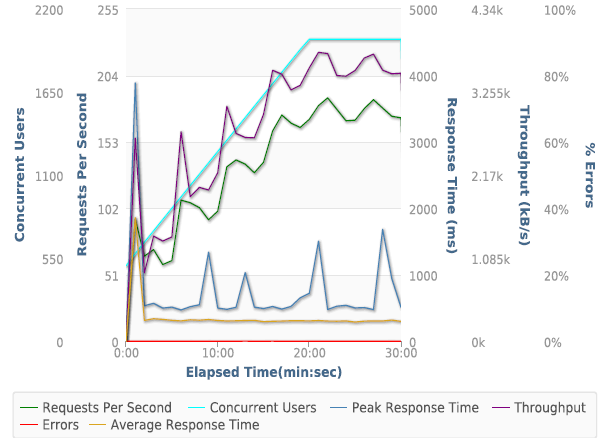
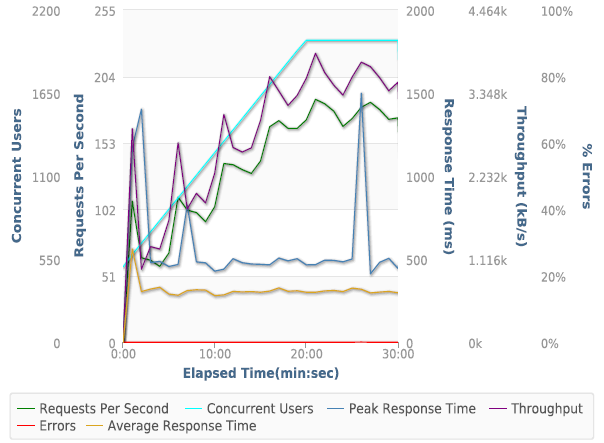
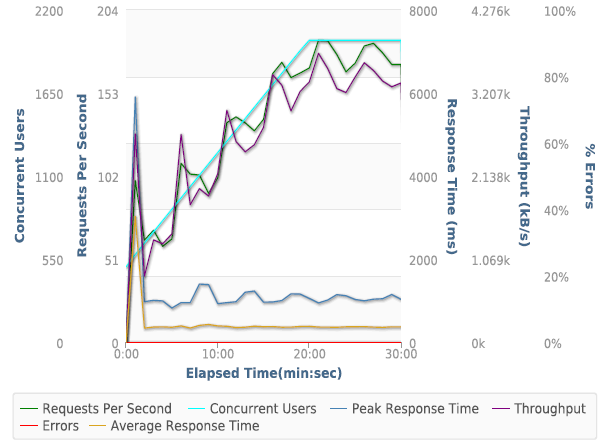
Test 2. 500 - 2000 Concurrent Users over 30 Minutes
I removed the hosts that failed and doubled the concurrent users for the second test.
|
Request Count |
Average RPS |
Peak Response Time (ms) |
Average Response Time (ms) |
Average Throughput (kB/s) |
Errors |
| A Small Orange |
248249 |
133.47 |
5905 |
436 |
2639.68 |
0 |
| FlyWheel |
236474 |
127.14 |
3811 |
983 |
2499.11 |
16841 |
| GoDaddy |
285071 |
153.26 |
8896 |
371 |
8255.24 |
92 |
| Kinsta |
248765 |
133.74 |
942 |
316 |
2714.82 |
0 |
| LightningBase |
248679 |
133.7 |
3887 |
343 |
2763.92 |
23 |
| MediaTemple |
249125 |
133.94 |
1499 |
313 |
2748.32 |
9 |
| Nexcess |
243115 |
130.71 |
15097 |
388 |
2644.72 |
80 |
| Pagely |
256163 |
137.72 |
15078 |
446 |
2621.04 |
1 |
| Pantheon |
250063 |
134.44 |
1111 |
297 |
2754.67 |
0 |
| WebSynthesis |
240305 |
129.2 |
4389 |
743 |
2598.83 |
1173 |
Discussion of Load Storm Test 2 Results
FlyWheel started to fail around 1500 users causing 502 errors and remained constant at that level of failure. I'm not sure what the bottleneck was, but it didn't overload the server, but I suspect the I/O of something bottle-necked causing a certain amount of requests to fail. WebSynthesis had a few errors as well, they were 5 separate spikes somewhat evenly spaced out. The server didn't show signs of failure, it looks like it might have been an issue with caches being refreshed and some requests failing in the meantime. WebSynthesis' error rate was still under 0.5%, so I don't have any real issue with those errors. The slower average response time can also be attributed to the spikes in performance.
Remarkably, some companies didn't even struggle. Kinsta kept sub one second response times for 30 minutes and nearly a quarter million requests. Most companies had a spike or two causing a higher peak response time, but Kinsta and Pantheon didn't (and Media Temple had a tiny one at 1.5 seconds). Simply amazing performance.
Another interesting note, GoDaddy pushed triple the amount of data through because their admin screen had a lot more resources being loaded. That's why the average throughput is so high. Despite that fact, it didn't seem to impact their performance at all, which is astounding.
Full Interactive Test Results
A Small Orange
FlyWheel
GoDaddy
Kinsta
LightningBase
MediaTemple
Nexcess
Pagely
Pantheon
SiteGround
WebSynthesis
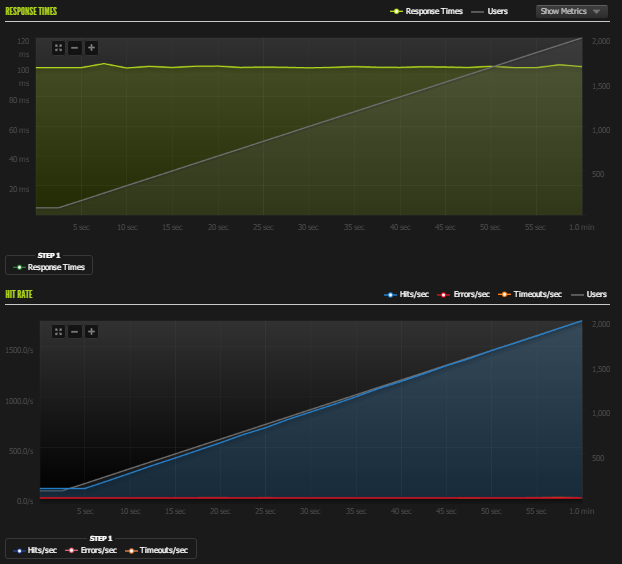
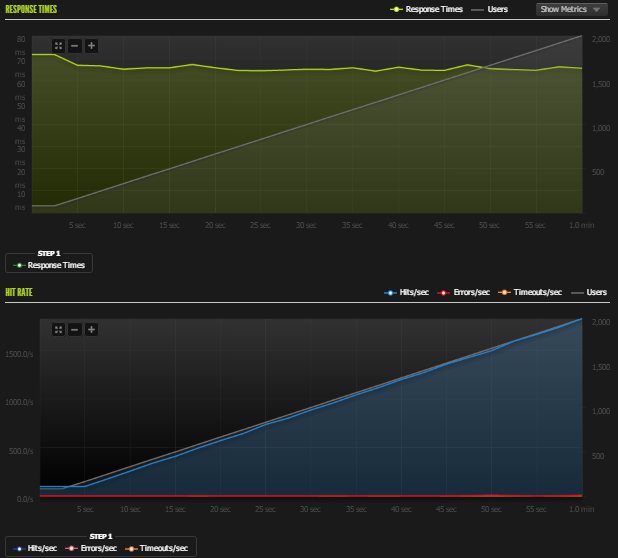
Test 1. 1-1000 Concurrent Users over 60 seconds
Blitz Test 1. Quick Results Table
|
Success |
Errors |
Timeouts |
Avg Hits/Second |
Avg Response (ms) |
| A Small Orange |
27595 |
14 |
0 |
460 |
67 ms |
| BlueHost |
23794 |
1134 |
189 |
397 |
160 ms |
| CloudWays AWS |
24070 |
162 |
148 |
401 |
138 ms |
| CloudWays DO |
27132 |
118 |
127 |
452 |
49 ms |
| DreamHost |
13073 |
45 |
7885 |
218 |
21 ms |
| FlyWheel |
28669 |
20 |
10 |
478 |
27 ms |
| GoDaddy |
26623 |
8 |
5 |
444 |
104 ms |
| Kinsta |
27544 |
0 |
0 |
459 |
69 ms |
| LightningBase |
27893 |
0 |
1 |
465 |
56 ms |
| MediaTemple |
26691 |
8 |
9 |
445 |
102 ms |
| Nexcess |
18890 |
2288 |
641 |
337 |
517 ms |
| Pagely |
25358 |
9 |
0 |
423 |
156 ms |
| Pantheon |
27676 |
21 |
0 |
461 |
64 ms |
| PressLabs |
25903 |
143 |
0 |
432 |
89 ms |
| SiteGround |
24939 |
0 |
0 |
416 |
152 ms |
| WebSynthesis |
28913 |
0 |
0 |
482 |
19 ms |
| WPEngine |
23074 |
121 |
4 |
385 |
247 ms |
Discussion of Blitz Test 1 Results
I learned from the last round of testing that any hosting that isn't optimized at all for WordPress (default install) will get destroyed by these tests. So I didn't include any of them this time. There wasn't any as catastrophic failures this time.
Who performed without any major issues?
A Small Orange, FlyWheel, GoDaddy, Kinsta, LightningBase, MediaTemple, Pagely, Pantheon, SiteGround, WebSynthesis all performed near perfect. There's nothing more to say for these companies other than they did excellent. All of their error/time rates were below 0.5%.
Who had some minor issues?
CloudWays AWS, CloudWays DO, PressLabs and WPEngine. All four of these providers had over 100 errors/timeouts and had an error/timeout rates between 0.5%-2%. Not a huge deal, but definitely not perfect.
Who had some major issues?
BlueHost, DreamHost, and Nexcess. BlueHost started show stress around 40 seconds in and started to buckle around 47 seconds. DreamHost had a couple spikes in response time and errors. However, it looks like the load testing tool may have hit some type of security limit because requests started timing out but it gave very fast responses and maintained roughly 250 hits/second constantly. It doesn't look like the server was failing. I couldn't get them to disable the security to really test it, so it's hard to say much more. Nexcess started to show stress around 20 seconds and buckle around 30 seconds.
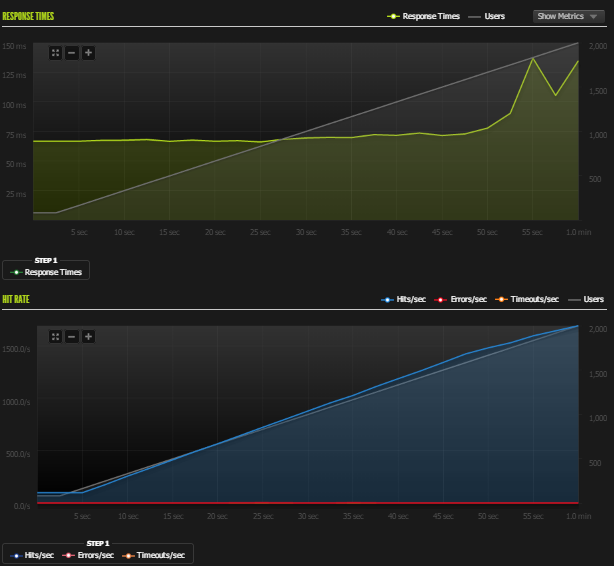
Test 2. 1-2000 Concurrent Users over 60 seconds
Blitz Test 2. Quick Results Table
|
Success |
Errors |
Timeouts |
Avg Hits/Second |
Avg Response (ms) |
| A Small Orange |
54152 |
26 |
1 |
903 |
77 ms |
| BlueHost |
29394 |
14368 |
3408 |
490 |
234 ms |
| CloudWays AWS |
25498 |
4780 |
8865 |
425 |
338 ms |
| CloudWays DO |
53034 |
1477 |
49 |
884 |
58 ms |
| DreamHost |
10237 |
5201 |
20396 |
171 |
201 ms |
| FlyWheel |
56940 |
121 |
68 |
949 |
29 ms |
| GoDaddy |
53262 |
29 |
64 |
888 |
105 ms |
| Kinsta |
55011 |
32 |
0 |
917 |
69 ms |
| LightningBase |
55648 |
0 |
0 |
927 |
58 ms |
| MediaTemple |
53363 |
16 |
28 |
889 |
100 ms |
| Nexcess |
25556 |
15509 |
4666 |
426 |
279 ms |
| Pagely |
51235 |
41 |
2 |
854 |
147 ms |
| Pantheon |
55187 |
91 |
0 |
920 |
65 ms |
| PressLabs |
35547 |
4105 |
1569 |
592 |
326 ms |
| SiteGround |
42645 |
490 |
220 |
711 |
276 ms |
| WebSynthesis |
57776 |
1 |
0 |
963 |
20 ms |
| WPEngine |
39890 |
304 |
333 |
665 |
364 ms |
Discussion of Blitz Test 2 Results
Who performed without any major issues?
A Small Orange, FlyWheel, GoDaddy, Kinsta, LightningBase, MediaTemple, Pagely, Pantheon, WebSynthesis all performed near perfect. All of their error/time rates were around 0.5% or lower.
Who had some minor issues?
SiteGround and WPEngine. All four of these providers had over 100 errors/timeouts and had an error/timeout rates between 0.5%-2%. SiteGround started to show some stress around 30 seconds and didn't started to have real issues after 50 seconds (errors). WPEngine started to show stress around 20 seconds and performed slightly erratically until the end of the test.
Who had some major issues?
BlueHost, CloudWays AWS, CloudWays DO, DreamHost, Nexcess, and PressLabs. The four that had major issues from last around completely failed with error/timeout rates exceeding 50%. DreamHost who looked like it was fine behind the security measures buckled around 35 seconds into this test and started returning errors, increased response times and the hits/second dropped. CloudWays DO definitely started to stress and show signs of buckling around 50 seconds. But its error rate was still under 3%. I don't think it would have lasted much longer had the tests gone further, but it was the least worst failure. PressLabs was a surprise, it started to show stress around 25 seconds and started to buckle around 35 seconds into the test.
Full Blitz Results (PDFs)
A Small Orange, BlueHost, CloudWays AWS, CloudWays DO, DreamHost, FlyWheel, GoDaddy, Kinsta, LightningBase, MediaTemple, Nexcess, Pagely, Pantheon, PressLabs, SiteGround, WebSynthesis, WPEngine.
Uptime Monitoring
Both uptime monitoring solutions were third party providers that offer free services. All the companies were monitored over an entire month (July 2014).
Uptime Robot
|
Uptime (%) |
| A Small Orange |
100 |
| BlueHost |
99.71 |
| CloudWays AWS |
100 |
| CloudWays DO |
99.93 |
| DreamHost |
99.92 |
| FlyWheel |
99.97 |
| GoDaddy |
99.9 |
| Kinsta |
100 |
| LightningBase |
100 |
| MediaTemple |
99.81 |
| Nexcess |
100 |
| Pagely |
99.95 |
| Pantheon |
100 |
| PressLabs |
100 |
| SiteGround |
100 |
| WebSynthesis |
100 |
| WPEngine |
100 |
According to UptimeRobot not a single company was below 99.5% uptime. In fact, with the exception of Media Temple and BlueHost, they were all above 99.9% uptime. For reference 99.5% uptime is 3.5 hours of downtime per month. 99.9% is <45 minutes of downtime per month. Overall, nothing to really complain about according to Uptime Robot.
StatusCake
|
Availability (%) |
Response Time (ms) |
| A Small Orange |
1 |
0.23s |
| BlueHost |
0.9969 |
2.45s |
| CloudWays AWS |
0.998 |
0.75s |
| CloudWays DO |
1 |
2.41s |
| DreamHost |
1 |
2.22s |
| FlyWheel |
0.999 |
1.99s |
| GoDaddy |
1 |
2.41s |
| Kinsta |
1 |
2.13s |
| LightningBase |
1 |
1.6s |
| MediaTemple |
1 |
1.18s |
| Nexcess |
1 |
2.33s |
| Pagely |
1 |
2.49s |
| Pantheon |
1 |
2.04s |
| PressLabs |
1 |
1.49s |
| SiteGround |
0.9993 |
1.64s |
| WebSynthesis |
1 |
1.77s |
| WPEngine |
1 |
2.76s |
According to StatusCake, the results look even better. I used multiple services to monitor because there can be networking issues unrelated to a web host's performance. StatusCake only detected issues with four companies, which is fewer than UptimeRobot detected. It's hard to say which is better or right. But they both say that uptime didn't really seem to be an issue for any company.
StatusCake also provides an average response time metric. According to them, it's using a browser instance and fully rendering the page. They also have many different geographical locations that they are testing from. I don't have any further insight into these tools beyond what I can read on their documentation. If they are to be believed, A Small Orange has astonishingly fast performance. WPEngine is the slowest average load time at 2.76 seconds which isn't that bad.
WebPageTest.org
Every test was run with the settings: Chrome Browser, 9 Runs, native connection (no traffic shaping), first view only. This was tested against the default install from every company.
| Company |
Dulles,VA |
Miami, FL |
Denver, CO |
Los Angeles, CA |
Average |
| A Small Orange |
1.443 |
0.801 |
0.836 |
0.64 |
0.93 |
| BlueHost |
1.925 |
1.321 |
1.012 |
0.785 |
1.26075 |
| CloudWays AWS |
0.655 |
0.867 |
0.967 |
0.746 |
0.80875 |
| CloudWays DO |
0.493 |
0.851 |
1.036 |
0.811 |
0.79775 |
| DreamHost |
1.177 |
0.863 |
1.067 |
1.147 |
1.0635 |
| FlyWheel |
0.497 |
0.864 |
1.066 |
1.109 |
0.884 |
| GoDaddy |
1.607 |
1.355 |
0.934 |
0.855 |
1.18775 |
| Kinsta |
0.759 |
0.752 |
0.947 |
0.592 |
0.7625 |
| LightningBase |
0.584 |
0.787 |
0.936 |
0.675 |
0.7455 |
| MediaTemple |
1.516 |
0.983 |
0.955 |
0.555 |
1.00225 |
| Nexcess |
1.433 |
1.139 |
1.196 |
0.859 |
1.15675 |
| Pagely |
6.831 |
0.86 |
0.913 |
0.709 |
2.32825 |
| Pantheon |
0.654 |
0.828 |
0.923 |
0.954 |
0.83975 |
| PressLabs |
0.715 |
1.018 |
1.213 |
0.723 |
0.91725 |
| SiteGround |
1.392 |
1.239 |
1.01 |
1.212 |
1.21325 |
| WebSynthesis |
0.407 |
0.835 |
0.982 |
1.024 |
0.812 |
| WPEngine |
0.821 |
1.086 |
0.839 |
0.685 |
0.85775 |
There isn't much surprising here. The pack is really tight with less than a half second difference average between the top and bottom hosts. If we exclude Pagely. I'm not sure what happened with their Dulles, VA test, but it seems like there was something terribly wrong with the network when I tested it. The average response times from every other location were incredibly fast (<1 second). I'm going to chalk it up to a bad node somewhere causing that particular test to perform so poorly, almost certainly not a reflection of their hosting.
What is interesting, compared to last time is that these companies are getting faster. There was only one company with a sub 1 second average last time. Now there are 10 companies (11 if you count Pagely). Three of them were above one second last time, so they are showing signs of improvement (Pagely, WebSynthesis, WPEngine). It also means there is a lot of new competition that is not behind the entrenched players in terms of performance.
Conclusion
Every service seems to have their issues somewhere if you look hard enough. I try to avoid injecting my personal opinion and bias as much as possible. So I won't be ranking or outright saying any single company is the best. Some providers did exceptionally well and tended to clump together performance-wise, I will call those the top tier providers. This top tier designation is related to performance only and is claimed only from the results of these tests. What each of these companies is offering is different and may best suit different audiences depending on a variety of factors beyond performance, such as features, price, support, and scale (I tested mostly entry level plans). But I will provide a short summary and discussion of the results for each provider.
Top Tier WordPress Hosting Performance
A Small Orange, GoDaddy, Kinsta, LightningBase, MediaTemple, Pagely, Pantheon, WebSynthesis
Each of these companies were below the 0.5% error rate on all load testing all the way up to 2000 concurrent users on both LoadStorm and Blitz.
Honorable Mention
FlyWheel gets an honorable mention. They performed really well on many of the tests. FlyWheel fell apart on the final LoadStorm test to 2000 logged in users. I'll explain more in their individual section as to why this is deserving of an honorable mention.
Amazon Web Services (AWS) vs Digital Ocean
One of the most interesting comparisons to me was CloudWays. They provide you with the ability to choose which VPS provider and type you want. It then sets up their WordPress configuration (in an identical manner from my understanding) on the VPS. I was granted access to one Amazon and one Digital Ocean VPS from them. The Amazon was a small (1.7GB ram) and the Digital Ocean was a 2GB ram instance.
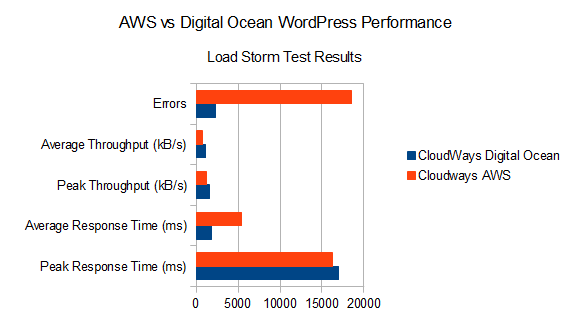
The head-to-head results from LoadStorm (1000 user test) results above pretty clearly show Digital ocean performing better in every category (with the exception of Peak Response Time which is a timeout). Digital Ocean sent more data, had less errors and it did it faster.
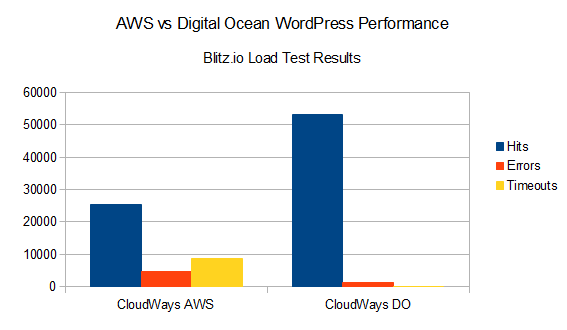
The Blitz.io results show pretty clearly that Digital Ocean is outperforming AWS by a wide margin as well. It delivered twice as many hits with less errors and time outs.
It's pretty easy to conclude based on the tests that on the low-end VPSs, that Digital Ocean's hardware outperforms Amazon's hardware.
Individual Host Analysis
A Small Orange
They've improved their LEMP stack since the last time I tested. They never buckled in any test and were definitely one of the best. Their staff was incredibly friendly (special thank you to Ryan MacDonald) and they've stepped up their performance game. The one thing that isn't quite there yet is the documentation/user experience, there are a lot of improvements they could make to make their LEMP stack more accessible to the less tech savvy. All in all, the experience was in-line with what I would expect from a company that has one of the highest support ratings on our site.
BlueHost
Their WordPress offering is brand new. It struggled in every load test. Their price is on the middle-high end but the performance was not. Ultimately, they fell short of where I would expect based on pricing and the competition.
CloudWays
CloudWays was certainly an interesting company to test given that they had two entries, one running on Amazon Web Services (EC2) and another on Digital Ocean. The Digital Ocean VPS outperformed AWS in every category which was interesting. The AWS instance's performance was near the bottom of the pack performance wise, but the Digital Ocean one was in the middle. It is a very interesting platform they have built which allows deployment and management across providers. However, their performance isn't quite there yet. Other companies are running on the same hardware and getting better results. CloudWays doesn't do just WordPress, so it's easy to understand why their performance might not quite be as good as some of their competitors who solely focus on WordPress.
DreamHost
DreamPress was another disappointment. The security features hid some of the performance weakness on the first Blitz test, but it completely failed on the second. The way DreamPress is designed it says it has automatic RAM scaling and each site is run by two VPS instances. It's very unclear what resources you are really getting for your money. They are charging $50/month for a 1GB ram VPS, so I get the feeling a lot of resources are shared and it may not be a true VPS.
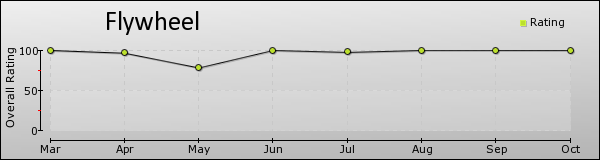
FlyWheel
FlyWheel were excellent on every test except the final 2000 logged in user test from LoadStorm. They are built on top of Digital Ocean and I was using the smallest VPS. Yet their performance beat VPSs on Digital Ocean that had four times the resources (CloudWays DO). For cached content on the Blitz test, they had the second highest hits/second and response time. I suspect the testing hit a hardware maximum. FlyWheel had the best performance with the lowest dedicated resources (512MB ram). The companies that outperformed it had more resources dedicated to them or shared resources which presumably would allow access to far greater than 512MB ram. It was an impressive performance given what they are selling and combined with them having the best reviews of any company Review Signal has ever tracked. FlyWheel certainly merit serious consideration.
GoDaddy
GoDaddy continues to surprise me. They flew through all the tests, including a weird issue where they transferred 3X the data during the LoadStorm test and didn't show any signs of stress. The only comparison I have to last time is the Blitz testing, where they eked out another 3000+ hits and raised their hits/second from 829 to 888. GoDaddy also raised their max hit rate marginally from 1750 to 1763. What's more impressive is they reduced their errors+timeouts from 686 to 93. More hits with less errors. From a performance perspective, they did excellent in absolute terms and relative to their last benchmarks.
Kinsta
A new-comer that jumped straight to the top of the performance tiers. Kinsta's performance was amazing in the Load Storm 2000 logged in user test. They had the lowest peak response time and zero errors over a 30 minute test. They didn't struggle with any tests whatsoever and showed zero downtime. Kinsta's performance was top tier.
LightningBase
Another new-comer that jumped straight to the top. One of the cheapest too starting at under $10. LightningBase aced the Blitz testing and did excellent on Load Storm. There was no downtime monitored. LightningBase belongs in the top tier and is delivering amazing value.
Media Temple
Media Temple is interesting because I was told it was running the same technology as GoDaddy (GoDaddy bought Media Temple a year ago). They have a few more premium features like Git and a staging environment. Media Temple's performance was superb. It actually beat GoDaddy's performance in just about every measure by a marginal amount on both Load Storm and Blitz's load testing. If GoDaddy has top tier performance, Media Temple certainly does as well.
Nexcess
Nexcess's performance was excellent in the Load Storm testing. However, it completely collapsed during the Blitz load testing. I'm really not sure what to make of those results. Perhaps the underlying shared hardware is very good but the static caching setup isn't quite up to snuff? It's probably not worth speculating, suffice to say, Nexcess ended up looking like a middle of the pack web host instead of a top tier one because of the Blitz test.
Pagely
Pagely put on another spectacular performance. They handled the Load Storm test with 1 error. Blitz results stayed similar to the last run. They handled more hits, but had a few more errors+timeouts (1 last time, 43 this time). Really not much to add here other than they continue to be in the top tier.
Pantheon
Pantheon specialized in Drupal hosting, so I was wondering how well it would translate to WordPress. The short answer is, it converted over really well. They had a flawless run on the LoadStorm test - 0 errors and not even any spikes in response time over 30 minutes. They are one of the most expensive (only second to PressLabs) options on this list, but definitely make a case for it. Perfect uptime and near flawless load testing sent them easily into the top tier.
PressLabs
It's hard to write much about PressLabs because we couldn't get LoadStorm to work properly to test out their hosting. However, their Blitz results were lackluster. For the most expensive plan we tested, it was a bit of a disappointment to see it not do stunningly well.
SiteGround
SiteGround sadly didn't do as well as they did last time. Their Blitz load testing score went down slightly. We couldn't bypass their security measures to properly test Load Storm. They obviously have some good protection measures to prevent malicious users from trying to access too many things, but it also meant I couldn't get a deeper look this time around. That was a change from the last round of testing. Slightly disappointing to see the performance dip, but I hope it was due to the extra security measures they put in place that made testing them difficult.
WebSynthesis
WebSynthesis was teetering on the Load Storm test of having too many errors (0.5%), but they were under it and handled the test quite well. They also had no weird security issues this time around, and WebSynthesis led the pack on Blitz testing. They went from 871 hits/second to 963 hits/second; leading every provider on the Blitz tests with a whopping 1 error to boot. Sprinkle in some perfect up time numbers and it's clear WebSynthesis is still a top tier provider and is continuing to get better.
WPEngine
I feel like I could copy+paste my last conclusion about WPEngine. "WPEngine had some issues. Uptime was not one of them, they were perfect or upwards of 99.9% in that department. However, their performance shortcomings became apparent during the load tests." They didn't even make it to the final round of Load Storm testing. They were also middle of the pack on the Blitz testing. Compared to the last round of Blitz testing, the results were nearly identical, with slightly fewer errors+timeouts. I'm not sure if I should be disappointed to not see improvement or relieved to see them maintain the exact same performance and consistency. Their vaunted rankings on Review Signal's reviews have slipped relative to a few of the other providers on here (FlyWheel and WebSynthesis). While they were once leading the pack in technology, the rest of the pack is starting to catch up.
Thank Yous
A special thanks goes out to the sponsor of this post and an individual employee, Scott Price of Load Storm, who worked countless hours with me in order to perform these tests.
I want to thank all the companies that participated in these tests. I tested the support staff a fair bit at some of them and I thank them for their time and patience.
A special thanks goes to Chris Piepho from LightningBase also provided a lot of feedback based on the original article and helped improve the methodology for this round.
A huge thanks goes out to Mark Gavalda at Kinsta for his feedback and performance testing discussions. He's tested some further out stuff than I have like HHVM and php-ng performance. Also to their designer, Peter Sziraki, who designed the the header image for this article.


 WordPress & WooCommerce Hosting Performance Benchmarks 2021
 WooCommerce Hosting Performance Benchmarks 2020
 WordPress Hosting Performance Benchmarks (2020)
 The Case for Regulatory Capture at ICANN
 WordPress Hosting – Does Price Give Better Performance?
 Hostinger Review – 0 Stars for Lack of Ethics
 The Sinking of Site5 – Tracking EIG Brands Post Acquisition
 Dirty, Slimy, Shady Secrets of the Web Hosting Review (Under)World – Episode 1
 Free Web Hosting Offers for Startups