
Sponsored by LoadStorm. The easy and cost effective load testing tool for web and mobile applications.
The full company list, product list, methodology, and notes can be found here
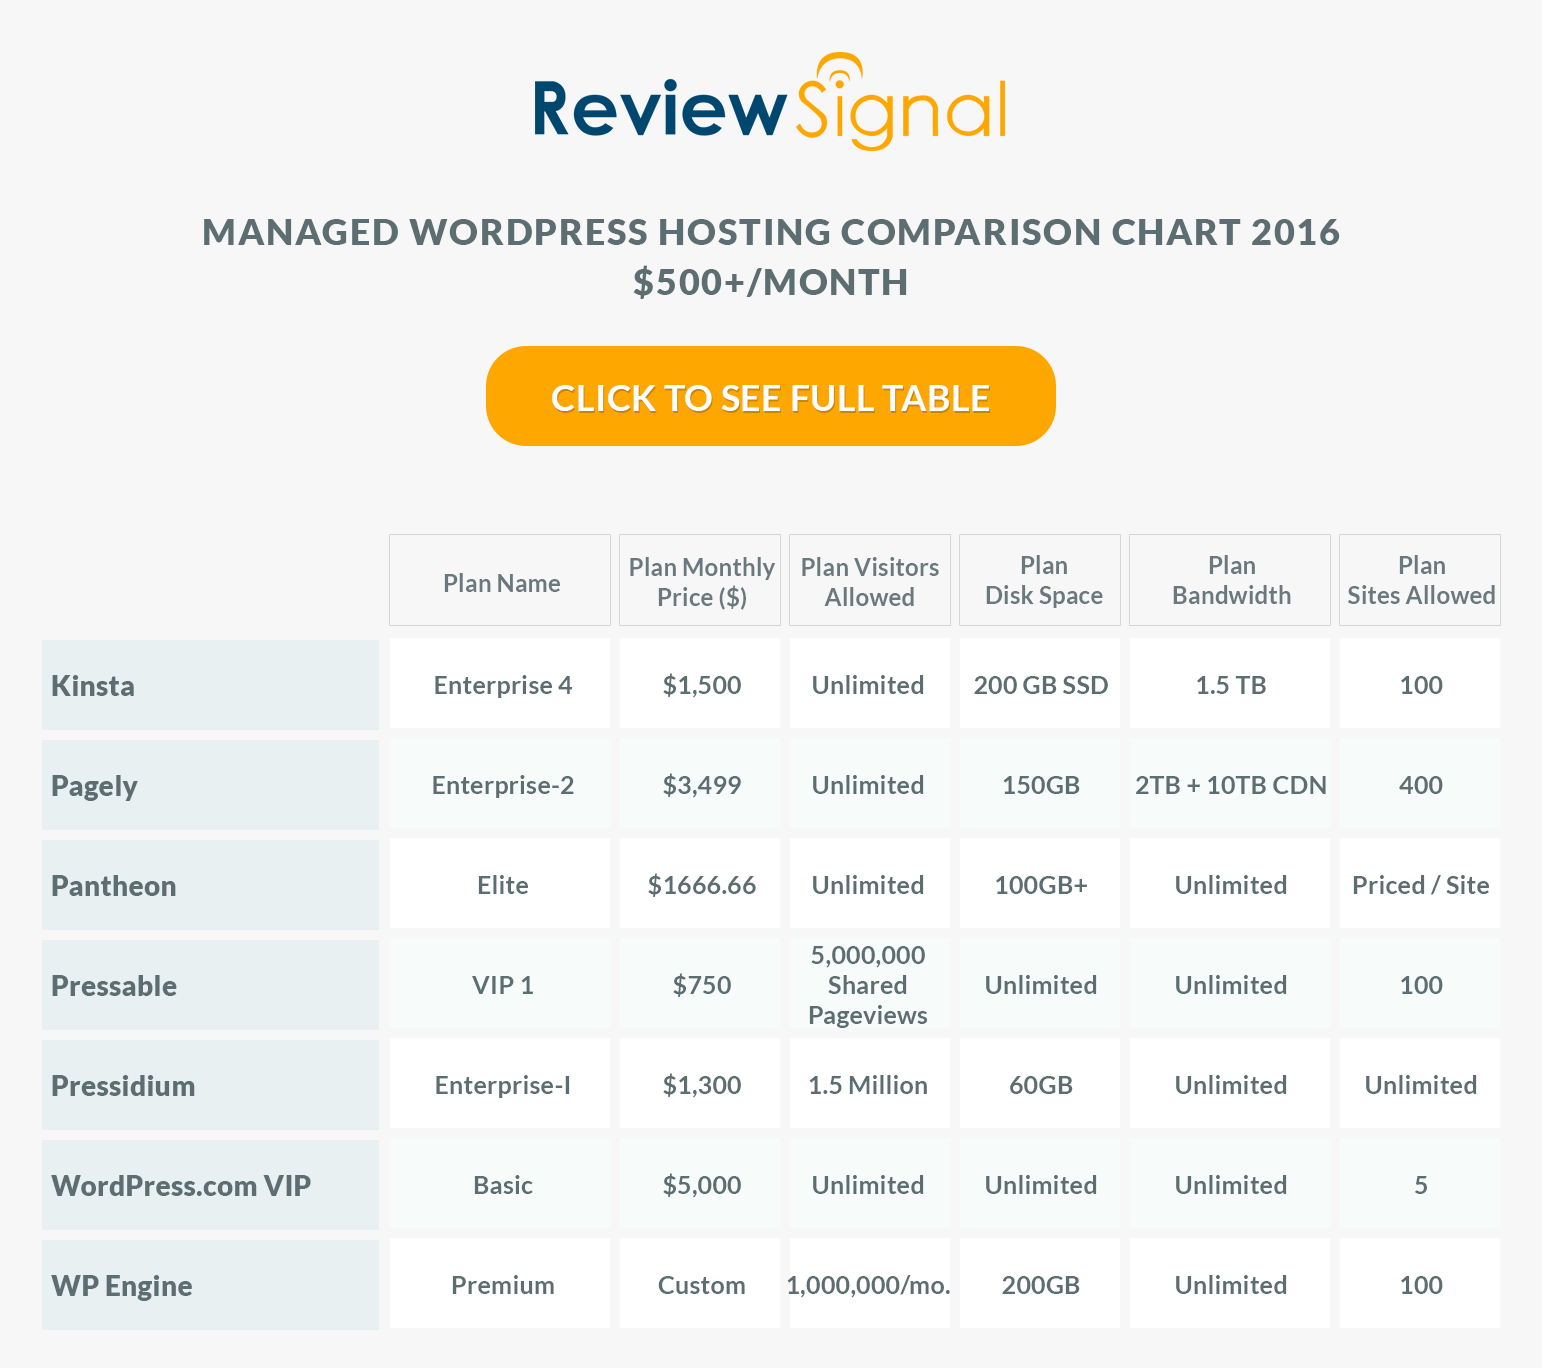
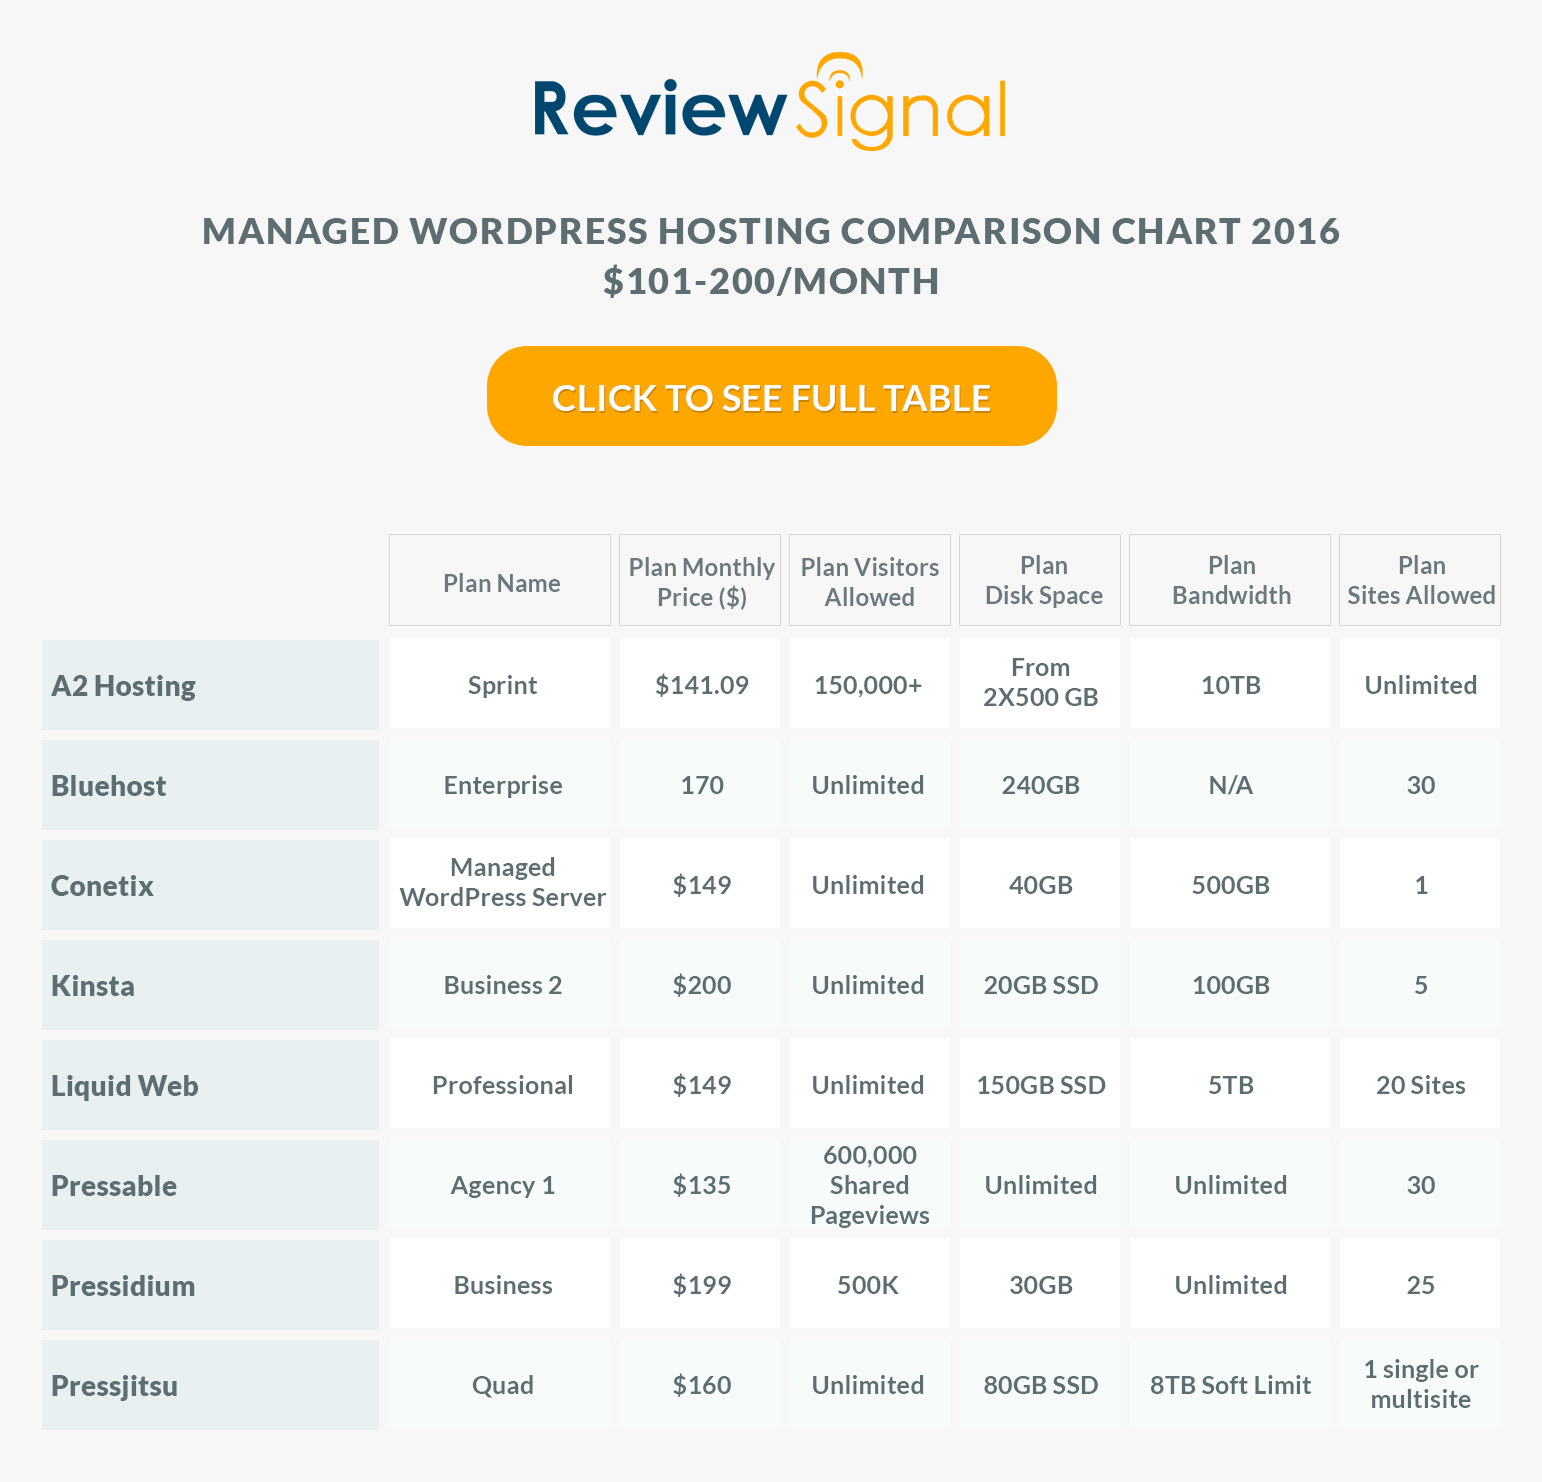
This post focuses only on the results of the testing in the $500+/month price bracket for WordPress Hosting.
Enterprise WordPress Hosting Introduction
This is super exciting for me to test the ultra high end of the market. The past three years I've focused entirely on entry level plans, but the market has changed tremendously since I started and there is a very real demand for Enterprise WordPress hosting. I think this is the first time that a lot of these companies have been benchmarked, especially at this scale and level. So I hope this adds a new and incredibly valuable door for the minority of sites out there that really need to handle massive amounts of users.
The Enterprise testing this year had some fundamental differences from all the other testing that need to be discussed upfront. These are huge and expensive systems that are normally customized on a per-customer basis by these companies. They all offer a much more hands on experience than hosting plans at the other end of the spectrum and charge accordingly. For that reason, I felt it was only responsible to change how they were tested slightly.
The first change is there is no default setup, which is what I test in every other price tier. The companies were given explicit permission to customize their platform and knew what tests were coming their way. Some even ran their own load tests to make sure they were going to perform as advertised and made changes. This is what I would expect from plans charging hundreds, if not thousands of dollars per month for large sites. So I wanted to let them perform their normal services for this tier.
Uptime monitoring was reduced for many companies in this tier. Since these plans are very expensive and consume huge amounts of resources, I didn't want to keep my test sites eating up lots of money and resources. If they had other plans entered into the system, I created a composite based on what all their other plans averaged for uptime.
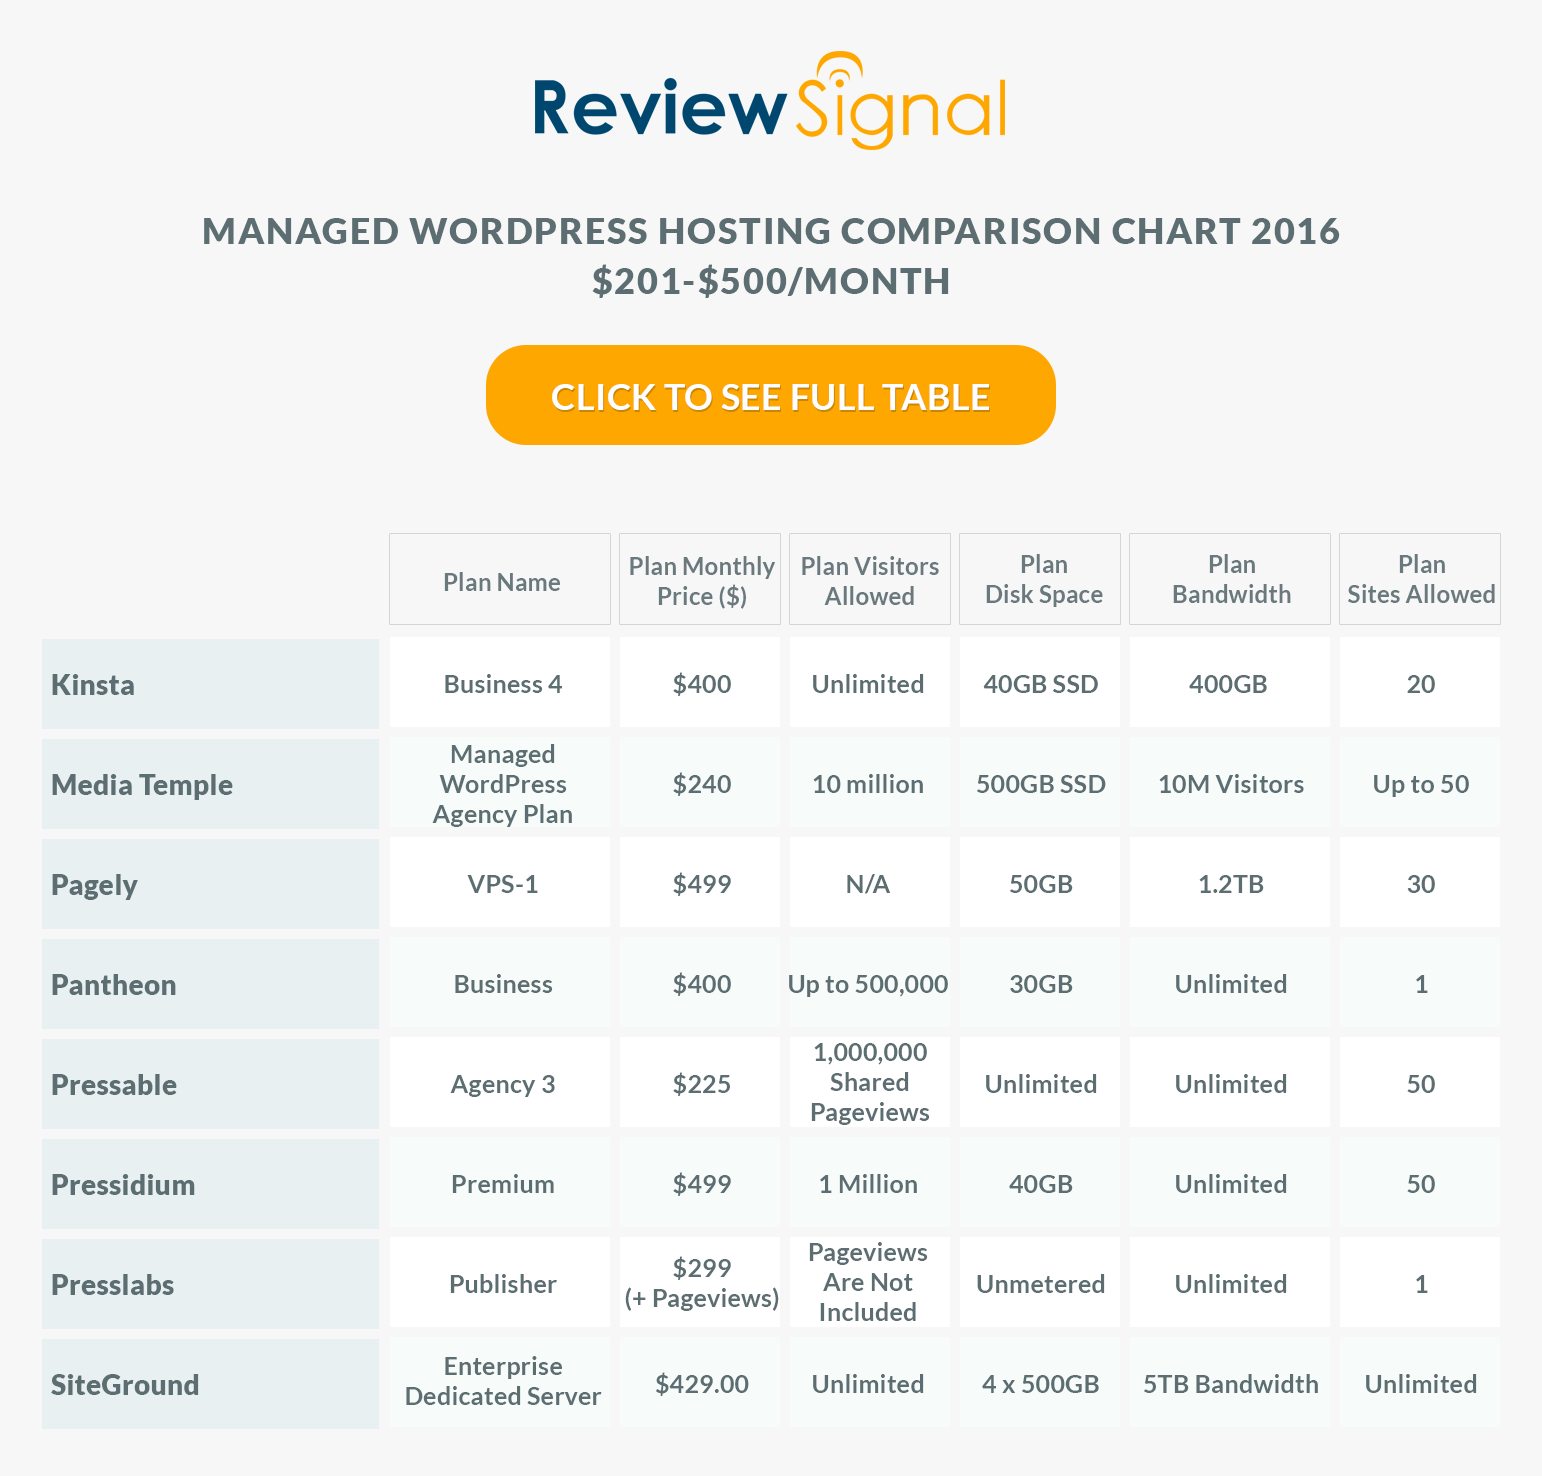
$500+/Month Enterprise WordPress Hosting Products
$500+/Month Enterprise WordPress Hosting Performance Benchmarks Results
Test 500-10,000 Concurrent Users over 30 Minutes, 10 Minutes at Peak
| Company |
Total Requests |
Total Errors |
Peak RPS |
Average RPS |
Peak Response Time(ms) |
Average Response Time(ms) |
Total Data Transferred (GB) |
Peak Throughput (MB/s) |
Average Throughput (MB/s) |
| Kinsta |
1314178 |
274 |
1041.28 |
730.1 |
15014 |
340 |
75.7 |
60.75 |
42.06 |
| Pagely |
1388436 |
18 |
1108.3 |
775.24 |
9086 |
259 |
76.97 |
61.75 |
42.76 |
| Pantheon |
1295178 |
9964 |
1014.58 |
719.54 |
15101 |
786 |
30.86 |
24.18 |
17.15 |
| Pressable |
1538237 |
7255 |
1162.63 |
854.58 |
15099 |
733 |
29.18 |
21.95 |
16.21 |
| Pressidium |
1349118 |
3792 |
1076.52 |
749.51 |
11798 |
324 |
73.63 |
60.18 |
40.91 |
| WordPress.com VIP |
4660190 |
8151 |
3726.38 |
2588.99 |
8186 |
101 |
197.82 |
158.29 |
109.9 |
| WPEngine |
1515128 |
247976 |
1211.18 |
841.74 |
19797 |
281 |
52.1 |
40.34 |
28.94 |
Discussion of Load Storm Test Results
First off, this is the biggest load tests I've run to date. I had limited resources and wanted to test a high enough number to really put some stress on these systems. 10,000 concurrent users seemed like a reasonable choice based on limited resources and high enough to be meaningful for sites that are truly getting a lot of traffic.
Kinsta and Pagely [Reviews] had basically flawless performances. Flat average response times, minimal errors and no spikes.
WordPress.com VIP had a nearly perfect looking run except for some minor issue with wp-login that might be security related but persisted the entire test at a tiny level (0.17%). The average response time was impressively flat and the fastest of any company by a good bit at 101ms. They also maintained the lowest peak response time. WP VIP also loaded a lot of extra scripts that nobody else did, which increased their transfer data to be multiple times higher than anyone else.
Pantheon [Reviews], Pressable and Pressidium each had minor spikes but put on nearly perfect performances otherwise.
WPEngine [Reviews] ran into what looks to be a similar issue to the other tests, wp-login/admin security issues. Which caused a lot of errors and makes the test look not great. However, their average response time was flat, but it's really hard to say with such a high error rate (16.37%).
Test 1-5000 Concurrent Users over 60 seconds
Blitz Test Quick Results Table
| Company |
Hits |
Errors |
Timeouts |
Average Hits/Second |
Average Response Time |
Fastest Response |
Slowest Response |
| Kinsta |
135485 |
7 |
0 |
2258 |
85 |
83 |
87 |
| Pagely |
146339 |
0 |
0 |
2439 |
4 |
3 |
14 |
| Pantheon |
138607 |
4 |
27 |
2310 |
62 |
60 |
80 |
| Pressable |
129866 |
13 |
2 |
2164 |
132 |
131 |
139 |
| Pressidium |
143452 |
0 |
2 |
2391 |
26 |
24 |
35 |
| WordPress.com VIP |
146200 |
0 |
73 |
2437 |
6 |
3 |
21 |
| WPEngine |
108168 |
12939 |
1061 |
1803 |
158 |
6 |
346 |
Discussion of Blitz Test 1 Results
This test is just testing whether the company is caching the front page and how well whatever caching system they have setup is performing (generally this hits something like Varnish or Nginx).
Who performed without any major issues?
Kinsta, Pagely [Reviews], Pantheon, Pressable, Pressidium and WordPress.com VIP all handled 5000 concurrent hits to the frontpage without any issue. The largest spread in response times among all of them was a minuscule 20ms. Pagely even managed an impressive perfect no errors or timeouts.
Who had some major issues?
WPEngine [Reviews] struggled with this test. Around 20 seconds into the test, there was a substantial increase in response time which continued to slowly increase for the rest of the test. The errors and timeouts started to kick in 5 seconds later at the 25 second mark and also gradually increased until the test ended.
3. Uptime Monitoring
Both uptime monitoring solutions were third party providers that offer free services. UptimeRobot was paid for and monitoring on a 1 minute interval. All the companies were monitored over approximately two months (May-June 2016).
For Enterprise testing, many of the plans were only setup for a short period of time because of the enormous cost involved with setting these up. Only WordPress.com VIP and WPEngine were monitored directly. The rest are composite scores based on the other plans companies entered in and the company's average uptime as denoted with an asterisk (*).
Uptime Robot & StatusCake
| Company |
StatusCake |
UptimeRobot |
| Kinsta* |
99.98 |
100 |
| Pagely* |
99.98 |
99.98 |
| Pantheon* |
99.99 |
99.99 |
| Pressable* |
99.92 |
99.90 |
| Pressidium* |
99.97 |
99.99 |
| WordPress.com VIP |
100 |
100 |
| WPEngine |
100 |
100 |
* Composite uptime based on all the plans entered in 2016 testing from a company.
Every company in the enterprise tier seems capable of keeping their servers online, thankfully.
4. WebPageTest.org
Every test was run with the settings: Chrome Browser, 9 Runs, native connection (no traffic shaping), first view only.
| Company |
WPT Dulles |
WPT Denver |
WPT LA |
WPT London |
WPT Frankfurt |
WPT South Africa |
| Kinsta |
0.718 |
0.588 |
0.958 |
1.256 |
1.741 |
5.844 |
| Pagely |
0.752 |
0.758 |
0.953 |
1.243 |
2.029 |
9.885 |
| Pantheon |
0.809 |
0.563 |
1.02 |
1.284 |
1.826 |
4.882 |
| Pressable |
1.056 |
0.894 |
1.207 |
1.691 |
2.126 |
7.244 |
| Pressidium |
0.848 |
0.661 |
1.165 |
1.279 |
1.634 |
5.819 |
| WordPress.com VIP |
1.02 |
0.786 |
0.918 |
1.471 |
1.755 |
3.045 |
| WPEngine |
0.813 |
0.592 |
1.07 |
1.223 |
1.743 |
3.814 |
| Company |
WPT Singapore |
WPT Shanghai |
WPT Japan |
WPT Sydney |
WPT Brazil |
| Kinsta |
2.084 |
22.391 |
2.055 |
1.643 |
1.891 |
| Pagely |
2.455 |
23.148 |
2.203 |
2.117 |
2.153 |
| Pantheon |
2.336 |
22.723 |
1.95 |
1.852 |
2.032 |
| Pressable |
2.707 |
22.521 |
2.227 |
2.807 |
2.205 |
| Pressidium |
2.202 |
22.477 |
2.265 |
1.662 |
1.797 |
| WordPress.com VIP |
1.809 |
24.098 |
1.83 |
1.386 |
1.916 |
| WPEngine |
2.255 |
22.971 |
2.115 |
1.722 |
1.846 |
It's not surprising that these companies deliver content pretty quick all around the world. What is interesting is WordPress.com VIP was the fastest to Sydney, Japan, Singapore, South Africa, and LA. Kinsta was the fastest in Dulles and Shanghai. Pantheon was fastest in Denver. WPEngine was the fastest to London. Pressidium was the fastest to Brazil. I'm not sure how meaningful it is, but it's interesting to see the most expensive product having the fastest load times in locations all across the world.
| Company |
PHP Bench [Seconds] (lower=faster) |
WP Bench [Queries Per Second](higher=faster) |
| Kinsta |
11.37 |
320.82 |
| Pagely |
9.136 |
249.81 |
| Pantheon |
11.322 |
216.31 |
| Pressable |
10.834 |
491.64 |
| Pressidium |
10.958 |
367.24 |
| WordPress.com VIP |
2.244 |
500.25 |
| WPEngine |
13.178 |
533.9 |
I'm not sure what WordPress.com VIP is running, but it put up the absolute fastest scores in the PHP bench that I've seen by a wide margin. Roughly triple the speed of the next fastest which had a 6.5 second score. Every other company looked to be in the normal range between 9-13 seconds.
Another interesting part of the results here is that nobody was really going much faster than 500 queries per second in the WP Bench. I don't think a single one is running a local database which put up some blazing fast speeds in the lower tiers. If you're looking to host enterprise WordPress sites, you lose that no network latency performance, but certainly gain in reliability and scalibility.
Conclusion
White glove service and hefty price tags makes for some spectacular performance. It's nice to see that if you really have a site getting millions of visitors per day, there are a lot of really solid choices out there who can handle the mega WordPress sites that need Enterprise level hosting.
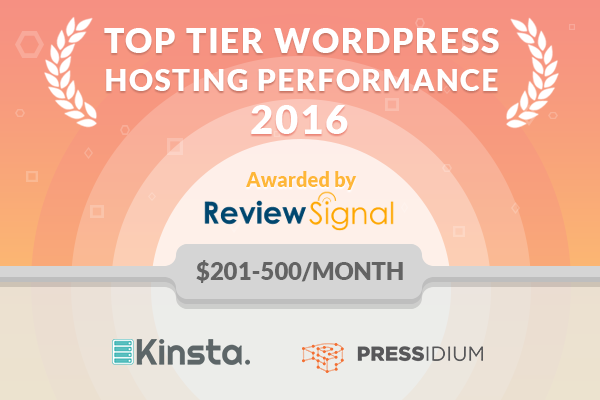
Top Tier WordPress Hosting Performance
Kinsta, Pagely [Reviews], Pantheon, Pressable, Pressidium and WordPress.com VIP all offer Top Tier Enterprise WordPress Hosting. None of them had any real struggles with keeping their servers up, the 10,000 and 5,000 user load tests. If you can afford them, they all seem worthy and capable.
Individual Host Analysis
Kinsta
Kinsta had essentially perfect LoadStorm and Blitz tests. They also had no flaws in any other tests. I'm at a loss for words to praise their performance.
Pagely [Reviews]
Pagely aced it. The fewest errors on LoadStorm and a no errors on Blitz. I can't find any faults with Pagely's Enterprise offering.
Pantheon [Reviews]
Pantheon really stepped it up for the Enterprise testing. Effortlessly went through the Blitz test. They had a some minor spikes in the LoadStorm test and their average response time started to creep upwards but nothing worth being concerned over. Overall, a top tier performance.
Pressable
Pressable performed nearly identical to Pantheon. Excellent Blitz test, some minor spikes and increase in response times in the LoadStorm test. The uptime was the lowest of everyone with UptimeRobot having an average of 99.90% which has been my border for pass/fail. I gave them top tier, but they were about as close as you can get to the edge.
Pressidium
Pressidium had a nearly perfect Blitz test with 2 timeouts and did excellent on the LoadStorm test which had 2 very minor spikes but maintained a nearly flat average response time otherwise. Easily a top tier performance.
WordPress.com VIP
WordPress.com VIP was by far the most expensive plan tested and it put on a fantastic performance. It had a near perfect Blitz test. Despite having what appeared to be a security issue on the LoadStorm test it had the fastest average response time at 101ms and moved more data than any other company by a wide margin because of the custom scripts. But that didn't seem to negatively impact their performance at all. I'm also not sure what sort of hardware they are running by they blew my WPPerformanceTester PHP bench out of the water. Despite the highest price tag, they put on an amazing show and easily earned Top Tier Enterprise WordPress Hosting status.
WPEngine [Reviews]
Unfortunately, WPEngine was the only company in this tier not to do well in this tier. They struggled in both load tests. LoadStorm looked like it may have been security related, but Blitz looked like it really had trouble with the load. I believe the plan I tested cost $600/month, but the sales team wasn't willing to give me specific pricing for their enterprise tier.


 WordPress & WooCommerce Hosting Performance Benchmarks 2021
 WooCommerce Hosting Performance Benchmarks 2020
 WordPress Hosting Performance Benchmarks (2020)
 The Case for Regulatory Capture at ICANN
 WordPress Hosting – Does Price Give Better Performance?
 Hostinger Review – 0 Stars for Lack of Ethics
 The Sinking of Site5 – Tracking EIG Brands Post Acquisition
 Dirty, Slimy, Shady Secrets of the Web Hosting Review (Under)World – Episode 1
 Free Web Hosting Offers for Startups