
Sponsored by LoadStorm. The easy and cost effective load testing tool for web and mobile applications.
The full company list, product list, methodology, and notes can be found here
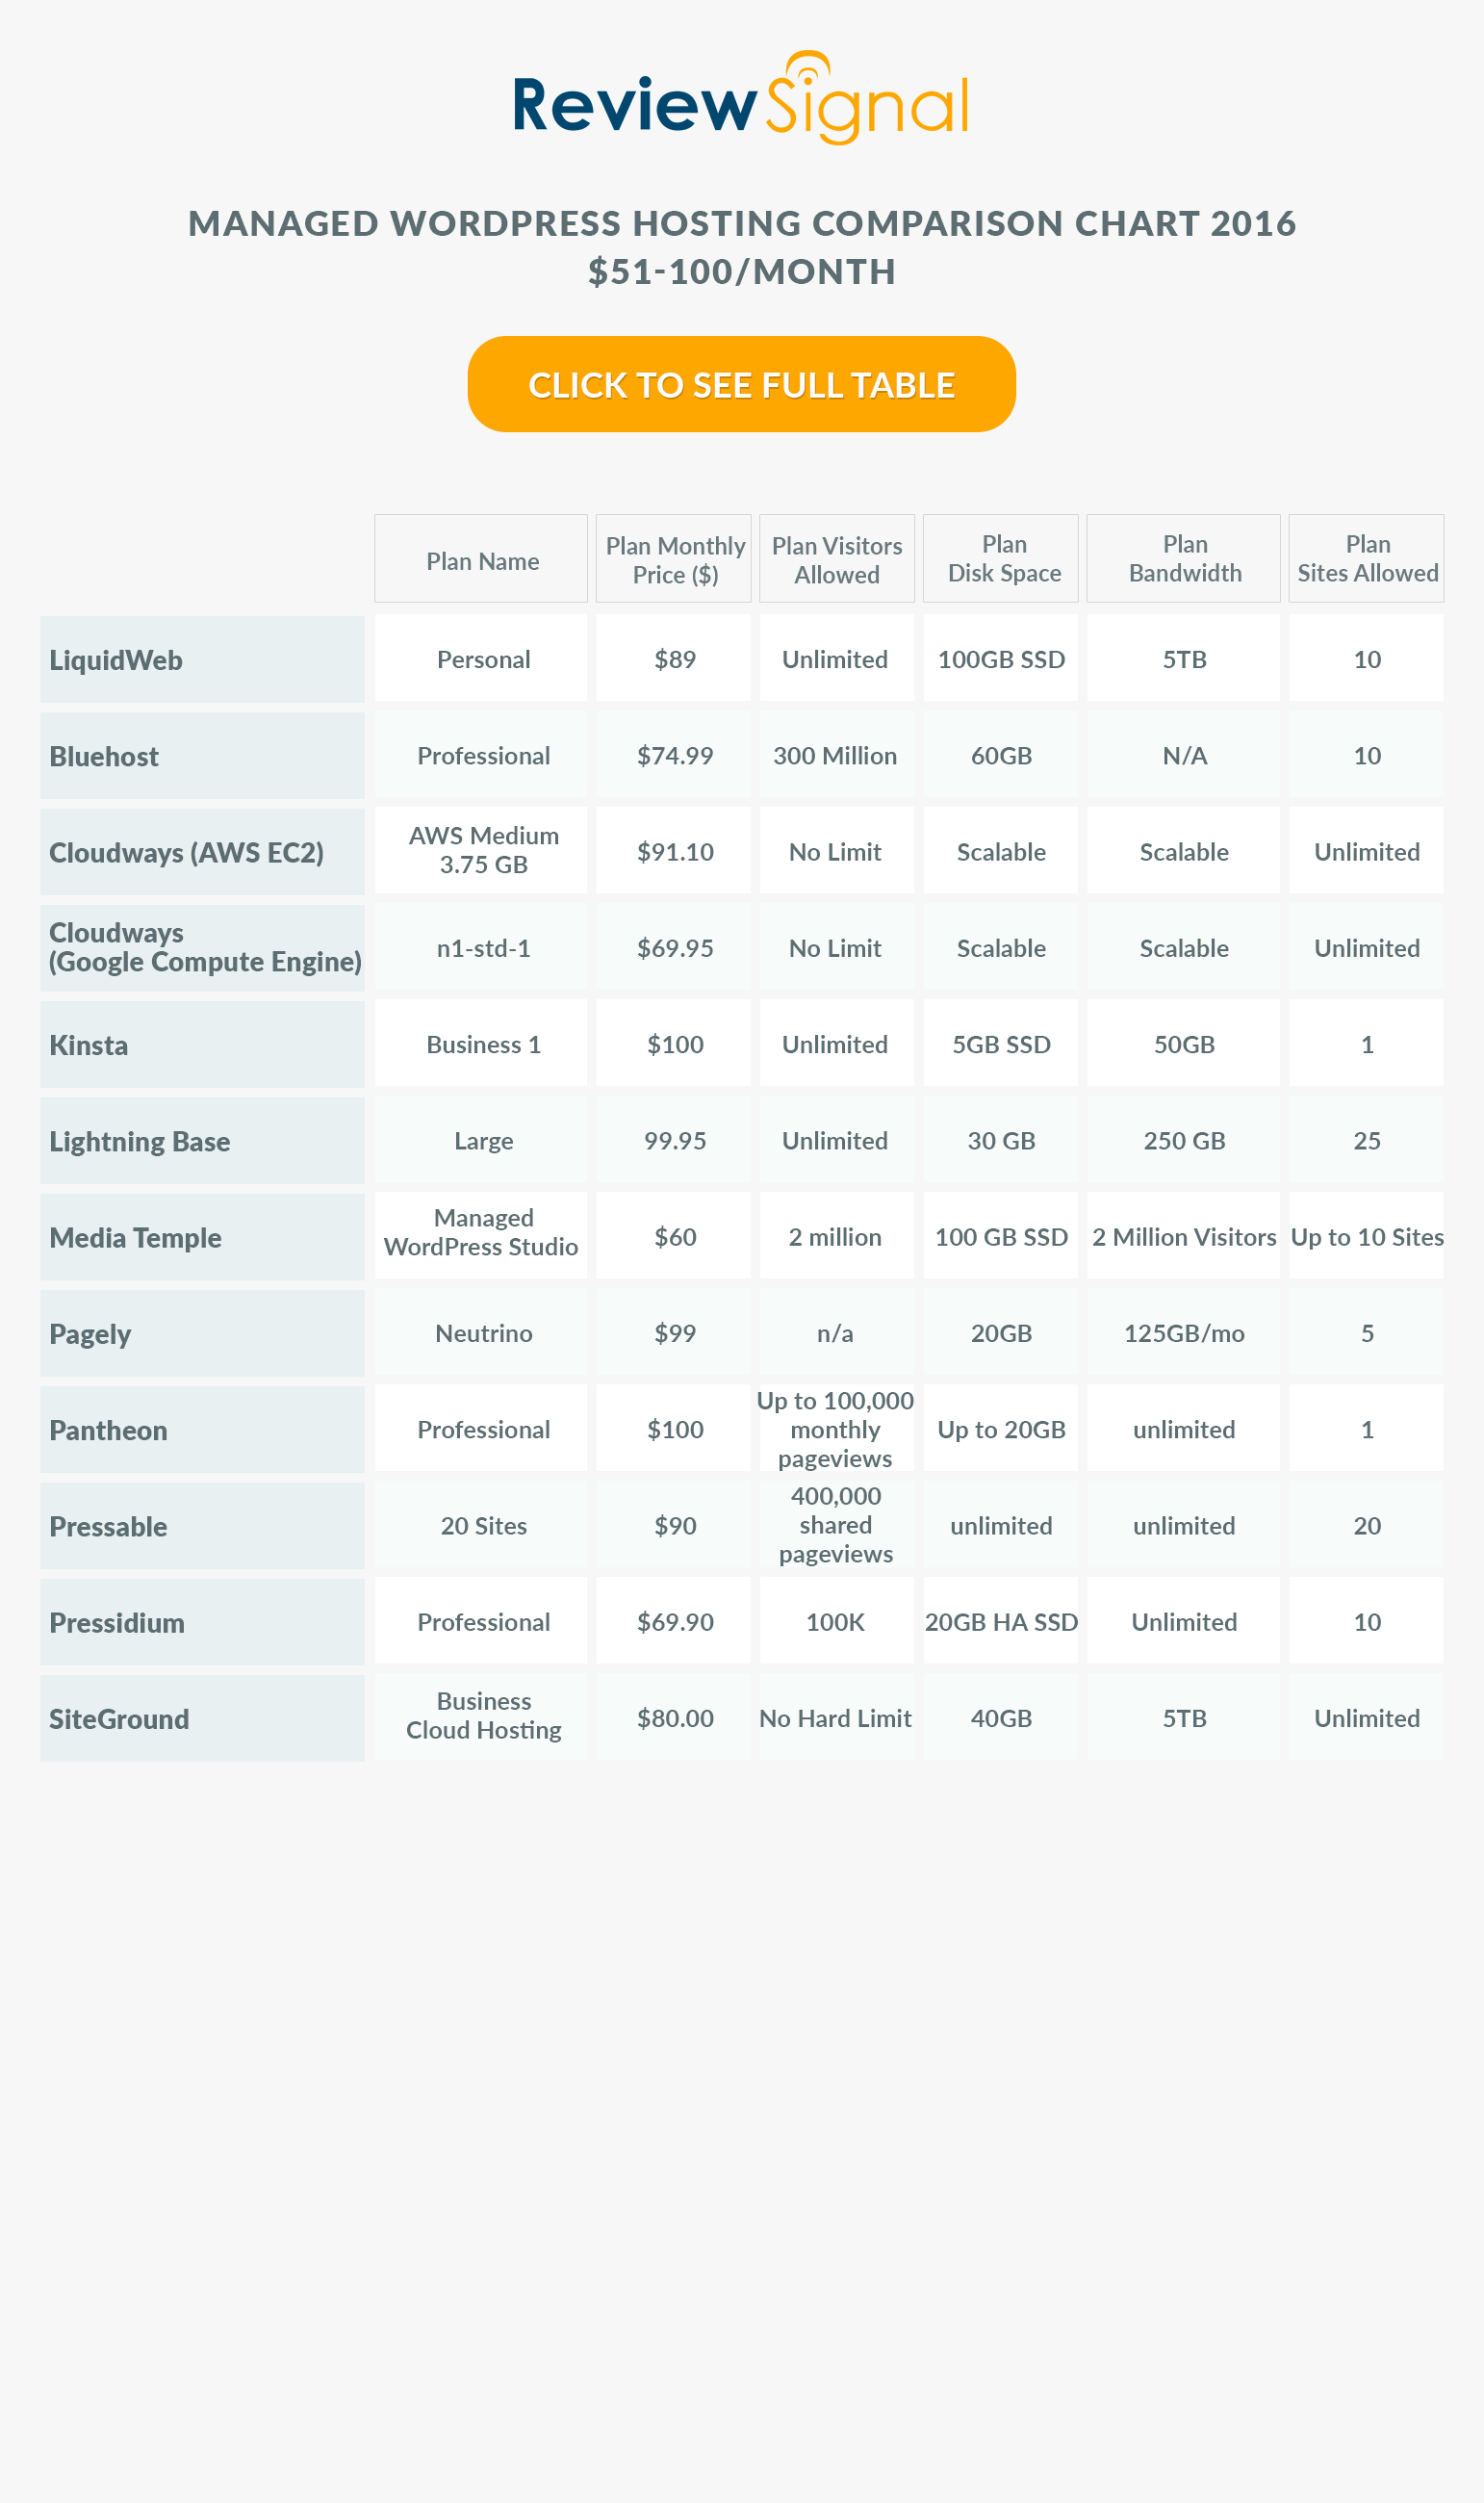
This post focuses only on the results of the testing in the $51-100/month price bracket for WordPress Hosting.
$51-100/Month WordPress Hosting Products
$51-100/Month WordPress Hosting Performance Benchmarks Results
Test 500-3000 Concurrent Users over 30 Minutes, 10 Minutes at Peak
| Company |
Total Requests |
Total Errors |
Peak RPS |
Average RPS |
Peak Response Time(ms) |
Average Response Time(ms) |
Total Data Transferred (GB) |
Peak Throughput (MB/s) |
Average Throughput (MB/s) |
| BlueHost |
322139 |
166336 |
267.9 |
178.97 |
20999 |
9268 |
9.425 |
7.086 |
5.236 |
| CloudWays Amazon |
306701 |
73421 |
214.07 |
170.39 |
15256 |
4810 |
13.9 |
10.05 |
7.723 |
| CloudWays Google |
267495 |
128912 |
199.23 |
148.61 |
15392 |
7341 |
8.35 |
6.595 |
4.639 |
| Kinsta |
416335 |
544 |
324.57 |
231.3 |
15059 |
317 |
24.01 |
19.91 |
13.34 |
| LightningBase |
456430 |
0 |
356.3 |
253.57 |
3909 |
261 |
23.65 |
19.41 |
13.14 |
| LiquidWeb |
520072 |
2745 |
408.3 |
288.93 |
15322 |
525 |
24.04 |
19.69 |
13.35 |
| Media Temple |
486702 |
8588 |
397.55 |
270.39 |
16001 |
582 |
25.43 |
23.08 |
14.13 |
| Pagely |
392898 |
1952 |
298.8 |
218.28 |
15178 |
1593 |
21.38 |
16.85 |
11.88 |
| Pantheon |
409962 |
57051 |
325.53 |
227.76 |
11682 |
762 |
20.74 |
17.97 |
11.52 |
| Pressable |
569095 |
0 |
441.43 |
316.16 |
3152 |
239 |
24.35 |
20.19 |
13.53 |
| Pressidium |
429538 |
0 |
335.78 |
238.63 |
3030 |
306 |
16.11 |
13.26 |
8.951 |
| SiteGround |
449038 |
742 |
352.05 |
249.47 |
11247 |
383 |
22.93 |
19.26 |
12.74 |
Discussion of Load Storm Test Results
Kinsta, LightningBase, LiquidWeb [Reviews], Pressable, Pressidium and SiteGround [Reviews] all handled this test without any serious issues.
MediaTemple [Reviews] had some minor issues with spikes and increasing average response times.
Pagely [Reviews] had some spikes but more concerning was the increased response times which were averaging around 3000ms during the 10 minute peak of the test. It kept the website up and error rate low enough (0.5%), but it was definitely struggling to keep up.
BlueHost [Reviews], CloudWays [Reviews] (Amazon + Google) and Pantheon [Reviews] all struggled with this load test. BlueHost crashed (85% error rate). CloudWays Google had 48% errors. Amazon fared better with only 24%. Pantheon had the lowest error rate at 14% but all of them were unacceptably high along with increase response times.
Test 1-2000 Concurrent Users over 60 seconds
Blitz Test Quick Results Table
Discussion of Blitz Test 1 Results
This test is just testing whether the company is caching the front page and how well whatever caching system they have setup is performing (generally this hits something like Varnish or Nginx).
I also mistakenly ran an extra thousand users against SiteGround (1-3000), but since they performed perfectly, I figured why not just leave it. The chance for random network timeouts is always there, they got a perfect score, I let them keep it. That's why their numbers look higher than everyone else's.
Who performed without any major issues?
Kinsta, LightningBase, LiquidWeb [Reviews], Pagely [Reviews], Pantheon, Pressable, Pressidium and SiteGround [Reviews] all handled this test without any serious issues.
Who had some minor issues?
MediaTemple [Reviews] had some minor issues with load starting to impact response times and some errors/timeouts at the end of the test.
CloudWays (Amazon) managed to keep the server up but started to lag around 35 seconds in with some errors at the very end.
Who had some major issues?
BlueHost [Reviews] and CloudWays (Google) both failed this test.
3. Uptime Monitoring
Both uptime monitoring solutions were third party providers that offer free services. UptimeRobot was paid for and monitoring on a 1 minute interval. All the companies were monitored over approximately two months (May-June 2016).
Uptime Robot & StatusCake
| Company |
StatusCake |
UptimeRobot |
| BlueHost |
99.98 |
99.98 |
| CloudWays Amazon |
100 |
100 |
| CloudWays Google |
99.99 |
99.99 |
| Kinsta |
99.99 |
100 |
| LightningBase |
100 |
100 |
| LiquidWeb |
100 |
100 |
| Media Temple |
99.94 |
99.97 |
| Pagely |
100 |
100 |
| Pantheon |
100 |
100 |
| Pressable |
99.93 |
99.95 |
| Pressidium |
100 |
99.99 |
| SiteGround |
100 |
100 |
I can happily say every single company kept their servers up.
4. WebPageTest.org
Every test was run with the settings: Chrome Browser, 9 Runs, native connection (no traffic shaping), first view only.
| Company |
WPT Dulles |
WPT Denver |
WPT LA |
WPT London |
WPT Frankfurt |
WPT South Africa |
| BlueHost |
0.94 |
0.813 |
0.995 |
1.525 |
1.861 |
5.923 |
| CloudWays Amazon |
0.774 |
0.975 |
1.066 |
0.988 |
1.625 |
3.597 |
| CloudWays Google |
0.706 |
0.644 |
0.929 |
1.107 |
1.706 |
3.37 |
| Kinsta |
0.834 |
0.62 |
0.958 |
1.12 |
1.688 |
3.637 |
| LightningBase |
0.542 |
0.465 |
0.955 |
1.013 |
1.569 |
4.541 |
| LiquidWeb |
0.616 |
0.55 |
1.003 |
1.076 |
1.624 |
5.634 |
| Media Temple |
0.904 |
0.537 |
0.855 |
1.318 |
1.932 |
2.809 |
| Pagely |
0.808 |
0.542 |
1.04 |
1.137 |
1.675 |
5.583 |
| Pantheon |
0.856 |
0.508 |
0.955 |
1.051 |
1.704 |
5.628 |
| Pressable |
1.032 |
0.757 |
1.08 |
1.449 |
1.948 |
5.793 |
| Pressidium |
0.738 |
0.727 |
1.171 |
1.292 |
1.67 |
5.747 |
| SiteGround |
0.867 |
0.678 |
1.114 |
1.176 |
1.671 |
4.56 |
| Company |
WPT Singapore |
WPT Shanghai |
WPT Japan |
WPT Sydney |
WPT Brazil |
| BlueHost |
2.652 |
22.102 |
1.863 |
1.937 |
2.255 |
| CloudWays Amazon |
2.236 |
23.404 |
1.781 |
1.75 |
1.752 |
| CloudWays Google |
2.031 |
22.418 |
2.026 |
1.609 |
1.793 |
| Kinsta |
2.235 |
24.017 |
2.109 |
1.602 |
1.851 |
| LightningBase |
2.227 |
22.437 |
1.683 |
1.968 |
1.612 |
| LiquidWeb |
2.335 |
23.238 |
1.885 |
1.96 |
1.635 |
| Media Temple |
2.19 |
22.265 |
1.814 |
2.101 |
2.091 |
| Pagely |
2.415 |
23.124 |
1.914 |
2.103 |
1.943 |
| Pantheon |
2.093 |
25.209 |
1.781 |
1.975 |
1.804 |
| Pressable |
2.382 |
23.897 |
2.234 |
2.821 |
2.132 |
| Pressidium |
2.245 |
23.303 |
2.061 |
1.785 |
1.747 |
| SiteGround |
2.309 |
22.746 |
2.017 |
2.935 |
1.907 |
LightningBase put up the fastest individual score of any bracket this year in this test with a blazingly fast 0.465ms average response in Denver. Other than that, nothing special here other than all these companies seemed capable of delivering content fast pretty much everywhere in the world except Shanghai.
| Company |
PHP Bench [Seconds] (lower=faster) |
WP Bench [Queries Per Second](higher=faster) |
| BlueHost |
11.655 |
713.78 |
| CloudWays Amazon |
10.993 |
324.99 |
| CloudWays Google |
11.192 |
327.33 |
| Kinsta |
11.333 |
318.47 |
| LightningBase |
10.537 |
1067.24 |
| LiquidWeb |
7.177 |
1084.6 |
| Media Temple |
13.9 |
98.85 |
| Pagely |
10.102 |
165.86 |
| Pantheon |
11.687 |
202.92 |
| Pressable |
10.952 |
492.61 |
| Pressidium |
10.749 |
240.67 |
| SiteGround |
11.522 |
1030.93 |
LiquidWeb put up one of the fastest scores on the PHP Bench at 7.177. Everyone else fell into the 10-14 range we generally see.
The WP Bench saw some slow scores from MediaTemple and Pagely and handful breaking the 1000 barrier in LightningBase, LiquidWeb, and SiteGround. Interestingly, the trend seems to be slower as you go up in price as you get more non-local databases.
Conclusion
This is the last really crowded bracket as we go up in price. It's sitting right at the border of entry level plans and the more serious stuff. This is the first tier that tested plans more heavily than any plan last year as well. The results were also very encouraging.
Top Tier WordPress Hosting Performance
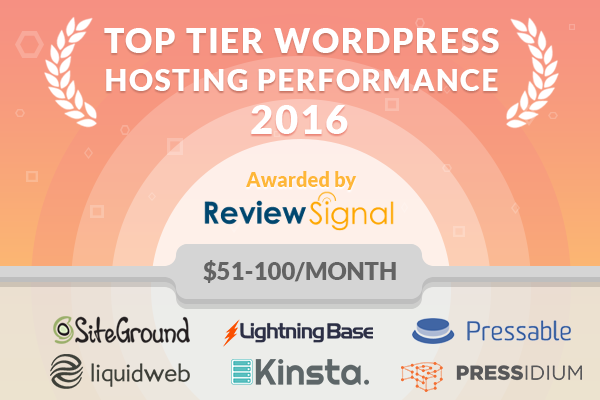
Kinsta, LightningBase, LiquidWeb [Reviews], Pressable, Pressidium and SiteGround [Reviews] all earned top tier WordPress Hosting for the $51-100/month tier.
Honorable Mentions
MediaTemple [Reviews] and Pagely [Reviews] earn honorable mentions. They had some minor issues in the LoadStorm test and MediaTemple had some minor issues in the Blitz test.
Individual Host Analysis
BlueHost [Reviews]
BlueHost fell short again in the load tests.
CloudWays [Reviews] (Amazon + Google)
CloudWays is always interesting because you can compare head to head performance on different cloud platforms. I would pretty confidently say that Amazon outperformed Google in this instance with similar specs (although Amazon charges more).
Kinsta
Kinsta's entry level plan put on a fantastic performance. The higher end providers are starting to show up in this price tier and really showing why they charge their premium prices. Kinsta easily earned top tier status.
LightningBase
LightningBase's most expensive plan that we tested this year (although they offer higher ones), and for the third consecutive price tier (and year), they handled the tests flawlessly. A literaly perfect score for LightningBase: 100% uptime on both monitors and 0 errors on all load tests. Simply perfection. Undoubtedly a top tier WordPress Host.
LiquidWeb [Reviews]
LiquidWeb is a newcomer to this testing and this is their entry level plan. Boy did they make a positive splash. 100% uptime across the board and excellent load testing scores. They also had the fastest PHP Bench in this bracket (and third fastest of any company this year). They have a fantastic reputation here at Review Signal on our reviews section, I can confidently say they also have a top tier WordPress Hosting product to boot.
MediaTemple [Reviews]
Media Temple earned an honorable mention which is a step in the right direction. They had some minor problems with the load tests. No major concerns, just need to figure out security issues and minor performance stuff to make them top tier again.
Pagely [Reviews]
Pagely was a bit of a disappointment. They've been in the top tier the past years but fell to an honorable mention this year. The increased LoadStorm test seemed to put some strain on the server and caused spikes and increased load times. Everything else looked very good like previous years.
Pantheon [Reviews]
Pantheon, like Pagely, struggled with the LoadStorm test, but to a larger degree this year. It knocked them out of the top tier and didn't even earn an honorable mention in this price bracket. Everything else looked very good.
Pressable
Pressable showed up in a big way. No problems in any of the tests. Zero errors on both load tests. Easily in the top tier for this price bracket.
Pressidium
One error, nearly perfect uptime. Hard to really expect a better performance. Pressidium's entry level plan remains in the top tier for another year.
SiteGround [Reviews]
I screwed up with the Blitz load test and they got a perfect score with an extra thousand users which is impressive. They had a small spike at the start of the LoadStorm test but otherwise put on a flawless performance with 100% uptime on both monitors as well. SiteGround is in the top tier.


 WordPress & WooCommerce Hosting Performance Benchmarks 2021
 WooCommerce Hosting Performance Benchmarks 2020
 WordPress Hosting Performance Benchmarks (2020)
 The Case for Regulatory Capture at ICANN
 WordPress Hosting – Does Price Give Better Performance?
 Hostinger Review – 0 Stars for Lack of Ethics
 The Sinking of Site5 – Tracking EIG Brands Post Acquisition
 Dirty, Slimy, Shady Secrets of the Web Hosting Review (Under)World – Episode 1
 Free Web Hosting Offers for Startups