
Sponsored by LoadStorm. The easy and cost effective load testing tool for web and mobile applications.
The full company list, product list, methodology, and notes can be found here
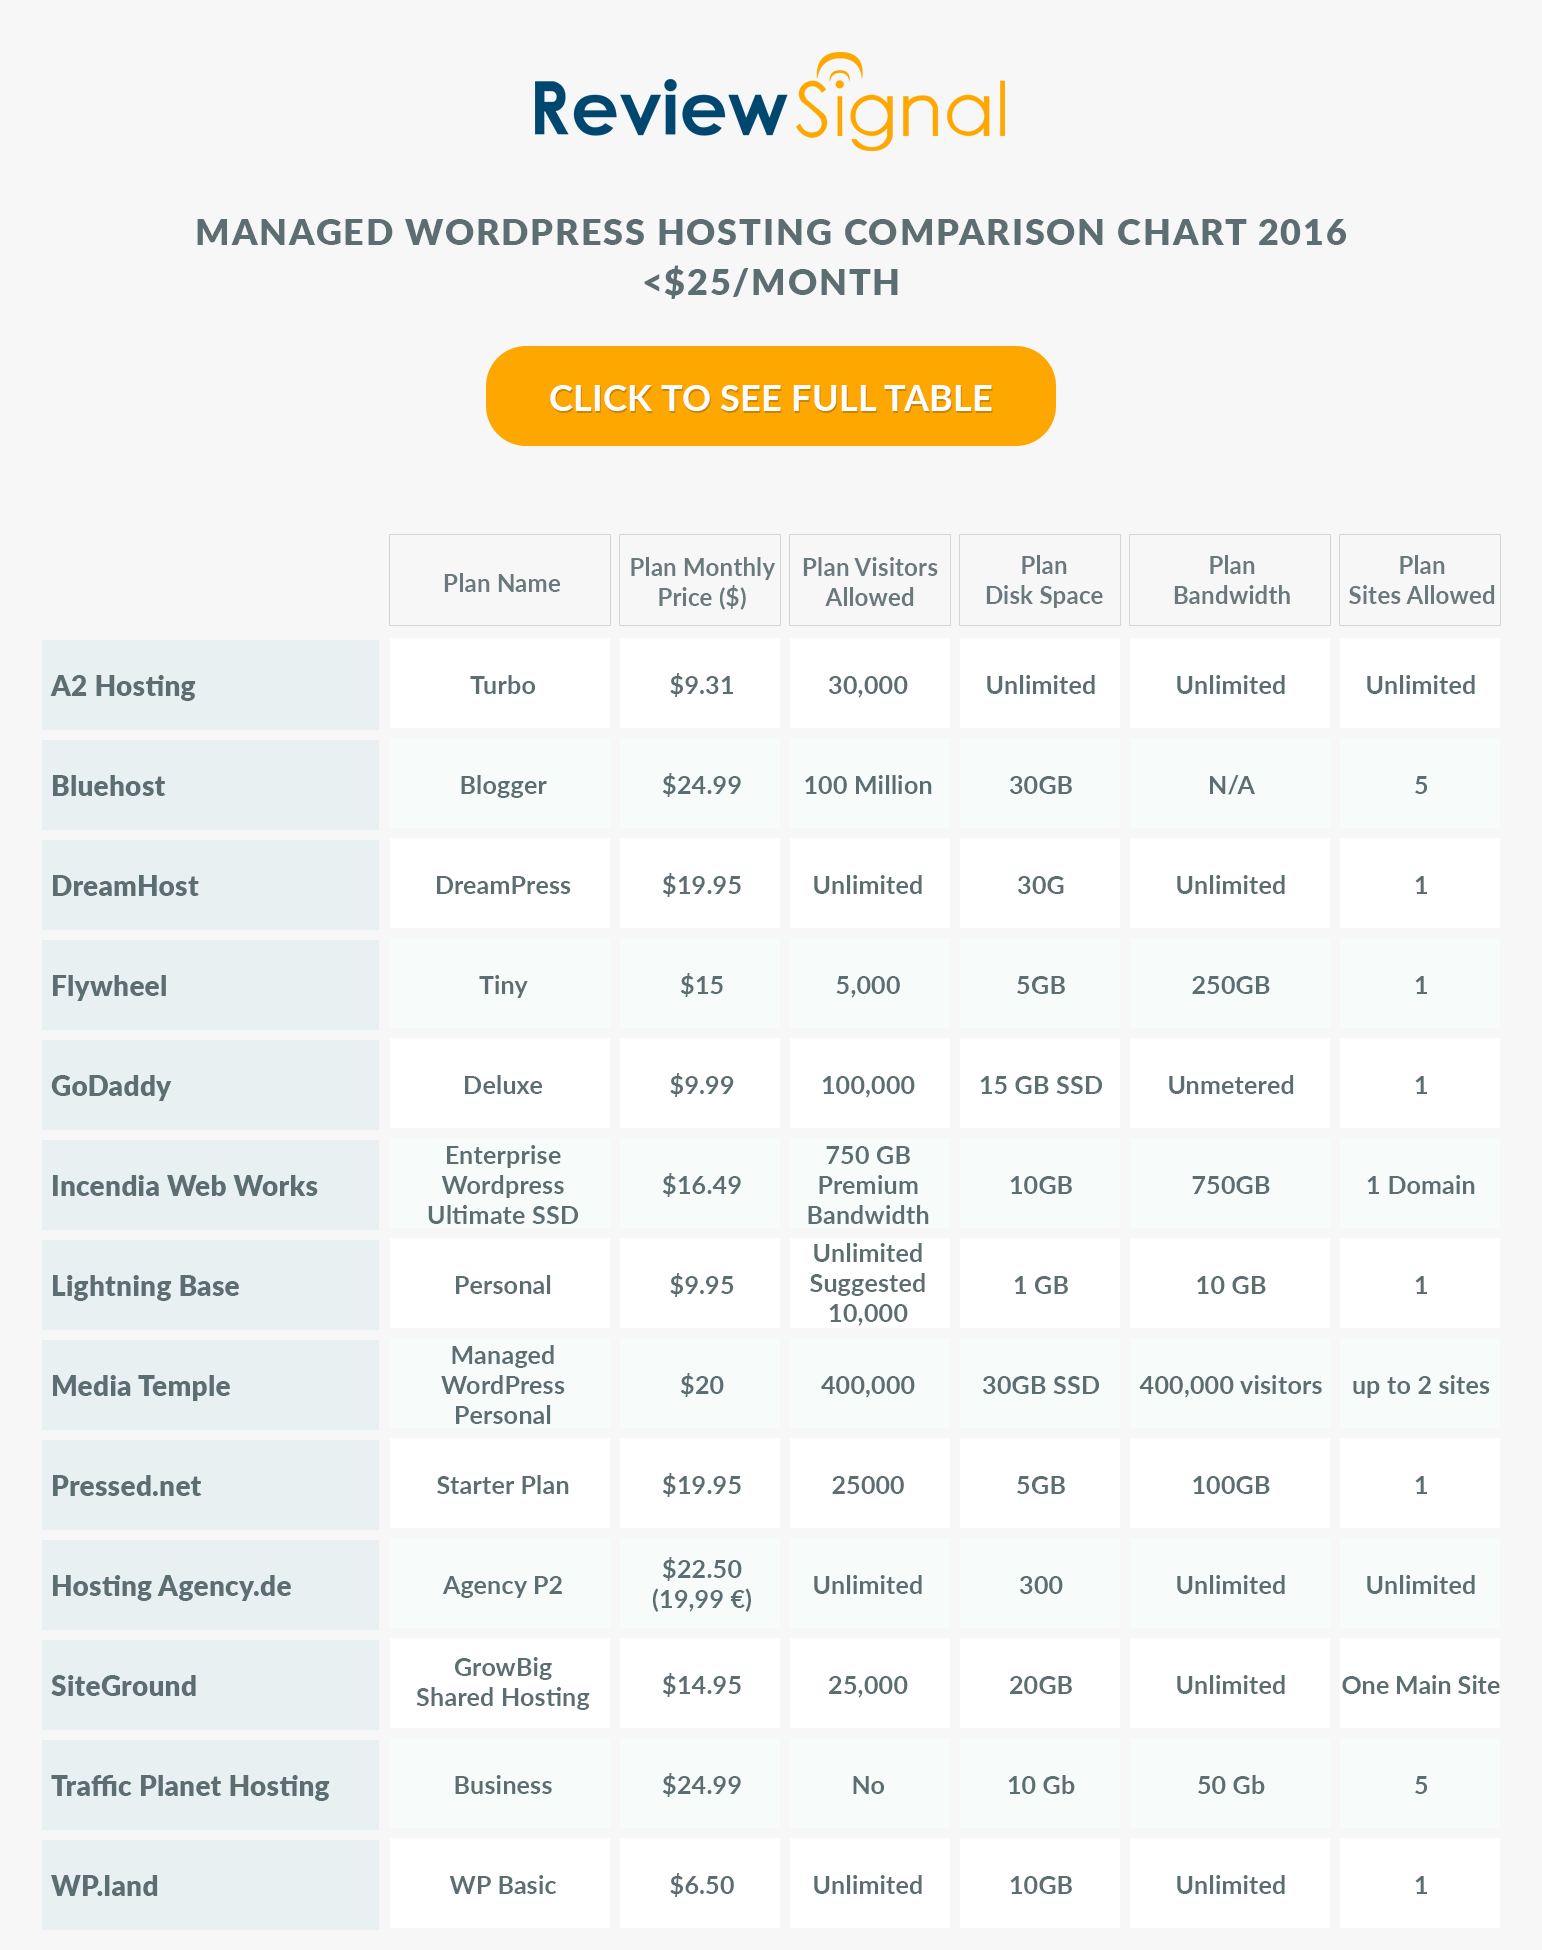
This post focuses only on the results of the testing in the <$25/month price bracket for WordPress Hosting.
<$25/Month WordPress Hosting Products
<$25/Month WordPress Hosting Performance Benchmarks Results
Test 500-2000 Concurrent Users over 30 Minutes, 10 Minutes at Peak
| Company |
Total Requests |
Total Errors |
Peak RPS |
Average RPS |
Peak Response Time(ms) |
Average Response Time(ms) |
Total Data Transferred (GB) |
Peak Throughput (MB/s) |
Average Throughput (MB/s) |
| A2 |
310069 |
203981 |
249.08 |
172.26 |
15138 |
549 |
4.639 |
8.853 |
2.577 |
| BlueHost |
181995 |
153234 |
147.47 |
101.11 |
16000 |
7634 |
1.066 |
3.677 |
0.592 |
| DreamHost |
295685 |
43 |
224.1 |
164.27 |
15063 |
339 |
16.06 |
13.5 |
8.922 |
| FlyWheel |
265618 |
81491 |
205.22 |
147.57 |
15101 |
1154 |
11.5 |
9.361 |
6.391 |
| GoDaddy |
311172 |
1363 |
238.68 |
172.87 |
10100 |
340 |
16.07 |
13.31 |
8.927 |
| Hosting Agency (DE) |
182424 |
117939 |
132.65 |
101.35 |
15991 |
6743 |
3.823 |
10.53 |
2.124 |
| IWW |
272657 |
84 |
217.92 |
151.48 |
10096 |
266 |
14.93 |
13.77 |
8.293 |
| LightningBase |
314439 |
5 |
238.68 |
174.69 |
8989 |
255 |
16.24 |
13.24 |
9.023 |
| Media Temple |
327662 |
1466 |
258.45 |
182.03 |
10628 |
381 |
12.55 |
10.54 |
6.972 |
| Pressed |
289318 |
61 |
214.05 |
160.73 |
15029 |
266 |
16.25 |
13.01 |
9.03 |
| SiteGround |
301722 |
1 |
230.45 |
167.62 |
9374 |
447 |
15.9 |
13.76 |
8.833 |
| TrafficPlanetHosting |
289335 |
476 |
217.63 |
160.74 |
15216 |
570 |
16.15 |
14.08 |
8.974 |
| WP Land |
293166 |
11596 |
228.4 |
162.87 |
15608 |
644 |
15.47 |
13.3 |
8.594 |
Discussion of Load Storm Test Results
The companies that clearly didn't struggle at all with LoadStorm were DreamHost [Reviews], Incendia Web Works (IWW), LightningBase, Pressed, SiteGround [Reviews]. GoDaddy [Reviews], MediaTemple [Reviews] and Traffic Planet Hosting had minor spikes at the start, but they seem nearly inconsequential in the grand scheme of the test.
WP.land seemed to have some security measures which struggled with wp-login being hit so frequently.
A2 Hosting [Reviews], BlueHost [Reviews], FlyWheel [Reviews] and Hosting Agency did not do well on this test. FlyWheel explicitly stated this was too much load for that size plan and recommended upgrading if this was the expected load.
Test 1-1000 Concurrent Users over 60 seconds
Blitz Test Quick Results Table
Discussion of Blitz Test 1 Results
This test is just testing whether the company is caching the front page and how well whatever caching system they have setup is performing (generally this hits something like Varnish or Nginx).
Who performed without any major issues?
DreamHost, IWW, LightningBase, SiteGround, WP Land all handled the test without any issues.
Who had some minor issues?
BlueHost had a couple spikes during the test which caused some errors and timeouts, but they weren't substantial.
FlyWheel had a spike at the very end of the test which caused a large increase in response times.
Pressed started to have a ramp up in response times but it never errored or timed out during the test.
Who had some major issues?
GoDaddy, MediaTemple and TrafficPlanetHosting seemed to pretty clearly hit security measures which couldn't be worked around. The response times were relatively stable, but errors shot up which is symptomatic of a security measure kicking in rather than the server being taxed. It's hard to know how they would have performed sans security measures.
A2 and Hosting Agency did not take kindly to the Blitz test and crashed almost immediately under load.
3. Uptime Monitoring
Both uptime monitoring solutions were third party providers that offer free services. UptimeRobot was paid for and monitoring on a 1 minute interval. All the companies were monitored over approximately two months (May-June 2016).
Uptime Robot & StatusCake
| Company |
StatusCake |
UptimeRobot |
| A2 |
99.92 |
99.91 |
| BlueHost |
30.22 |
18.06 |
| DreamHost |
99.97 |
99.97 |
| FlyWheel |
99.96 |
99.98 |
| GoDaddy |
99.96 |
99.98 |
| Hosting Agency (DE) |
- |
100 |
| IWW |
99.73 |
99.88 |
| LightningBase |
99.99 |
100 |
| Media Temple |
99.96 |
99.95 |
| Pressed |
100 |
99.87 |
| SiteGround |
99.97 |
99.98 |
| TrafficPlanetHosting |
99.98 |
99.98 |
| WP Land |
99.92 |
100 |
BlueHost screwed up and cancelled this account mid-testing causing the uptime to look horrific. Their other two plans which were not cancelled had measurements of 99.98, 99.98, 100 and 99.99 uptime. I'm upset that it happened and there was a struggle to restore the account and have to take credit away for this type of screw up. But, they were able to keep the other servers up with near perfect uptime which I think should be stated here as well.
Hosting Agency for some reason couldn't be monitored by StatusCake (http/2 issue they still haven't fixed for nearly 9 months, which UptimeRobot fixed within 24 hours when I notified them). But they had 100% on UptimeRobot, so it looks good.
IWW had a bunch of short outages and one longer one (2hr 33m) which brought it's uptime down.
Pressed had a 1hr 51m downtime (502 error) recorded by UptimeRobot but StatusCake never picked it up. I'm not sure what to make of that, it might be something wrong with UptimeRobot's servers connecting properly since StatusCake never picked it up over an interval that long.
Everyone else had above 99.9% uptime.
4. WebPageTest.org
Every test was run with the settings: Chrome Browser, 9 Runs, native connection (no traffic shaping), first view only.
| Company |
WPT Dulles |
WPT Denver |
WPT LA |
WPT London |
WPT Frankfurt |
WPT South Africa |
| A2 |
0.819 |
0.638 |
1.109 |
1.181 |
1.687 |
5.054 |
| BlueHost |
0.902 |
0.521 |
0.878 |
1.532 |
1.874 |
3.483 |
| DreamHost |
0.769 |
0.777 |
1.444 |
1.107 |
1.64 |
4.33 |
| FlyWheel |
0.74 |
0.722 |
1.077 |
1.082 |
1.649 |
5.241 |
| GoDaddy |
0.939 |
0.728 |
0.834 |
1.376 |
1.992 |
6.909 |
| Hosting Agency (DE) |
1.299 |
1.258 |
2.17 |
0.985 |
1.55 |
4.905 |
| IWW |
0.544 |
0.658 |
0.864 |
0.929 |
1.416 |
4.105 |
| LightningBase |
0.62 |
0.598 |
1.078 |
0.95 |
1.471 |
5.764 |
| Media Temple |
0.86 |
0.667 |
0.811 |
1.313 |
1.945 |
4.645 |
| Pressed |
0.773 |
0.902 |
1.276 |
1.176 |
1.691 |
4.845 |
| SiteGround |
0.741 |
0.64 |
1.048 |
1.06 |
1.721 |
4.94 |
| TrafficPlanetHosting |
0.793 |
0.562 |
1.26 |
1.212 |
1.723 |
3.522 |
| WP Land |
0.719 |
0.689 |
1.154 |
1.099 |
1.709 |
4.8 |
| Company |
WPT Singapore |
WPT Shanghai |
WPT Japan |
WPT Sydney |
WPT Brazil |
| A2 |
2.244 |
22.287 |
1.974 |
2.003 |
1.895 |
| BlueHost |
2.255 |
22.728 |
1.809 |
1.467 |
2.274 |
| DreamHost |
1.93 |
22.186 |
2.028 |
1.954 |
1.747 |
| FlyWheel |
1.765 |
12.549 |
1.845 |
1.816 |
1.758 |
| GoDaddy |
2.173 |
22.373 |
1.826 |
1.959 |
2.103 |
| Hosting Agency (DE) |
2.311 |
22.406 |
2.651 |
2.772 |
2.596 |
| IWW |
1.98 |
22.547 |
1.615 |
1.96 |
1.535 |
| LightningBase |
1.999 |
19.731 |
1.708 |
1.913 |
1.661 |
| Media Temple |
2.113 |
22.141 |
1.802 |
1.959 |
2.135 |
| Pressed |
2.233 |
23.691 |
1.997 |
2.037 |
1.894 |
| SiteGround |
2.131 |
22.718 |
1.843 |
2.079 |
1.788 |
| TrafficPlanetHosting |
2.081 |
22.74 |
1.872 |
1.595 |
1.816 |
| WP Land |
2.25 |
22.305 |
1.852 |
1.959 |
1.752 |
What I learned was getting traffic into China is terrible. Nobody really did well on the Shanghai location. South Africa is also really slow. Most servers were US based but were delivering content to most corners of the world in about 2 seconds or less which is impressive. Hosting Agency based in Germany was a bit disappointing. Very slow relatively speaking to the US. But it wasn't even the fastest to London or Frankfurt. LightningBase and IWW were able to beat the German company in the US by a large margin and to Europe which reinforces that geographic location isn't everything in terms of speed.
I wish I could compare averages against last year except they removed one of the testing locations (Miami) and I did a global test instead because that was something people wanted to see.
| Company |
PHP Bench [Seconds] (lower=faster) |
WP Bench [Queries Per Second](higher=faster) |
| A2 |
12.626 |
570.78 |
| BlueHost |
13.089 |
1083.42 |
| DreamHost |
17.104 |
446.23 |
| FlyWheel |
11.761 |
387.3 |
| GoDaddy |
13.804 |
278.47 |
| Hosting Agency (DE) |
6.501 |
45.28 |
| IWW |
7.637 |
1869.16 |
| LightningBase |
10 |
1315.79 |
| Media Temple |
12.241 |
339.79 |
| Pressed |
11.036 |
217.2 |
| SiteGround |
11.497 |
733.14 |
| TrafficPlanetHosting |
8.666 |
918.27 |
| WP Land |
14.485 |
684.93 |
What was enormously interesting about WPPerformanceTester results this year was the much larger spread and faster results. Last year, almost everyone was around 10-14 seconds for PHP Bench with the outlier of PressLabs doing 8.9 and DreamHost at 27. DreamHost again has the dubious honor of the slowest PHP Bench but it improved by a whopping 10 seconds down to 17. The fastest was Hosting Agency with 6.5, more than a full 2 seconds faster than last year's fastest speed. IWW, TrafficPlanetHosting also managed sub 10 second speeds.
Last year's fastest WP Bench was 889 queries per second. That was blown away by this years testing with IWW leading the group at more than double the speed (1869). BlueHost, LightningBase and TrafficPlanetHosting all managed to be faster than last year's fastest benchmark as well. Unfortunately, Hosting Agency's incredibly fast PHP bench is somewhat cancelled out by their slowest WP Bench score, which is slower than last year's slowest. It should be noted that transaction speed isn't always a great measured on distributed/clustered/cloud systems that may be running databases on different machines, but at the entry level that's less of an issue. Generally the incredibly fast scores you see are local databases with no network latency overhead.
Conclusion
It is nice to get back to a real entry level analysis with a much more level playing field. Having 13 different companies available to choose from in the <$25/month range is fantastic. Despite the change in this years format, the lower end plans still outperformed the fastest competitors from last year's tests which had plans up to ~$300/month.
Despite the hard price cap in this bracket of testing, there were still some companies that handled all the tests without any serious issue. Many more did very well but ran into minor issues.
The amount of companies jumping into the space is a fantastic win for consumers. In this tier we saw A2, Pressed, WP Land, Hosting Agency, IWW and Traffic Planet Hosting all enter for the first time. They target a variety of different niches within the space and overall it's a win for us, the consumer to have more good choices and options. From a performance standpoint, you can still get amazing performance value for the money even at the lowest tier.
Without further ado, I will tell you who had the best performance, who deserved an honorable mention and then analyze each host individually. I still don't believe in ranking in any particular order, only grouping companies by how well they performed.
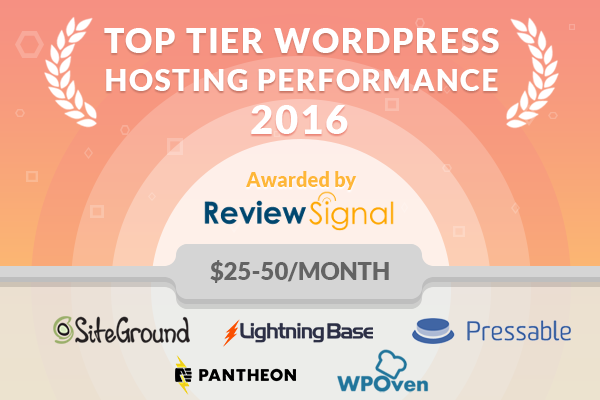
Top Tier WordPress Hosting Performance
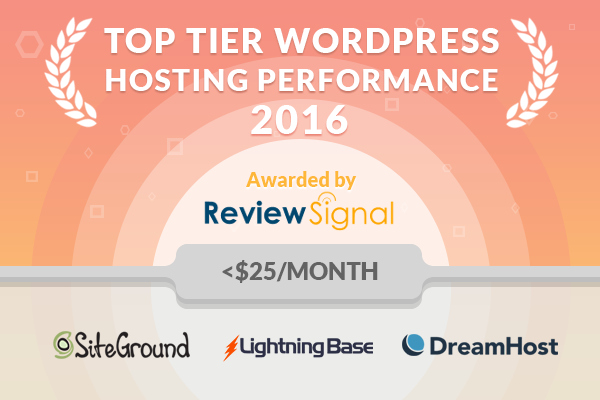
DreamHost [Reviews], LightningBase, and SiteGround [Reviews],
All three of these companies went through the full testing without any meaningful issues.
Honorable Mentions
Pressed had an odd uptime issue but also showed some signs of server stress during the blitz test. For a brand new company they performed admirably, but I'm not quite comfortable awarding them the top tier status quite yet when you compare their results against the three top tier companies, but they put on a very good showing.
WP.land did well in every test except LoadStorm where it had a roughly 4% error rate. It looked like a security issue with wp-login which isn't uncommon. But there were also some spikes/delays as well. It could just be security acting up, but again, a minor issue that kept it out of the top tier, but it was worthy of an honorable mention from yet another new comer to this year's testing.
GoDaddy [Reviews]/MediaTemple [Reviews], I combine this one because it's running on the same tech and the results look very similar and experienced the same security issues. You can pretty clearly see when the security measures kick in on Blitz and I wasn't able to work with their tech team to come up with a way to responsibly bypass their security measures. LoadStorm had a spike at the start with wp-login issues but resolved itself out quickly and had a flat response time graph. It's possible their tech is just as good as the top tier hosts, but I wasn't able to accurately measure it because of security measures but it looks very good and at least deserves the honorable mention.
Traffic Planet Hosting is another new entrant and had similar issues to GoDaddy/MediaTemple. Security issues caused some problems on the Blitz test, but it did start to show some load too. Not perfect, but it did well on LoadStorm as well. (no honorable mention?)
Individual Host Analysis
A2 Hosting [Reviews]
A2 Hosting was a new entrant to this test and as much as I love the competition in the space, A2 fell short. Other than their uptime monitoring which was good, they struggled in all the load testing experiments.
BlueHost [Reviews]
BlueHost specifically messed up with my account in this test and the uptime was terrible because of it. That alone ruined the uptime test, although as I stated in the section, the other servers all maintained excellent uptime which were on different accounts. They did ok in the blitz test, but not in the LoadStorm test. They also surprisingly managed the fastest individual WebPageTest score of any host in this price range. Compared to last year I don't see any huge signs of improvement with regards to performance.
DreamHost [Reviews]
Last year DreamHost's DreamPress product almost made the top tier except for some major downtime issues. This year, they had no such downtime issues and the performance remained top notch. DreamHost earned the top tier status for the <$25/month price bracket. It appears to be an excellent product priced very competitively.
FlyWheel [Reviews]
FlyWheel only entered one product this year and it was less powerful than last year's. It struggled a bit more on the LoadStorm test but the Blitz was perfect (although for this price tier, it was a weaker test than last year's test). They explicitly stated for LoadStorm that the plan was inappropriate for that level of traffic. They can probably handle bigger sites, but if we're comparing dollars to performance, they fell short in this price bracket on that metric. But they are still rated as the most well liked company that we track at Review Signal, so they are clearly doing something right in terms of product and customer service.
GoDaddy [Reviews]
GoDaddy had a stalwart performance marred by what appeared to be security measures. They very well could have a top notch product but we couldn't work out a responsible way to bypass the security measures for the Blitz load test. LoadStorm looked pretty good, one small spike to start and steady up to 2000 users. GoDaddy earned an honorable mention status because the product didn't seem to encounter any non-artificial problems.
Incendia Web Works
IWW did a great job in both load tests. The only concern was uptime, where IWW had 99.73% and 99.88% as recorded by each service. The performance component is definitely there, but a little more consistency and we have another serious competitor in the space. The only reason they didn't earn honorable mention while Pressed did is that there were conflicting uptime reports for Pressed where one showed 100% and the other recorded sub 99.9% uptime. Two independent services showed IWW below 99.9%, so there isn't much doubt about it in my mind. Like DreamHost last year, they put on a great performance showing and I hope next year the servers are a bit more stable and I can award top tier status.
LightningBase
LightningBase continues to impress. The last two years they've put on consistently near perfect tests. Their Blitz result was perfect and their LoadStorm had only 5 errors out of 314439 requests. Combined with 100/99.99% uptime monitors, LightningBase is unquestionably in the top tier for the <$25/month WordPress hosting bracket.
MediaTemple [Reviews]
MediaTemple's results basically mirrored GoDaddy's results. It would be even hard to tell the graphs apart if you removed the names. The MediaTemple/GoDaddy platform appears to be very solid but we couldn't responsibly get by some security measures, so I couldn't award it top tier status, but MT earned an honorable mention.
Pressed
Pressed earned itself an honorable mention. It had a weird uptime issue but more importantly it started to show some signs of load during the Blitz test where I would expect a flat response time from a static cache test like Blitz. It's a very new product and I'm sure we'll continue to see tremendous improvements as time goes on, a very good performance from possibly the newest company in this year's testing.
Hosting Agency
Hosting Agency performed as expected, it appears to have no special WordPress optimizations. If you were to install a basic lamp stack, this is the performance I expect out of the box. They had perfect uptime and oddly found themselves on both ends of the spectrum on my WPPerformanceTester. They weren't faster to England or Germany on WebPageTest, which I suspect is because there was no special caching technologies to accelerate delivery of pages despite being geographically closer. And it just collapsed during the load tests, especially Blitz which is essentially a static cache test (where they have none). Another important note is that their entire system is in German only.
SiteGround [Reviews]
SiteGround got even better this year. They jumped up from honorable mention to top tier status. Their Blitz and LoadStorm tests both improved while everything else remained at a high level. An all around fantastic performance which deserved top tier status.
Traffic Planet Hosting
Another new comer to this years testing. TPH put on a good show, there seemed to be some security measures which ruined the Blitz testing, but the LoadStorm test looked very solid. They earned an honorable mention because the only issue seemed artificial. I'm less confident about the quality of the product than GoDaddy/MediaTemple, but it still seemed to warrant recognition.
WP.land
WPLand was the final new entrant and they put on a fantastic showing. Everything went near perfect except the LoadStorm test which seemed to have an issue with wp-login triggering some security measures. But the response rate was pretty stable and quick despite the ramp up to 2000 users. They also had a perfect blitz test with no errors and a 1ms spread in fastest to slowest response times. WP Land earned honorable mention status because overall it was a very good performance with a small issue that might be security related.


 WordPress & WooCommerce Hosting Performance Benchmarks 2021
 WooCommerce Hosting Performance Benchmarks 2020
 WordPress Hosting Performance Benchmarks (2020)
 The Case for Regulatory Capture at ICANN
 WordPress Hosting – Does Price Give Better Performance?
 Hostinger Review – 0 Stars for Lack of Ethics
 The Sinking of Site5 – Tracking EIG Brands Post Acquisition
 Dirty, Slimy, Shady Secrets of the Web Hosting Review (Under)World – Episode 1
 Free Web Hosting Offers for Startups